Iran J Health Sci 2016; 4(4): 14
The Satisfaction Evaluation of Nutrition Unit in the Largest Teaching Hospital in South of Iran Using Satisfaction Index
Seyyed Koosha Mirmasoudi1 Peivand Bastani2* Mahdi Khansalar3 Mahdiehsadat Ahmadzadeh4 Isa Moradi5
1. BSc in Health Service Management, Nemazee Hospital, Shiraz University of Medical Sciences, Shiraz, Iran. 2. Assistant Professor, Health Human Resources Research Centre, School of Management & Information Sciences,
Shiraz University of Medical Sciences, Shiraz, Iran.
3. MSc, Nemazee Hospital, Shiraz University of Medical Sciences, Shiraz, Iran.
4. MSc student, Health Human Resources Research Centre, School of Management & Information Sciences, Shiraz University of Medical Sciences, Shiraz, Iran.
5. BSc Student, Health Human Resources Research Centre, School of Management & Information Sciences, Shiraz University of Medical Sciences, Shiraz, Iran.
*Correspondence to: Peivand Bastani [email protected]
Abstract
Background and purpose: The quality of cooking and serving food to patients and staff is one of the most important parts of providing services by the hospital hoteling, which could result in an increase in their satisfaction level. The present study was carried out to evaluate the satisfaction level of patients and staff in local domain.
Materials and Methods: The current research was a cross-sectional analytical study carried out in the year 2015 on 1,160 clients in nutrition unit of Nemazee Hospital in Shiraz (680 Patients and 480 staff). The data-collecting instrument was a questionnaire constructed by the researcher in a 5-point scale of Likert from very satisfied to very dissatisfied. The validity of the questionnaire was confirmed by experts and its reliability was confirmed through Cronbach's alpha coefficient (0.81). Data analysis was also performed through SPSS 20 using descriptive and inferential statistics including independent sample t- test, one-way ANOVA, and one-sample t-test.
Results: Mean and standard deviation of satisfaction of staff, patients and their caregivers with nutritional services was 3.06 ± 0.88, 3.17 ± 0.85, and 3.50± 0.84, respectively. The satisfaction levels of staff and patients were also 60.52 and 67.64 percent, respectively.
Conclusion: The results of the present study indicated a higher mean score of satisfaction above average (theoretical mean of 3) in all the studied groups, also this satisfaction level could be improved applying managerial skills, such as better planning, effective personnel development plan, education, and better use of materials in this unit.
Keywords: Satisfaction; Nutrition; Staff; Hospitalized patients; Nemazee Hospital
Citation: Mirmasoudi S K, Bastani P, Khansalar M, Ahmadzadeh M, Moradi I. The Satisfaction Evaluation of Nutrition Unit in the Largest Teaching Hospital in South of Iran Using Satisfaction Index. Iran J Health Sci. 2016; 4 (4):14-24.
Original Article
Iran J Health Sci 2016; 4(4): 15 1. Introduction
Quality of services is one of the most important factors in the survival and growth of all the organizations as well as the hospitals (1). In addition, the patients’ satisfaction in hospitals is considered as a key criterion by which the quality of health care services and the effectiveness of management have been evaluated (2).
Hospitalized patients are known as those to whom a health care system should pay considerable attention. The type of a patient’s nutrition and the way it is served are no exception and need considerable attention to continue the improvement in the quality of health care (3). Proper diet in hospitals is an undeniable aspect of the patient’s treatment and plays a key role in improving the quality of health care. The quality of cooking and serving food to patients is one of the most important parts of providing services by hotelling, which increases patients’ level of satisfaction and the likelihood of their re-visiting to the organization (4). Because food services include both tangible and intangible aspects, any improvement in the quality of food services should contain different components such as menu items, the amount of food, the appearance of trays, health, and services (5). It has been reported that hospitalized patients evaluate the quality of food services based on various factors including taste, nutritional value, health, temperature, size, the time of serving, and users' attitudes (6). In a study, Ghanbari Jahromi indicated that the quality of food was one of the most important principles to which the administrators of hospitals should pay special attention. Moreover, hospital is
considered as a unique organization where providing food services helps the patient with recovery (7). The evidence shows that many chronic diseases that are attributed to aging are indicative of a poor diet (8). Therefore, specific attention should be paid to the significance of proper nutrition in the treatment. Health center staff is no exception to this rule because the spirit and the energy for their job, and their satisfaction with the organization depend to a great extent on the nutritional status. Everybody’s workplace is a place where each person spends almost half of the day and useful and active hours of them, what one eats in office hours, in addition to satisfying their hunger can have a significant effect on the efficacy and their ability (9). The results of different studies show that poor nutrition reduces staff’s productivity (10). In order to reduce costs, Nemazee teaching hospital as the largest teaching hospital in the south of the country has increased the management team’s power of monitoring and decision-making over kitchen and nutrition activities, hence it has increased the quality of food and stakeholders’ satisfaction through considering certain factors such as its largeness, the number of active hospital beds, mass-volume of people’s visits from different parts of the country to this centre, and people’s increased expectations of this organization as the symbols of providing quality services. Hence, in order to increase the efficiency and effectiveness of this important unit in Nemazee teaching hospital, the present study investigated the levels of satisfaction of hospitalized patients and the staff with nutrition services of the studied hospital in a six-month period during the spring and summer, 2015.
Iran J Health Sci 2016; 4(4): 16
2. Materials and Methods
The present study was a descriptive-analytical and cross-sectional study. The population of the study was Nemazee teaching hospital in Shiraz. A total number of 1160 participants, including a staff of 480 from different working shifts and 680 hospitalized patients or caregivers who had used nutritional services in different parts of this center were selected as the sample according to the statistician comment and the result of pilot study. Random sampling technique has been used over a period of six months since the beginning of 2015. Regarding the personnel, the sample was chosen from among the staff who attended the hospital for serving food in the buffet as well as the staff in intensive care units and operation rooms, but for the patient participants, the hospitalized patients and their caregivers were selected from different wards of the hospital including: general internal medicine, pediatric surgery, urodynamic, plastic surgery, neurosurgery, pediatric emergency, adult emergency, pediatric infections, cardiovascular disease, kidney internal, orthopedic surgery and orthopedics, urology, intensive care after the transplant, general surgery intensive care, and intensive care after heart surgery. At the same time, 380 of patients were with special diets. Most parts of the hospital wards were questioned, so that four of the colleagues in the project were present in the wards during the day and in the hospital buffet during the distribution of food with the permission of the management. They had interviews with the staff present in the buffet, hospitalized patients in wards, and their caregivers, and completed the questionnaires. Inclusion criteria were the lack of psychological
problems and having a few meals in the hospital. The researchers sat bedside those patients who were unable to fill out the questionnaires to do it for them.
Research and data collection instrument was a researcher-developed questionnaire in accordance with the Likert scale (very satisfied, satisfied, fairly satisfied, dissatisfied, and very dissatisfied) which was designed consulting the hospital management and experts, and considering the questionnaires available in Ta’alisazan Company. The questionnaire related to the staff contained demographic questions and specific questions related to services provided in the nutrition unit of the hospital. The questionnaire related to the patients included three parts: demographic data, information related to nutrition services provided by the hospital and information about the patients’ diet food (Yes/No).
Face and content validity of the questionnaire was confirmed by professors and experts in this area. At the same time, to determine the reliability of the questionnaire, Cronbach's alpha coefficient (α-0.81) was used.
In order to analyze the collected data, after entering them into SPSS version 20, descriptive statistics were used to determine mean and standard deviation. The relative and absolute frequency distribution tables were also obtained, and inferential statistics was performed. First, normal distribution of data was confirmed by Kolmogorov-Smirnov test (p>0.05), and then parametric statistical tests namely independent sample [t] test, one-way ANOVA, and one-sample t-test were used.
Iran J Health Sci 2016; 4(4): 17
3. Results
Statistical analysis was performed on 1000 returned and non-distorted questionnaires (rate of return was 86.2 percent), while 400 questionnaires were collected from the personnel, and 600 of them were collected from the patients and their caregivers in the target hospitals.
Of the 600 questionnaires distributed in different wards of the hospital, 426 (71 percent) were completed by patients themselves,
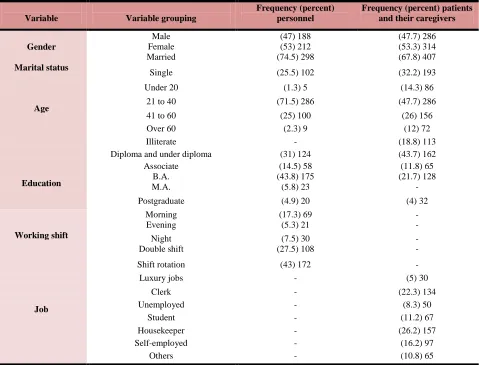
whereas 174 (29%) of them were completed by the patients’ caregivers. Also, 380 of the respondents answered the questions about diet. 267 patients (44.5 percent) were hospitalized fewer than 10 days, 220 patients (36.7 percent) were hospitalized 10 to 20 days, 84 patients (14%) were hospitalized between 20 and 30 days, and 29 patients (4.8 percent) were hospitalized more than 30 days. Other demographic information is shown in Table 1.
Table 1. Frequency distribution of demographic information of the participants
Variable Variable grouping
Frequency (percent) personnel
Frequency (percent) patients and their caregivers
Gender
Male (47) 188 (47.7) 286
Female (53) 212 (53.3) 314
Marital status
Married (74.5) 298 (67.8) 407
Single (25.5) 102 (32.2) 193
Age
Under 20 (1.3) 5 (14.3) 86
21 to 40 (71.5) 286 (47.7) 286
41 to 60 (25) 100 (26) 156
Over 60 (2.3) 9 (12) 72
Education
Illiterate - (18.8) 113
Diploma and under diploma (31) 124 (43.7) 162
Associate (14.5) 58 (11.8) 65
B.A. (43.8) 175 (21.7) 128
M.A. (5.8) 23 -
Postgraduate (4.9) 20 (4) 32
Working shift
Morning (17.3) 69 -
Evening (5.3) 21 -
Night (7.5) 30 -
Double shift (27.5) 108 -
Shift rotation (43) 172 -
Job
Luxury jobs - (5) 30
Clerk - (22.3) 134
Unemployed - (8.3) 50
Student - (11.2) 67
Housekeeper - (26.2) 157
Self-employed - (16.2) 97
Others - (10.8) 65
Iran J Health Sci 2016; 4(4): 18
It should be noted that a number of administrative and logistic sectors, and some para-clinical sectors worked in the morning shifts, and in some cases that their daily works took a longer time than usual they were in the hospital until the evening and had their lunch meals in there. It was also documented that some of these participants chose both morning and evening shifts. Mean and standard deviation of the satisfaction level of staff, patients, and caregivers with nutrition services was 3.06±0.88, 3.17±0.85, and 3.50±0.84, respectively.
The results of the descriptive tables regarding the level of satisfaction with nutritional services after the outsourcing indicated that most of the respondents’ satisfaction level differed with the way they were treated and the food distribution personnel’s observance of hygienic principles. The highest level of dissatisfaction was with the diversity of dinner from the viewpoint of personnel of the hospital (22.67 percent). The percentage of respondents’ satisfaction with the hospital's nutrition services is shown in Table 2.
Table 2. Percentage of the staff, patients and their caregiver’ satisfaction with nutritional services in the nutrition
unit in the first six months of 2015 in Nemazee Teaching Hospital
Very dissatisfied Dissatisfied Fairly satisfied Satisfied Very satisfied Item (22.33%) 69 (22.65%) 83 (9.8%) 70 (17.8%) 55 (10.35%) 32 Personnel
Are you satisfied with the variety of food offered at breakfast
(midnight)? Patient (9.2%) 55 (36%) 216 (31.7%) 190 (20%) 120 (3.2%) 19
(13.5) 54 (26%) 104 (31%) 124 (21%) 84 (8.5%) 34 Personnel
Are you satisfied with the variety of food offered at lunch?
(3.4%) 20 (18.8%) 113 (31.5) 189 (36.5) 219 (9.8%) 59 Patient (22.67%) 73 (24.22%) 92 (9.8%) 78 (16.77%) 54 (7.76%) 25 Personnel
Are you satisfied with the variety of food offered at dinner?
(5.3%) 23 (18.7%) 139 (32%) 192 (30.7%) 184 (10.3%) 62 Patient (10.4%) 42 (13%) 52 (18.5%) 74 (42.3%) 169 (15.8%) 63 Personnel
Are you satisfied with the time of food distribution? (5.3%) 32 (18.7%) 112 (32.7%) 196 (31.5%) 189 (11.8%) 71 Patient (13.5%) 54 (17.5%) 70 (24.5%) 98 (31.5%) 126 (13%) 52 Personnel
Are you satisfied with the temperature of food at the time of
food distribution? Patient (11.2) 67 (25.3%) 152 (31.7%) 190 (26.8%) 161 (5%) 30
(13.5%) 45 (17%) 63 (24.5%) 129 (32.5%) 113 (12.5) 50 Personnel
Are you satisfied with the cleanness of the distributed food?
(4%) 24 (18.3) 110 (31.2%) 187 (30.7%) 184 (15.8%) 95 Patient (12%) 48 (18.4%) 74 (29%) 116 (27.8%) 111 (12.8%) 51 Personnel
Are you satisfied with the type of
served dishes? (15.5%) 93 (31.7%) 190 (29.8%) 179 (18.8%) 113 (4.2%) 25 Patient (12.2%) 49 (21%) 84 (24.5%) 98 (29%) 116 (13.3%) 53 Personnel
Are you satisfied with the cleanness
of the served dishes? Patient (15%) 90 (30.7%) 202 (31.2%) 187 (18.3%) 96 (4%) 25 (19.5%) 78 (20.2%) 81 (22.8%) 91 (27.8%) 111 (9.7%) 39 Personnel
Are you satisfied with the way of food distribution? (4.3%) 26 (16.2%) 97 (33%) 198 (32.3%) 194 (14.2%) 85 Patient (18.5%) 74 (21%) 84 (22%) 88 (25%) 100 (13.5%) 54 Personnel
Are you satisfied with the amount and volume of food?
(5.5%) 33 (20.3%) 122 (31%) 186 (30.2) 181 (13%) 78 Patient (22.7%) 91 (21.5%) 86 (30.3%) 121 (17%) 68 (8.5%) 34 Personnel
Are you satisfied with the taste and
Iran J Health Sci 2016; 4(4): 19
(9.3%) 56 (26.2%) 157
(30.2%) 181 (25.5%) 153
(8.8%) 53 Patient
cooking of food?
(14.2%) 57 (20.2%) 81
(30.3%) 121 (25.8%) 103
(9.5%) 38 Personnel
Are you satisfied with the
appearance of food? Patient (8.8%) 53 (28%) 168 (35.2%) 211 (22.2%) 133 (5.8%) 35 (13.3%) 53 (16.8%) 67
(26.5%) 106 (29.2%) 117
(14.2%) 57 Personnel
Are you satisfied with the seasoning of food (yogurt, salads and soups
...)? Patient (11.5%) 69 (29.2%) 175 (31.2%) 187 (22.7%) 136 (5.5%) 33 (16.5%) 56 (28.65%) 67
(25%) 100 (26.65%) 93
(9.45%) 33 Personnel
Are you satisfied with the quality of
the bread? Patient (13.5%) 81 (30.5%) 183 (26.7%) 166 (23.5%) 135 (5.8%) 35 (15.4%) 62 (15.5%) 61
(20.3%) 82 (31.3%) 125
(17.5%) 70 Personnel
Are you satisfied with the food distribution personnel’s behavior?
(4.2%) 25 (17.3%) 104
(31.3%) 188 (30.3%) 182
(16.8%) 101 Patient
(10.5%) 42 (14.3%) 57
(27.8%) 111 (32.4%) 130
(15%) 60 Personnel
Are you satisfied with the appearance of the food distribution
personnel? Patient (17.7%) 106 (30.7%) 184 (32.2%) 193 (14.8%) 89 (4.7%) 28 (9.3%) 37 (14%) 56
(27.2%) 109 (35.7%) 143
(13.8%) 55 Personnel
Are you satisfied with the hygienic principles of the food distribution
personnel? Patient (16.5%) 99 (30.8%) 185 (31.7%) 190 (15.5%) 93 (5.5%) 33 (10.3%) 41 (12.8%) 51
(27.5%) 110 (35%) 140
(14.4%) 58 Personnel
Are you satisfied with the environmental sanitation of the food-serving place?
(13.5%) 53 (15.5%) 62
(27.8%) 111 (29.8%) 119
(13.4%) 55 Personnel
Are you satisfied with the hygienic facilities of the food-serving place?
(10%) 60 (19.7%) 118
(30.2%) 181 (29%) 174
(11.2%) 67 Patient
Are you satisfied with the time and way of collecting dishes and leftovers?
In terms of satisfaction with the diet, 227 patients (62.3 %) were satisfied with the intended diet and 206 patients (56.9%) were satisfied with the diversity of the diet. 192 patients (50.5%) were also satisfied with the nutritional counseling and the way their questions were answered. Moreover, 202 patients (53.1%) were not satisfied with educational brochures provided for them. 207 patients (54.4%) mentioned that their height and weight had not been measured.
In addition, the staff and the patients’ satisfaction was 60.52 and 67.64, respectively. To calculate the total value of satisfaction, for each of five scales of Likert, ranging from very dissatisfied to very satisfied, scores 1 to 5 were used. The number of items for each score was
multiplied by the scale value and was divided by the total number of staff or patients and then multiplied by 100 and again was divided by 5 and the score of that question or index was achieved. The total value of satisfaction was also calculated through the sum and mean of the scores. Figure 1 shows the comparison between the satisfaction levels of staff and the patients.
The results of one-sample t-test showed that the mean score of patients’ satisfaction was significantly different from the theoretical mean. The mean score of satisfaction was also above the average, that is, the constant value 3 (Table 3).
Iran J Health Sci 2016; 4(4): 20
Table 3. The difference between the mean satisfaction score of all participants with nutrition services of the
hospital and theoretical mean-3
Constant test-3 Variable SD±Mean
T
df P Mean Difference
Patients’ satisfaction 3.27±0.86 6.25 374 p<0.001 0.277
Staff’s 3.06±0.88 1.31 308 p=0.19 0.066
The results of independent t-test and one-way ANOVA showed that the mean score of staff satisfaction with nutrition unit was not significantly different in terms of gender, age, marital status, education level, and work experience (p>0.05) (Table 4). As the education level and work experience have increased, the mean score of satisfaction has decreased, and mean score of satisfaction has increased in older age groups. However, this difference was not statistically significant.
Table 4. Comparison of power units in terms of staff satisfaction research using t-test and ANOVA
results SD±Mean
Grouping Variable
p=0.55 t=0.59 3.09±0.92
Male Gender
3.03±0.81 Female
p=0.63 t=0.48 3.02±0.89
Single Marital status
3.08±0.87 Married
p=0.25 t=1.31 3.20±0.94
Diploma and under diploma Education
2.92±1.02 Associate
3.14±0.74 B.A.
3.07±0.98 M.A.
2.76±0.80 Ph.D. and higher
p=0.15 f=1.77 2.07±0.79
Under 20 Age group
3.06±0.86 21 to 40
3.11±0.90 41 to 60
3.11±0.90 Over 60
p=0.69 f=0.24 3.08±0.85
1 to 10 years Work
experience 11 to 20 years 3.07±0.96
2.93±0.89 More than 20
years
p=0.09 f=2.02 2.69±0.76
Morning Working shift
2.81±0.42 Evening
3.28±0.81 Night
2.93±0.96 Double shift
3.12±0.85 Shift rotation
Iran J Health Sci 2016; 4(4): 21
The results of independent sample t-test and one-way ANOVA showed that the mean score of the patients’ satisfaction and their caregivers with nutrition unit showed no significant difference in terms of gender and the number of days of hospitalization (p˃ 0.05). However, as the length of stay increased, the mean of satisfaction level decreased. At the same time, in terms of age, marital status, education level, and the kind of job of the respondents, it was
statistically significant (p<0.05). Moreover, based on the post hoc test result, illiterate and under-diploma participants had greater satisfaction level than the participants with a B.A. degree or higher. In addition, the participants over age 60 were more satisfied than other age groups. Finally, the occupational group “others” was more satisfied than those with luxury jobs, students, staff, and self-employed participants (Table 5).
Table 5. Comparison of mean satisfaction among patients and their companions with the nutrition unit in terms
of research variables using t-test and ANOVA
Results SD±Mean
Grouping Variable
p=0.06 t=1.80 3.35±0.91
Male Gender
3.19±0.79 Female
p=0.013 t=2.48 3.10±0.92
Single Marital status
3.34±0.82 Married
p=0.001 t=-3.48 3.17±0.85
Patient
Respondent Caregiver 3.50±0.83
p<0.001 t=5.37 3.55±0.86
Illiterate
Education
3.44±0.82 Diploma and under
diploma
2.94±0.86 Associate
3.15±0.81 B.A.
2.72±0.88 Postgraduate
p<0.001 f=7.99 3.10±0.98
Under 20
Age group 21 to 40 3.22±0.84
3.17±0.76 41 to 60
3.80±0.82 Over 60
p<0.001 f=4.85 2.83±1.00
Luxury
Job
3.14±0.85 Clerk
2.98±0.96 Student
3.32±0.75 Housekeeper
3.26±0.76 Self-employed
3.50±0.95 Unemployed
3.75±0.95 Others
p<0.13 f=1.85 3.33±0.81
Fewer than one week The number of
hospitalization days
3.22±0.88 From 1 to 2 weeks
3.36±0.86 From 2 weeks to 1
month
2.86±1.00 More than 1 month
Iran J Health Sci 2016; 4(4): 22
4. Discussion
As it was mentioned, the quality of services is one of the important factors in survival and growth of a hospital. Moreover, patients’ satisfaction is considered a key criterion by which the quality of healthcare services is assessed. Therefore, the present study was conducted to investigate the level of satisfaction of hospitalized patients and the staff in order to increase the efficiency of the hospital by presenting the results. The findings showed that the mean of staff’s satisfaction in each of the three groups of the hospital personnel, patients, and their caregivers is higher than the average. It seems that this hospital has been able to have a desired level of satisfaction. In a study conducted by Khalilifar, the effects of outsourcing on nutrition unit were investigated. The findings indicated outsourcing increased satisfaction and decreased costs. The researchers suggested using this method in order to increase the efficiency of the nutrition unit in other hospitals (10). It was also documented that 44.3 percent of the respondents were not satisfied with the taste, flavor and cooking (dissatisfied and very dissatisfied). This dissatisfaction can be attributed to reasons such as a sudden increase in the amount of food, which causes food to be served with high volume and low quality. The highest level of participants’ satisfaction was with the distribution personnel’s neat appearance and their observance of hygienic principles. This was an indication of the personnel’s observance of the regulation of neatness system and respect to individuals, as well as the promotion of the hospital hoteling. This high satisfaction level was also able to
help increase the participants’ level of satisfaction. Furthermore, the findings indicated that 39.7 percent of the interviewees were not satisfied with the way food was distributed. In this regard, it should be said that fundamental changes are required in the distribution of food. For example, for the distribution of stewed food, when the meat and stew menus are separate, or when there are two different food menus, better measures must be taken, so that by mixing the ingredients together or increased other resources, changes should be applied for a proper distribution of food. This will both prevent the long queues and increase staff’s level of satisfaction. In their study, Ahmadi et al. indicated that 78.8 percent of the patients were satisfied with the nutritional status of the hospital and 21.2 percent were dissatisfied. The patients’ highest level of satisfaction was with cleanness of dishes and the amount of food received, but the lowest level of satisfaction was with food quality (11). The results of the current research indicated that the height and weight of nearly half of the patients were not measured. It was the duty of nursing experts to measure the height and weight of their patients as soon as they arrived in wards. However, the findings showed that to prescribe patients with a certain diet, nutrition experts too should be present at patients’ bedsides. Further, in order to calculate the amount of diet ingredients to be considered for patients, the experts should write the height and weight of their patients in a checklist, and calculate the amount of food prescribed. According to the data obtained from this study, both nursing and nutrition experts have neglected this part. Most patients hospitalized in wards were not aware of the
Iran J Health Sci 2016; 4(4): 23 content of educational brochures prepared for
them by the nutrition unit, or they did not make any attempt to get them, and this issue was acknowledged by many patients themselves and their caregivers. It can be said that the length of the cases of hospitalization as well as the changes in the patients’ caregivers may be a reason for their ignorance, because the diet expert may have provided educational brochures, and changing the patient’s caregiver may be the reason for their ignorance. However, this is not a good justification, and nutrition experts in charge of patients can remind them of the content of educational brochures while visiting patients. They could warn the patients when caregivers are substituted, and insist on the communication of instructions to new caregivers. Most of the participants in this study have had an average-level job related to middle-class average-level of the society and were not considered wealthy. Furthermore, the participants working in luxury jobs, who were hospitalized in the hospital, had lower levels of satisfaction. It might also be said that there was a negative correlation reverse relationship between luxury and popular jobs and the level of satisfaction of these participants. It can be said that a higher level of welfare and being employed in luxury jobs gave the choice of private health centers and the services provided by these centers. Moreover, there was a significant negative relationship between the level of satisfaction and the level of education, so that the participants who had a lower level of literacy had a higher
level of satisfaction with nutritional services.
That is because the higher level of education
brings about a higher income or higher status
for people, and can affect their levels of expectations. This finding was consistent with the result of a study conducted by Jafari et al. in which illiterate people and people with lower levels of education were more satisfied with hospital services (12). In line with the findings and as revealed in the present study, several other studies also showed that patients’ satisfaction with the way health services are provided is affected by demographic variables such as gender, age, level of education, and economic conditions (13-14). However, the current research was not in line with the study of Ebrahimniya and Sheikhi (15,16). Furthermore, the results of the present study indicated that the level of satisfaction with the nutrition unit of this hospital was suitable, and many of the shortcomings could be reformed by presenting a correct and cohesive plan in order to be able to achieve the final goal of all health services, that is, patients’ satisfaction.
Acknowledgement
The researchers of this study would like to thank the officials and experts of Improvement of Quality Office, Dr. Pooyan and Elahe Rahmaniyan and Mr. Amin Amiry and Ali Majidpoor and all other people who helped and supported us in collecting the data and conducting the research.
Conflict of interest
There was no conflict of interest.
Authors’ contributions
SKM, IM and MKh have contributed in data collection and data analysis, MA has prepared the primary draft of the article and PB has supervised the study design and finalized the manuscript.
Iran J Health Sci 2016; 4(4): 24
Reference
1. Sangeeta S, Banwet DK, Karunes S. An
Integrated Framework for Quality in Education: Application of Quality Function Deployment, Interpretive Structural Modeling and Path Analysis. The TQM Journal. 2008; 20(5):
19-502.Doi: 10.1080/14783360500450376.
2. Abdelhafez A. Analysis of Factors Affecting
the Satisfaction Levels of Patients toward Food Services at General Hospitals in Makkah, Saudi Arabia. American Journal of Medicine and Medical Sciences. 2012; 2(6): 123-130. Doi:10.5923/j.ajmms.20120206.03
3. Kazemi M. Analysis of influencing factors in
patient satisfaction and quality hospital services. Journal of Tomorrow Management .2009;
8(21): 63-73.[In Persian]
4. Islam M. A, Fagundo A. B, Arcelus J, Agüera
Z, Jiménez-Murcia S. Olfaction in eating disorders and abnormal eating behavior: a systematic review. Frontiers in psychology. 2015;(6):1431.Doi:10.3389/fpsyg.2015.01431
5. Wilson, Rick, and Caroline Lecko. Improving
the nutritional care of patients in
hospital. Nursing times. 2005; 101(32): 28-30.
6. Bell A.F. Accessing packaged food and
beverages in hospital. Exploring experiences of patients and staff. Journal of Appetite. 2013; 60(1):231-238.
Doi:10.1016/j.appet.2012.10.013.
7. GhanbariJahromi M. Investigation of Food
Services Quality in Hospitals and Strategies for Its Improvement, a Review Study. Sadra Medical Sciences Journal.2014; 2(2):195-206. [In Persian]
8. Norman K, Pichard C, Lochs H, Pirlich M.
Prognostic impact of disease-related
malnutrition. Clinical nutrition. 2008; 27(1):
5-15.Doi:10.1016/j.clnu.2007.10.007
9. Lindorff-Larsen K, Rasmussen H. H, Kondrup
J, Staun M, Ladefoged K. Management and
perception of hospital undernutrition—A
positive change among Danish doctors and nurses. Clinical nutrition. 2007; 26 (3):
371-378.Doi: 10.1016/j.clnu.2007.01.006
10. Khalilifar O, Nejatizarnaghi B, Bakhtiarialiabad
M, Valadkhani A. Survey Role of Outsourcing in Nutrition Unit: Comparison of selected Hospitals with military Selected Hospitals in Tehran.Jhosp.2015; 13 (4): 105-113.[In Persian]
11. Ahmadi B, Zivdar M, Rafirr S. Rate of patient
satisfaction in hospitals of Tehran University Type: cross-sectional study in 2010. J Payavard
salamat. 2010;4(1): 44-53.[In Persian]
12. Jafari Kelarijani SE, Jamshidi R, Heidarian AR,
KhorshidiM. Evaluation of factors influencing patient satisfaction in social security hospitals in Mazandaran province, North of Iran. Caspian J
Intern Med. 2014; 5(4): 232–234.
https://www.ncbi.nlm.nih.gov/pmc/articles/PM C4247488/
13. Wikehult B, Ekselius L, Gerdin B, Willebrand
M. Prediction of patient satisfaction with care one year after burn. Burns.2008;35(2):194-200. Doi: 10.1016/j.burns.2008.09.001.
14. Ameryoun A, Pourtaghi Gh, Yahaghi E, Heidari
S, Bahadori M, Ebrahimnia M, et al. The
relationship between demographic
characteristics of patients' satisfaction from serving in the military hospital clinics. Iran Red
Crescent Med J. 2013; 15(9): 843–847. Doi:
10.1007/s10916-006-9022-3
15. Ebrahimnia M, Ameriun A, Azizabadi Farahani
M, Khodami Vishte. Satisfaction rate of hospitalized patients in military hospitals from presented services. J Mil Med. 2010; 12
(2):101-105.
http://militarymedj.ir/article-1-668-en.pdf
16.Sheikhi M, Javadi A. Patients’ satisfaction of
medical services in Qazvin educational
hospitals. The Journal of Qazvin University of
Medical Sciences.2004;7(5):62-66.[In Persian]