Eukaryon
Eukaryon
Volume 3
Article 34
2-1-2007
Calcium-stimulated Regulatory Volume Decrease in Salmo salar
Calcium-stimulated Regulatory Volume Decrease in Salmo salar
and Alligator mississipiensis Erythrocytes
and Alligator mississipiensis Erythrocytes
Chloe Wormser
Lake Forest College
Follow this and additional works at:
https://publications.lakeforest.edu/eukaryon
Part of the
Aquaculture and Fisheries Commons
,
Cell Biology Commons
, and the
Molecular Biology
Commons
Disclaimer:
Eukaryon is published by students at Lake Forest College, who are solely responsible for its
content. The views expressed in Eukaryon do not necessarily reflect those of the College.
Articles published within Eukaryon should not be cited in bibliographies. Material contained
herein should be treated as personal communication and should be cited as such only with the
consent of the author.
Eukaryon, Vol. 3, February 2007, Lake Forest College Senior Thesis
Calcium-Stimulated Regulatory Volume Decrease in
Salmo salar
and
Alligator mississippiensis
Erythrocytes
Chloe Wormser* Department of Biology Lake Forest College Lake Forest, Illinois 60045
Summary
The mechanisms by which cells compensate for volume fluctuations are not clearly understood and vary among species. Research efforts in our lab have focused on elucidating the pathways involved in regulatory volume decrease (RVD), the process activated in response to cell swelling that allows for volume recovery. Previously, fluorescence microscopy studies performed by Light et al. (2005) revealed that in salmon red blood cells, cell swelling elicits a rise in intracellular Ca2+
concentration (visualized using fluorescence microscopy and the Ca2+ indicator fluo-4-AM). This was most likely due Ca2+ influx from the extracellular environment, because it was not observed in cells bathed in a hypotonic, low Ca2+
medium. The goal of this study, therefore, was to confirm a role for extracellular Ca2+ in the RVD response, using both Salmo salar (Atlantic salmon) and Alligator mississippiensis (American alligator) red blood cells. This was done by exposing cells to different extracellular environments and pharmacological agents that block Ca2+ influx pathways or Ca2+-mediated intracellular signaling cascades. To asses the effects of these manipulations on RVD, median cell volume changes over a 90 minute time course were determined by electronic sizing using a Coulter counter. Salmon cells exposed to a low Ca2+ environment failed to recover from cell swelling, indicating that extracellular Ca2+
was needed for a successful RVD response. Similarly, volume regulation of alligatorred blood cells occurred by a Ca2+-dependent mechanism. Additionally, RVD in alligator cells appeared to occur through an intracellular signaling cascade involving Ca2+
activation of phospholipase A2 and the subsequent
formation of arachidonic acid. Arachidonic acid itself, as opposed to one of its potential breakdown products, aided in volume recovery by stimulating K+
efflux. In conclusion, the results from this study indicate that Ca2+ plays a pivotal role in the RVD response of both salmon and alligator red blood cells.
Introduction
Cells are the basic building blocks of all life forms, no matter how simple or complex. In fact, despite the enormous diversity that exists among organisms, all have the same basic level of organization in that they are composed of one or more cells. Although cell morphology and physiology may vary, both within an organism and among species, all cells conform to a
* The report of the investigation undertaken as a Senior Thesis, to carry one course of credit in the Department of Biology.
common function: maintaining a homeostatic balance, both within the intracellular environment and between the intracellular and extracellular environments (Lang & Waldegger 1997). Securing this steady-state equilibrium is not an easy task, as there are unavoidable instances over the course of a cell’s life in which homeostasis may be challenged (O’Neill 1999). Fortunately, cells have acquired distinctive features that aid in preventing cellular imbalance and recovering from inevitable challenges.
One such feature is the plasma membrane, which is responsible for compartmentalizing the cell and allowing metabolic processes crucial for cell survival to take place in isolation from the external environment (Schultz 1989). The basic structure of the plasma membrane is a phospholipid bilayer embedded with proteins (Goodman 2002). The phospholipids that compose the membrane form a stable bilayer as a result of their amphipathic nature; they possess both hydrophobic phosphate moieties and hydrophilic hydrocarbon tails. As a result of this composition, the plasma membrane permits the selective movement of fat-soluble solutes, both in and out of the cell, in accordance with the concentration gradient established between the extracellular and intracellular environments (Goodman 2002). For ions or molecules that cannot readily traverse the membrane, either due to their size or charge, carriers and channels allow for their transport (Goodman 2002). This transport may be active, if the molecule or ion is moving against its concentration gradient, or passive, if the molecule or ion is moving with its concentration gradient (McCarty & O’Neil 1992). Both types of transport, active and passive, play a role in daily cellular function and are necessary for proper communication between the cell and its surroundings.
Active transport of molecules across the plasma membrane requires both energy and the assistance of a pump (O’Neill 1999). Protein pumps function to recognize and bind a specific substrate molecule and transfer that molecule across the
membrane in the direction that opposes its
concentration gradient (Singer & Nicolson 1972). This process requires energy input, often in the form of ATP (Singer & Nicolson 1972). In contrast, other carriers transport molecules with their concentration gradient; this passive process is known as “facilitated diffusion” (Singer & Nicolson 1972).
Having numerous membrane channels and multiple gating mechanisms at their disposal allow cells to detect different types of perturbations and respond accordingly.
Carriers, pumps, and ion channels are distinct from one another in their affinity and specificity for a given solute. Despite these differences, they all function similarly to assist the cell in responding to physiological conditions by altering plasma membrane permeability to certain molecules and ions (O’Neill 1999). This change in permeability, in turn, adjusts intracellular solute concentration and affects the osmotic gradient between a cell and its surrounding medium (O’Neill 1999). As a result, the movement of osmotically obligated water occurs in coordination with solute transport (Lang & Waldegger 1997). This water and solute flux across the plasma membrane is linked to a major cellular threat: a change in cell volume (McCarty & O’Neil 1992).
The difference in osmolality (i.e., the number of dissolved particles per kg H2O) existing between two media separated by a semi-permeable membrane determines the direction of water flow between them. Specifically, water will travel passively across the membrane from a medium of lower osmolality (more dilute) to higher osmolality (more concentrated); this process is termed osmosis (Lang & Waldegger 1997). Because cells are bathed in an extracellular medium, an osmotic gradient might exist between the
intracellular and extracellular environments.
Consequently, if the osmolality inside the cell is greater than the osmolality outside the cell, water will travel passively into the cell, resulting in cell swelling. In contrast, if the solute concentration within the cell is lower than the solute concentration of the extracellular environment, water will diffuse out of the cell, and the cell will shrink. Such cell volume changes are characteristic of organisms composed of cells that are faced with variable extracellular solute concentrations (O’Neill 1999). For example, many intertidal animals are exposed to an external medium that dramatically and continually changes salinity due to environmental factors, such as evaporation, rainfall, and tidal movements of water (Vidolin et al. 2002). Similarly, the gill epithelia of many teleosts, particularly euryhaline species, are bathed in external environments of fluctuating salinity (Kultz 2002). Such fluctuations may lead to volume changes at the cellular level.
Even cells bathed in a fairly invariable extracellular medium experience shifts in cell volume as a result of changes in intracellular osmolality,which can occur from a variety of cellular processes (O’Neill 1999). For example, the cortical proximal tubule cells of the kidney are challenged with significant fluctuations in intracellular osmolality as a consequence of their role in water and nutrient resorption (Linshaw 1991). Similarly, the crucial role that intestinal cells play in solute absorption leads to changes in the number of osmotically active particles within them and, in turn, changes in their volume (O’Neill 1999). Further, the protein synthesis and degradation that occur in nucleated cells lead to osmotic perturbations, as the synthesis of proteins from amino acids reduces intracellular osmolality, whereas the degradation of proteins into amino acid monomers increases intracellular osmolality (Lang & Waldegger 1997). Clearly, some cell volume fluctuations are unavoidable events that occur as a result of common cellular activities and metabolic functions.
Extreme volume changes, changes that a cell would not typically face under normal physiological conditions, can be induced in vitro. The direct effects of such perturbations on cell homeostasis have been determined experimentally by placing cells in either dilute or concentrated extracellular media. These experiments have shown that drastic shifts in extracellular osmolality result in rapid cell swelling or shrinking and are accompanied by altered cellular functioning (Schultz 1989). For example, the expression of certain genes is osmosensitive, and the activating or deactivating effects that changes in cell volume have on these genes alter the expression of the proteins for which they encode (Lang & Waldegger 1997). Additionally, some genes cannot tolerate abrupt changes in cell volume, so such perturbations result in deleterious effects on the metabolic and enzymatic activities they control (Kultz 2002). In the most basic sense, the mechanical strain imposed on a cell from volume fluctuations affects cell morphology and may even threaten cellular existence altogether; a cell can only expand to a given point before bursting or shrink to a given point before shriveling up in atrophy (McCarty & O’Neil 1992). Thus, to prevent the potential loss of cell integrity resulting from cell swelling or shrinkage, it is crucial that a cell be able to employ specific recovery mechanisms.
These mechanisms do exist in a wide number of cell types. Specifically, certain cells are able to respond to and recover from hypotonic or hypertonic shock by activating the compensatory processes known as regulatory volume decrease (RVD) or regulatory volume increase (RVI) (Chamberlin & Strange 1989). Regulatory volume increase is the process by which a cell counteracts cell shrinkage by activating intracellular processes that increase cell volume through solute and water uptake. In contrast, RVD is the compensatory response by which cells decrease their volume through the loss of solutes and water to recover from exposure to a dilute extracellular medium and subsequent swelling (McCarty & O’Neil 1992). The fact that RVI and RVD allow for cell volume restoration following instances of severe anisosmotic stress make them critical parts of the cellular machinery. This explains why they are such highly conserved mechanisms; indeed, rudimentary cell volume regulatory processes occur in most prokaryotic cells (Schultz 1989).
The processes involved in RVD have been studied extensively in many cell types. In those studied to date, such as human ciliary epithelial cells (Adorante & Cala 1995), Necturus red blood cells (Bergeron et al. 1996), Erlich ascites tumor cells (Hoffman et al. 1986), and Madin-Darby canine kidney cells (Rothstein & Mack 1992), the RVD mechanism activated by cell swelling ultimately leads to net K+
and Cl
efflux. This efflux is essential for volume recovery, as it reverses the driving force for water flux across the membrane. The intracellular signaling cascades that result in K+ efflux have also been examined, and some of these cascades involve protein kinase C (PKC) (McCarty & O’Neil 1992). For instance, in Necturus red blood cells, RVD occurs through a PKC-dependent cascade that eventually results in the loss of K+ and Cl- from cells (Light et al. 1998). Similarly, changes in cell volume and cell volume recovery mechanisms in astrocytes are PKC-sensitive (Bender et al. 1992).
Additional intracellular messengers have been shown to play a role in activation of K+-Cl- loss, such as calmodulin and arachidonic acid. Calmodulin is a Ca2+
pathways, including cell volume regulation in certain cell types (Huang et al. 2001). Specifically, activation of this cellular messenger is crucial for RVD in astrocytes (Quesada et al. 1999, Bender et al., 1992), and Necturus red blood cells depend on calmodulin for a successful RVD response (Bergeron et al. 1996). Arachidonic acid metabolites, called eicosanoids, are also involved in volume recovery mechanisms. For example, eicosanoids mediate RVD in trout proximal renal tubules (Kanli & Norderhus 1998). Similarly, a 5-lipoxygenase metabolite of arachidonic acid is involved in regulation of Necturus cell volume (Light et al. 1997). Clearly, the intracellular processes involved in volume decrease are often rather complex, with numerous cell signaling agents working in coordination to activate and carry out the RVD response.
Despite the necessity of K+-Cl- efflux for cell volume recovery, large shifts in the intracellular concentrations of such ions can have destabilizing effects on cells (Lang & Waldegger 1997). Therefore, the loss of organic solutes, such as sugars and amino acids, is also commonly involved in cell volume regulation (Chamberlin & Strange 1989). For example, loss of the amino acid taurine has been implicated in the RVD processes that take place in trout erythrocytes (Garcia-Romeu et al. 1991, Huang et al. 2001), and in Ehrlich ascites tumor cells, both taurine and glycine efflux occur following cell swelling (Hoffman & Lambert 1983). A cell’s ability to use organic osmolytes to
adjust intracellular solute concentration is
advantageous, as the loss of many of these molecules does not cause deleterious effects on cell functioning (Chamberlin & Strange 1989). This is of key importance because preventing cell damage from volume fluctuations must not occur at the cost of ionic imbalance, as this could also be detrimental to cell integrity.
Despite what has been learned regarding cell volume regulatory mechanisms, much is still unknown concerning the initial steps that lead to activation of RVD. In particular, the role that Ca2+ plays in RVD initiation and signal transduction is widely debated. Calcium is known for the essential role it plays in many cellular processes, such as muscle contraction (Martonosi 2000) and neurotransmission (DeLorenzo 1981), but its utility extends much further. For example, Ca2+ is involved in activities that range from inducing apoptosis (programmed cell death) (Orrenius et al. 2003) to stimulating sperm motility in carp (Krasznai et al. 2000).
A role for this signal molecule has also been identified in the volume regulatory processes of numerous cell types, including human ciliary epithelial cells (Adorante & Cala 1995), choroids plexus epithelial cells (Christensen 1987), Necturus red cells (Light et al. 1999), Madin-Darby canine kidney cells (Rothstein & Mack 1992), proximal tubules (McCarty & O’Neil 1990), and rat lacrimal acinar cells (Speake et al. 1998). In these cell types, Ca2+
plays an important role in activating intracellular events that culminate in solute efflux. However, in other biological systems, Ca2+ is not essential for volume recovery, although it does assist in achieving an optimal RVD response. This is the case for rat liver cells (Bear 1990) and cultured astrocytes (Quesada et al. 1999). In contrast, findings from other research indicate either an RVD scheme completely independent of Ca2+ or a mechanism by which a rise in
Ca2+ during cell swelling is a non-crucial
epiphenomenon. For example, rat cerebellar astrocytes employ a volume recovery response that
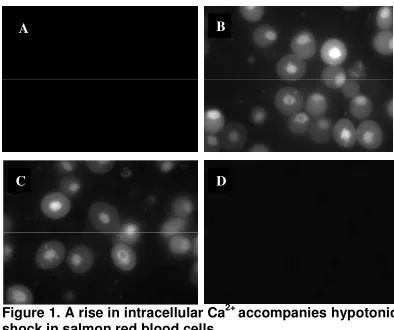
Figure 1. A rise in intracellular Ca2+ accompanies hypotonic shock in salmon red blood cells.
The amount of fluorescence visible in red blood cells loaded with fluorescent dye (fluo-4, 10
µ
M) and exposed to UV light was dependent on the extracellular medium the cells were bathed in. (A) Cells bathed in isosmotic solution failed to fluoresce. (B) Cells treated with the Ca2+ ionophore A23187 (positive control) in an isosmotic solution displayed fluorescence. (C) Exposure to hypotonic shock increased the degree of fluorescence in the red blood cells. (D) When Ca2+was buffered to 10 nM with EGTA in a hypotonic medium, no fluorescence was observed. The above fluorescent microscopy studies were conducted by Light et al. (2005).
lacks Ca2+
involvement (Morales-Mulia et al. 1998), as do trout proximal renal tubules (Kanli & Norderhus 1998) and trout erythrocytes (Garcia-Romeu et al. 1991). Clearly, whether a dependency on Ca2+ for RVD exists is controversial and appears to vary among cell types. Furthermore, for those cell types in which Ca2+ does appear to play a role in volume restoration, the exact pathway by which it operates has yet to be determined.
The goal of my research was to help clarify the inconclusive relationship between Ca2+ and regulatory volume decrease. To do so, I studied the effects of Ca2+ manipulation on RVD in both Atlantic salmon (Salmo salar) and American alligator(Alligator mississippiensis)erythrocytes, in an effort to determine whether the signal transduction pathways stimulated by cell swelling are Ca2+-dependent or Ca2+-independent. Previous research in our laboratory provides evidence for potential involvement of Ca2+ in the RVD response of salmon red blood cells (Light et al. 2005). Using fluorescent microscopy, Light et al. (2005) tracked changes in the intracellular Ca2+ of the cells (Figure 1). They observed that cells bathed in an isosmotic medium displayed virtually no fluorescence, which was indicative of low Ca2+
levels under basal conditions. However, exposure to a dilute extracellular environment elicited a dramatic increase in fluorescence, which suggests that salmon cells experience a rise in intracellular Ca2+
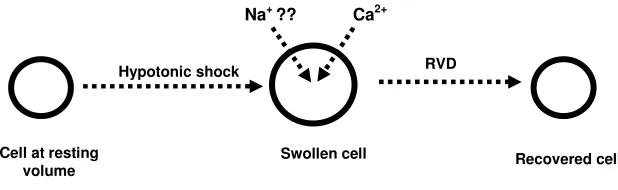
in response to hypotonic shock. Based on the findings of Light et al. (2005), my aim was to characterize the role of Ca2+ in RVD further. Specifically, my study rested on the following three hypotheses: 1) Cell swelling is accompanied by a rise in intracellular Ca2+
necessary to stimulate RVD, 2) the source of this Ca2+
is extracellular, and 3) Ca2+ activates an intracellular event essential for volume recovery. If RVD does indeed depend on extracellular Ca2+, then I expected removing this Ca2+ source would inhibit the volume recovery response. In contrast, if RVD is Ca2+
-independent, then Ca2+
removal should
C D
have no effect on the ability of cells to regulate their volume following hypotonic challenge. Additionally, blocking Ca2+ entry into cells using Ca2+ transport antagonists should inhibit RVD if Ca2+
influx is required to facilitate the volume recovery process. However, if Ca2+ influx is not an essential step, then no effect should be observed following inhibition of Ca2+ permeability pathways. Lastly, if the role of Ca2+ is to stimulate an intracellular signaling cascade crucial for volume recovery, then blocking the signaling events occurring downstream of Ca2+ activation should also result in the failure of cells to respond appropriately to anisosmotic challenges. But if these Ca2+-activated signaling events are not involved in RVD, antagonizing them should not inhibit volume regulation.
I chose to focus on salmon and alligator cells because the lifestyles of these organisms suggest that they would be good models for studies on cell volume recovery. In particular, salmon are euryhaline marine teleosts, meaning they can tolerate both freshwater and saltwater environments (Handeland et al. 1996). They are also anadromous, making multiple migratory trips between freshwater and saltwater throughout the course of their lives (Handeland et al. 1996). The fact that they are able to adapt to such varying degrees of salinity suggests that their cells, which may come in contact with the extracellular environment during transport through the gills, have a finely-tuned mechanism for coping with cell volume deviations.
Likewise, although alligators are primarily found in freshwater, they can tolerate abbreviated episodes in brackish environments (Richards et al. 2004). Additionally, they hibernate during the winter and can also endure freezing conditions for short periods of time (Lance & Elsey 1999). Hibernation results in reduced blood flow to the kidneys and consequent reduced renal activity (Zancanaro et al. 1999). Kidney cells play a crucial role in adjusting extracellular fluid osmolarity. Therefore, abrupt changes in kidney cell activity as a result of hibernation could result in cell volume changes. In addition, exposure of alligators to freezing conditions has a fairly rapid stimulatory effect on stress hormone production, which initiates a change in plasma ion concentration (Lance & Elsey 1999). A more long-term effect of such exposure includes retardation of protein synthesis (Lance & Elsey 1999). As stated earlier, such changes in osmolyte concentrations correspond with a shift in the osmotic gradient between intracellular and extracellular environments and, consequently, lead to either cell swelling or shrinkage (McCarty & O’Neil 1992). Therefore, the ability of alligators to cope with such challenges is presumably allowed for, at least in part, by a well-developed cell volume regulatory mechanism.
In addition, unlike mammalian erythrocytes, red blood cells from salmon and alligators are nucleated. This allows for protein synthesis and degradation to take place within them (Lang & Waldegger 1997), activities that alter intracellular osmolality. This suggests that the red blood cells of both species may be adapted to deal with shifts in solute concentration (Lang & Waldegger 1997). Furthermore, these cells are free floating, so they do not require a substrate on which to grow. Additionally, the characteristic pigmentation of these cells makes osmotic fragility studies possible.
The continuation of research in this field promotes a better understanding of cell physiology, and uncovering the underlying processes involved in RVD
has practical applications, as well, including the study of certain pathophysiological conditions. For example, apoptosis is the process by which cells marked for destruction lose water and solutes in a feed-forward mechanism until they are reduced to a size that can be easily engulfed by phagocytic cells (Okada & Maeno 2001). Overactive or dysfunctional apoptosis are characteristic of diseases including neurodegeneration and cancer (Okada & Maeno 2001). The obvious parallels between apoptosis and RVD, mainly that both proceed in a controlled manner that allows for volume reduction (Okada & Maeno 2001), suggest that clarification of the RVD pathway may be useful when developing methods for either inducing apoptosis in apoptotically deficient cells or inhibiting it in cells displaying overactive apoptosis.
Another disease state related to RVD in its mechanics is ischemia, which is characterized by a lack of oxygenated blood flow to cells and often accompanies a blood clot or stroke (Pasantes-Morales et al. 2000). One of the hallmark events that occurs
during ischemia is significant cell swelling.
Subsequently, ischemic cells are able to recover from this swelling by the loss of K+
and organic osmolytes (Pasantes-Morales et al. 2000). However, the recovery rarely occurs quickly enough to prevent some amount of cell damage (Diaz et al. 2003). It has been proposed that enhancing the rate of cell volume recovery may be the key to preventing irreversible damage to these cells (Diaz et al. 2003). To develop a method for quickening this rate, further research on cell volume recovery processes is needed.
Finally, while similarities can be recognized between RVD, apoptosis, and ischemia, other disorders are largely the direct consequence of insufficient or faulty cell volume regulation. These include renal disease, diabetes mellitus, dehydration, and cerebral edema (McManus et al. 1995). The potential for developing better techniques for managing these disease states lies in the ability to elucidate the pathways involved in the underlying cell volume regulatory mechanisms.
Materials and Methods
Experimental Design
The first hypothesis I set out to test was whether extracellular Ca2+
is necessary for RVD. Presumably, if extracellular Ca2+
is required for a successful RVD response, then in its absence cells should fail to regulate their volume effectively. However, this manipulation should have no effect if RVD is Ca2+ -independent. To distinguish between these two possibilities, I carried out calcium influx studies in which Ca2+ was removed from the extracellular environment using the extracellular Ca2+ chelator ethylene glycol-bis(2-aminoethylether)-N,N,N′,N′-tetraacetic acid (EGTA). Additionally, I performed experiments where plasma membrane permeability to Ca2+
was increased using A23198, an ionophore that facilitates Ca2+ entry into cells (Light et al. 2003). I expected this to have the opposite effect of removing Ca2+. That is, increasing Ca2+
influx should enhance RVD if Ca2+
plays a role in stimulating the volume regulatory response.
If the results of the above studies supported my first hypothesis (i.e., Ca2+ is necessary for RVD and is extracellular in origin), I next wanted to characterize the Ca2+
influx pathways activated subsequent to cell swelling to identify how Ca2+
are three main entry sites that could facilitate Ca2+ influx: stretch-activated channels, ligand-gated channels, and voltage-sensitive channels (McCarty & O’Neil 1992). Stretch-activated channels have been shown to be a major site for Ca2+
entry in numerous cell types (McCarty & O’Neil 1992). For example, Christensen (1987) concluded that hypotonic shock stimulates the opening of stretch-activated channels that are permeable to Ca2+
in the plasma membrane of choroids plexus epithelia. Also, Hoyer et al. (1994) named stretch-activated ion channels as the site of Ca2+ entry following hypotonic exposure of porcine endocardial endothelia. Ligand-gated cation channels, such as P2 receptors, also allow significant amounts of Ca2+
to cross the plasma membrane of many cells, including red blood cells (Ralevic & Burnstock 1998). Light et al. (2003), for example, showed P2 receptors as a likely site for Ca2+ entry into Necturus red blood cells following hypotonic shock. In contrast to stretch-activated and ligand-gated channels, voltage-sensitive channels are typically restricted to neurons and muscle cells (Jones 1998). Accordingly, I decided to first examine those entry pathways that have been strongly implicated in solute influx during RVD.
To address the role of stretch-activated channels in RVD, I used the pharmacological agents lanthanum and gadolinium. Lanthanum is a broad-spectrum Ca2+ channel inhibitor, but it shows some selectivity toward stretch-activated channels, which tend to be permeable to Ca2+
(Yang & Sachs 1989). Gadolinium primarily blocks stretch-activated channels, but there is some evidence suggesting that this agent also antagonizes P2 receptors (Nakazawa et al. 1997). These agents have proven to be potent inhibitors in many cell volume studies. For example, Adorante & Cala (1995) and Rothstein & Mack (1992) found that treating cells with lanthanum has an inhibitory effect on cell volume recovery following hypotonic shock of nonpigmented human ciliary epithelial cells and Madin-Darby canine kidney cells, respectively. Light et al. (2003) discovered that Ca2+ entry into Necturus red blood cells after hypotonic shock occurs through a gadolinium-sensitive channel, as use of this agent inhibits volume recovery. Similar RVD inhibition in response to gadolinium treatment was observed in rat lacrimal acinar cells by Speake et al. (1998).
Accordingly, I expected volume recovery to be weakened in the presence of these Ca2+ transport antagonists if their sites of action correlate with the calcium entry pathways active during RVD of salmon and alligator cells, whereas they should have no effect on volume recovery if they act on influx pathways not involved in the volume regulatory responses of these cell types.
To further determine the entry site for Ca2+ , I examined the effects of targeting P2 receptors, specifically the P2X class, which .are ATP-gated, Ca
2+
permeable channels (Nakazawa et al. 1997). To address whether they are involved in the RVD process, I utilized the ATP scavenger hexokinase, as extracellular ATP has been shown to stimulate RVD in several cell types by activating P2 receptors (Dezaki et al. 2000, Light et al. 2001, Schwiebert et al. 1995). Hexokinase can be used to remove this ATP source in the presence of glucose, thus preventing P2 receptor activation (Schwiebert et al. 1995). In addition, I directly inhibited P2 receptors using suramin, an agent that binds to and inactivates this receptor type (Dezaki et al. 2000). If P2 receptors play a role in Ca2+ entry following hypotonic shock, then these agents should
have an attenuating effect on RVD. I also attempted to potentiate volume recovery by adding ATP to the extracellular medium. I predicted that if P2 receptors are indeed involved in volume regulation, then this addition should have the opposite effect of hexokinase and suramin, and thus stimulate a decrease in cell volume.
After studying the processes by which Ca2+ entered cells, I wanted to address my hypothesis that Ca2+
functions as an intracellular messenger to activate an event necessary for volume recovery. I accomplished this by first determining whether K+ efflux is required for a decrease in cell volume, and whether this efflux is Ca2+
-dependent, as K+
loss from swollen cells is a necessary step in RVD of virtually all cell types that have been studied (Adorante & Cala 1995, Bergeron et al. 1996, Hoffman et al. 1986, Rothstein & Mack 1992). To do so, I observed the effects of enhancing K+
efflux with gramicidin. This agent increases plasma membrane permeability to K+
by forming pores in the cell membrane specific for monovalent cations, thereby allowing for the movement of cations either in or out of the cell as dictated by their electrochemical gradients (Light et al. 1998). In my studies, I was able to make these pores essentially K+ specific by removing Na+ from the extracellular environment and replacing it with choline (a large, impermeant cation that does not readily traverse the plasma membrane, nor alter RVD). In doing so, I could assess whether RVD is dependent on K+
efflux, and whether K+ efflux, in turn, is dependent on Ca2+. If this is indeed the case, then bypassing the Ca2+-dependent step (with gramicidin) should reverse the inhibitory effects of placing cells in a hypotonic, Ca2+
-free solution.
Then, I sought to establish whether Ca2+ acts as a direct modulator of K+ efflux or, alternatively, if it plays an indirect role by acting as a second messenger. To this end, I inhibited Ca2+
-activated K+
channels using quinine, a selective blocker of this channel type (Hoffman et al. 1986), expecting to observe a reduction in RVD upon doing so if K+ loss from cells occurred by this route. I also examined the potential role Ca2+ might play as an intracellular messenger by targeting different Ca2+
-activated signal transduction pathways that could ultimately lead to K+ efflux. One pathway I thought could be involved was calmodulin, which plays a role in the RVD signaling cascade of the astrocytes studied by both Quesada et al. (1999) and Bender et al. (1992), Necturus erythrocytes studied by Bergeron et al. (1996), and the human erythroleukemia cells studied by Huang et al. (2001). In these cells, inhibition of calmodulin resulted in a reduced ability of cells to regulate their volume while under hypotonic challenge. I assessed a potential role for calmodulin in volume recovery using pimozide, an antagonist of calmodulin activity (Bergeron et al. 1996, Hoffman et al. 1986, Huang et al. 2001). Hypothetically, if calmodulin-dependent signaling occurs downstream of Ca2+
and is required to stimulate volume decrease, then inhibiting calmodulin should correlate with a reduced RVD response.
In addition, I targeted the enzyme
Agent Function Predicted Effect on RVD
EGTA Extracellular calcium chelator Inhibition if Ca2+ is necessary for volume recovery
A23187 Calcium ionophore Enhancement if Ca2+
influx stimulates RVD
Gadolinium Stretch-activated channel blocker Inhibition if Ca2+ influx occurs through a SA channel
Lanthanum Stretch-activated channel blocker Inhibition if Ca2+ entry occurs through a SA channel
Hexokinase ATP scavenger Inhibition if Ca2+
entry occurs through a P2 receptor
Suramin P2 receptor antagonist Inhibition if Ca
2+
entry occurs through a P2 receptor
ATP Natural ligand for P2 receptors Enhancement if P2 receptor activity facilitates RVD
Gramicidin Ionophore for monovalent cations Enhancement of K+ efflux is required for volume recovery
Quinine Ca2+-activated K+ channel blocker Inhibition if K+ efflux occurs via a Ca2+-activated K+ channel
Pimozide Calmodulin antagonist Inhibition if RVD requires calmodulin activation
ONO-RS-082 Phospholipase A2 inhibitor Inhibition if volume recovery is PLA2-dependent
2,3 DBAP Phospholipase A2 inhibitor Inhibition if volume recovery is PLA2-dependent
ETYA Antagonist of eicosanoid synthesis Inhibition if an eicosanoid stimulates RVD
NDGA Antagonist of leukotriene production Inhibition if a leukotriene is needed for volume decrease
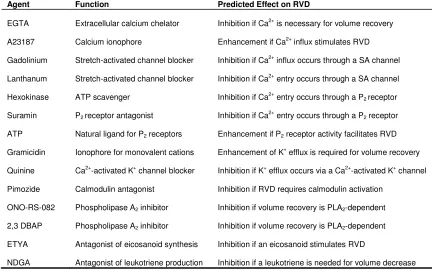
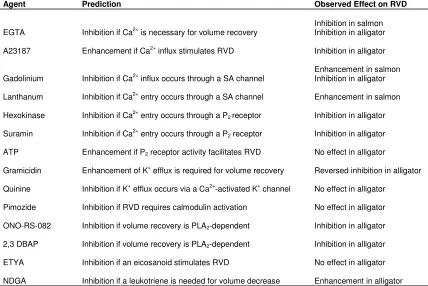
Table 1. Pharmacological agents used in cell volume studies, their functions, and my predictions as to their effects on regulatory volume decrease.
are involved in RVD of the cells I studied was to identify whether RVD is PLA2 dependent, because PLA2 (a Ca2+
activated enzyme) is responsible for arachidonic acid formation (Pasantes-Morales et al. 2000). I used
the PLA2 antagonists ONO-RS-082 and
2,4-dibromoacetophenone to do this, as these agents have been shown to be useful PLA2 inhibitorsin other RVD studies (Balsinde et al. 1999, Nakashima et al. 1989). If arachidonic acid or its metabolites are essential for volume recovery following hypotonic shock, then I expected to observe an inhibited volume recovery in response to preventing arachidonic acid formation.
If my PLA2 inhibition studies implicated arachidonic acid formation as a necessary event in the RVD response, my next step would be to determine whether arachidonic acid itself modulates volume recovery, or, alternatively, if one of its metabolites (known as eicosanoids) does. To distinguish between these two possibilities, I treated cells with the general eicosanoid antagonist 5,8,11,14-eicosatetraynoic acid (ETYA). Additionally, I targeted the lipoxygenase pathway of arachidonic acid metabolism using nordihydroguaiaretic acid (NDGA), as this pathway has been shown to be activated during RVD of several cell types (Lambert et al. 1987, Light et al. 1997). I predicted that if arachidonic acid, but not an eicosanoid, is required for RVD, then inhibiting eicosanoid formation should not affect the volume recovery response. However, if an eicosanoid is involved in volume regulation, then antagonizing the pathways responsible for forming the metabolite should inhibit the ability of cells to recover from cell swelling.
Table 1 summarizes the experimental approach I used to test my hypotheses. Listed are the various pharmacological agents I used and their modes
of action. Additionally, my predictions as to the effects of these agents are also given.
Animals
A common pool (3-4 fish) of salmon blood was purchased from Bioreclamation (Hicksville, NY). Alligator whole blood was purchased from Carolina Biological Supply (Burlington, NC). The blood was stored at 4oC for no longer than one month and was inverted daily. Visualization of salmon erythrocytes (Figure 2) was achieved using a Nikon phase contrast
microscope (Fryer Co. Scientific Instruments,
Carpentersville, IL) along with a mounted camera (Spot Insight Color and Spot software). For visualizing alligator erythrocytes (Figure 2), a Nikon Eclipse TE2000-U DIC microscope (Fryer Co. Scientific Instruments, Carpentersville, IL) was used.
Cell Volume
A Z2™ COULTER COUNTER® with Channelyzer was used to electronically size and count red blood cells (Figure 3, Coulter Electronics, Fullerton, CA). The aperture orifice was 100
µ
m in diameter, and the metered volume was 0.5 ml. The Coulter counter was calibrated using latex beads of known size. Median cell volumes (fl) were obtained from distribution curves between 50 fl and 1200 fl. The lower limit (50 fl) was chosen to prevent the counting of thrombocytes, which are smaller than red blood cells and comprise a significant portion of total blood volume (Histology ofBlood, Creighton University Health Sciences
Figure 2. Salmon and alligatorerythrocytes.
(A)Salmon erythrocytes photographed at 400X. The cells are approximately 15
µ
m long and 11µ
m wide (Nash & Egginton 1993); as a comparison, this is about twice the size of human red blood cells. They are oval in shape, free-floating, and, unlike mammalian red cells, they are nucleated. (B) Alligator erythrocytes photographed at 1000X (taken by Spivak, Pore, & Silverman, Light Lab). These oval-shaped cells measure approximately 21µ
m in length and 11µ
m in width (Hartman & Lessler 1964). They are free-floating and nucleated.same size as red blood cells, the proportion of white
cell to red cell is typically 1/1000
(www.hsl.creighton.edu); therefore, their contribution was assumed to be insignificant. Readings were taken from cell suspensions containing between 20,000-40,000 cells over a time course of 90 min. Specifically, median cell volumes were recorded at 30 sec intervals from 0 to 3 min, at 5 min, and at 10 min intervals from 10 to 90 min.
Using the volume measurements obtained from electronic sizing, two different assessments were made. First, the final relative volume of experimental cells was compared to control cells, with relative volume being the absolute cell volume divided by the volume of untreated cells equilibrated in isosmotic solution. This was done to determine differences in the overall degree by which cells reduced in size following hypotonic challenge. Additionally, the rate of volume recovery was used to compare the RVD responses of experimental and control cells. This was done by comparing the relative volume of experimental and control cells at both 40 and 90 min to the maximum relative volume of control cells. To do so, the following formulas were used (Light et al. 1999): percent volume
recovery at time x is equal to
[
(Vmax – Vx)/(Vmax – V0)]
x 100%. In this equation, Vmax represents maximum relative control cell volume, Vx represents the relative cell volume measured at time x, and V0 represents relative cell volume at time 0 min. Overall percentvolume decrease was determined as
[
(percentrecoveryexperimental)/percent recoverycontrol)
]
x 100%.Figure 3. Z2™ COULTER COUNTER®and aperture. The Coulter counter electronically sizes and counts cells based on a change in resistance that occurs as the cells pass through a narrow aperture opening. Cell volume is proportional to this change in resistance (figure is courtesy of Beckman Coulter, Inc., www.beckmancoulter.com).
Solutions and Reagents
Isosmotic and hypotonic Ringer solutions were used to mimic blood plasma environments. The compositions of the Ringers used in this study were based on those provided by the Marine Biology Laboratory in Woods Hole, MA (www.mbl.edu). The osmolality and pH of all solutions were determined using a Vapor Pressure Osmometer (Wescor 5500) and an Accumet Basic AB15 pH meter (Fisher Scientific), respectively.
For salmon, isosmotic high Na+
Ringer contained (in mM) 178 NaCl, 2.5 KCl, 2.0 CaCl2, 1.8 MgCl2, 8.75 Hepes hemisodium salt, 1.25 Hepes, 5.5 Glucose, and 1.0 NaHCO3. Hypotonic high Na
+ Ringer had the same composition, except the NaCl content was reduced to 67 mM. Hypotonic low Ca2+ (10 nM free Ca2+
) contained (in mM) 67 NaCl, 2.5 KCl, 0.5 CaCl2, 4 EGTA, 1.5 MgCl2, 10 Hepes, 8 Trizma base,
5.5 Glucose, and 1.0 NaHCO3. The MAXC downloads
website
(http://www.stanford.edu/%7ECpatton/downloads.htm) was used to calculate the appropriate free Ca2+ concentration.
For alligator, isosmotic high Na+ Ringer contained (in mM) 140 NaCl, 6 KCl, 6 CaCl2, 1.5 MgCl2, 5.45 Hepes hemisodium salt, 4.55 Hepes, 5.5 Glucose, and 1.0 NaHCO3. For the hypotonic high Na+ Ringer, NaCl content was reduced to 70 mM, and for the NaCl-free hypotonic Ringer, NaCl was replaced with 70 mM choline chloride. Hypotonic low Ca2+ (10 nM) Ringer contained (in mM) 62.5 NaCl, 6 KCl, 0.5 CaCl2, 1.5 MgCl2, 3.8 EGTA, 5.45 Hepes hemisodium salt, 4.55 Hepes, 9.16 Trizma base, 5.5 Glucose, and 1.0 NaHCO3.
All chemicals and pharmacological agents were acquired from Sigma Chemical Co. (St. Louis, MO), Axxora LLC (San Diego, CA), and ICN Biomedicals (Aurora, OH). Aqueous stock solutions were made at 100X their final concentration and were then diluted 100X when used to achieve the final working concentration desired. Nonaqueous stock solutions (using methanol, ethanol, or DMSO as vehicles) were made at 1000X their final concentration and diluted 1000X to their final working concentration (Light et al. 2001). All experiments were carried out at room temperature (21-23o
C).
Statistics
Cell volume changes were graphically represented using KaleidaGraph 4.0 (Synergy Software; Reading,
A
PA) and Microsoft Excel (Microsoft Corporation; Redmond, WA). The statistical significance of the experimental results (i.e., differences in final cell volume and percent volume decrease of control cells compared to experimental cells) was assessed by performing either paired t-tests or analysis of variance (ANOVA) and multivariate analysis of variance (MANOVA). Statistics were computed using Data Desk Software (Ithaca, NY).
Each experiment was replicated at least five times. Each maneuver was compared to its own control, allowing for paired comparisons. A separate blood sample was used for each replicate experiment. All samples were taken from several common pools.
Results
Salmon
Challenging salmon cells with a hypotonic (~0.5x) extracellular environment caused them to swell rapidly. Following this initial increase in volume, the cells gradually and spontaneously recovered toward their normal size over a 90 minute time course (Figure 4A). I then bathed cells in a low Ca2+
medium to test whether RVD requires extracellular Ca2+. There was a significant difference in final cell volume of cells bathed in the low Ca2+ hypotonic Ringer (buffered to 10 nM with EGTA) compared to that of control cells (Figure 4A, n=5, P<0.001 at 90 min). Additionally, in the low Ca2+ environment, percent volume recovery was inhibited both at 40 min and at 90 min (Figure 4B, n=5, P<0.001).
The next series of experiments were designed to inhibit Ca2+
influx. Surprisingly, cells treated with lanthanum (10
µ
M, n=5), an inorganic inhibitor of Ca2+channels (Rothstein & Mack 1992), displayed an enhanced volume recovery (Figure 5A, P<0.001 at 90 min compared to control). The percent volume recovery was dramatically potentiated at both 40 min and 90 min (Figure 5B, P<0.001 for both 40 and 90 min), and the total percent volume decrease of lanthanum-treated cells compared to control cells was 188%.
Alligator
Alligator erythrocytes swelled rapidly in response to hypotonic challenge (Figure 7A). The initial swelling was followed by a subtle volume recovery. However, in a hypotonic, low-Ca2+ extracellular medium, volume decrease was completely inhibited (Figure 7A, n=7, P<0.001 at 90 min compared to control cells). Specifically, in the absence of extracellular Ca2+
, percent volume recovery was abolished (Figure 7B, n=7, P<0.01 at 40 and 90 min). Upon examining whether the cationophore gramicidin would influence RVD by enhancing K+
efflux, I found that addition of this agent (0.5
µ
M added at peak cell volume, n=5) to a low Ca2+ choline Ringer reversed EGTA-mediated RVD inhibition. In fact, despite the lack of an extracellular Ca2+source, in the presence of gramicidin, final cell volume recovery exceeded that of control cells (Figure 7A, n=5, P<0.05 at 90 min), as did percent volume recovery at 90 min (Figure 7B, n=5, P<0.05). This I attempted to address my hypothesis that facilitating Ca2+
influx should potentiate volume
recovery by increasing intracellular Ca2+ concentration using the Ca2+ ionophore A23187 (0.5
µ
M, n=6). Unexpectedly, the ionophore had a pronounced inhibitory effect on the ability of alligatorred blood cells to regulate their volume following hypotonic shock (Figure 8A, P<0.001 at 90 min compared to control cells). Not only did A23187-treated cells fail to recover their volume, but they continued to swell throughout the 90 min time course (Figure 8B, P<0.001 at 40 min and P<0.001 at 90 min).To examine the mechanism for Ca2+ influx into alligator cells, I used gadolinium (50
µ
M, n=7). Unlike in salmon (Figure 6), this agent had a distinct inhibitory effect on cell volume recovery (Figure 9A, P<0.01 at 90 min compared to control cells). That is, unlike control cells, percent volume recovery of gadolinium-treated cells was completely inhibited (Figure 9B, P<0.001 at 40 min and P<0.01 at 90 min).After observing an inhibitory effect following gadolinium treatment, I wanted to pinpoint the gadolinium-sensitive transport pathway involved in Ca2+ influx in response to cell swelling. To this end, I examined whether P2X receptors were involved in the alligator RVD process. To accomplish this, I utilized the ATP scavenger hexokinase (2.5 units/mL H2O, n=6), as extracellular ATP is known to enhance RVD by stimulating P2 receptors (Dezaki et al. 2000, Light et al. 2001, Schwiebert et al. 1995). Consistent with my prediction, this agent had a significant inhibitory effect on cell volume recovery, as hexokinase-treated cells were more swollen than control cells at 90 min (Figure 10A, P<0.01). Furthermore, upon hexokinase addition, percent volume recovery was reduced (Figure 10B, P<0.01 at 40 min and P<0.001 at 90 min).
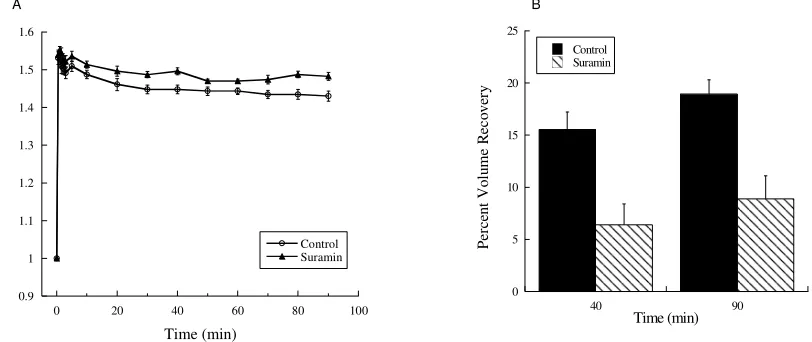
To further verify a role for P2 receptors, I treated cells with suramin (100
µ
M, n=5), which directly inhibits this receptor type (Dezaki et al. 2000, Light et al. 2001). Cells bathed in a hypotonic solution containing this agent showed a decreased ability to regulate their volume compared to control cells (Figure 11A, p<0.05 at 90 min). Furthermore, percent volume recovery of experimental cells was also limited in comparison to control cell percent volume recovery (Figure 11B, P<0.01 at both 40 and 90 min).After successfully inhibiting the RVD
response of alligator cells using antagonists of P2 receptor activation, I attempted to potentiate volume recovery using an agonist of this receptor type. I provided cells with an exogenous source of ATP (100
µ
M, n=6), as this has been shown to stimulate P2 receptor-dependent RVD responses (Dezaki et al. 2000, Schwiebert et al. 1995). Although I predicted this would enhance RVD, the degree by which cells were able to regulate their volume was unaffected by increasing their exogenous ATP source. Specifically, volume recovery of ATP-treated cells matched that of control cells (Figure 12A), as did the percent volume recovery at both 40 and 90 min (Figure 12B).Figure 4. Cells failed to regulate their volume in the absence of extracellular Ca2+.
(A) At time 0, cells were exposed to hypotonic shock, which resulted in a rapid rise in cell volume. Following this initial swelling, control cells recovered toward their normal size over a 90 min time course. In contrast, cells in a low Ca2+ medium remained swollen (n=5, P<0.001 at 90 min compared to control). (B) Percent volume decrease was significantly inhibited in the absence of extracellular Ca2+, both at 40 min (n=5, P<0.001 compared to control at 40 min) and at 90 min (n=5, P<0.001 compared to control at 90 min). Cells swelled in both instances, as indicated by the negative percent volume recoveries of -5% (40 min) and -8% (90 min) compared to the control cells’ percent volume recoveries of 31% (40 min) and 50% (90 min). Values represent mean + standard error.
Figure 5. Lanthanum treatment potentiated cell volume recovery.
(A) At time 0, cells were exposed to hypotonic shock. Lanthanum-treated cells expressed a substantially enhanced cell volume recovery compared to control cells, both in terms of rate and final cell volume (n=5, P<0.001 at 90 min). (B) Control cells decreased in volume by 30% and 49% at 40 min and 90 min, respectively. However, cells treated with lanthanum had remarkably recovered by 87% and 92% at 40 min and 90 min, respectively (n=5, P<0.001 for both 40 and 90 minutes). Values represent mean + standard error.
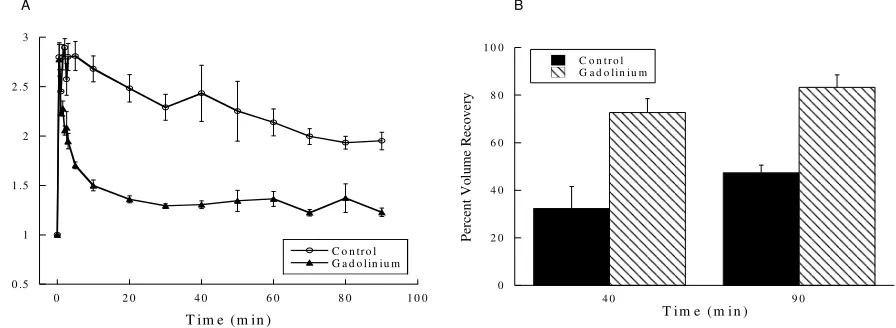
Figure 6. Treating cells with gadolinium enhanced cell volume recovery after exposure to a hypotonic medium.
(A) Gadolinium-treated cells had more successfully regulated their volume after 90 minutes when compared to control cells (n=5, P<0.05 at 90 min). (B) The rate of volume recovery of gadolinium-treated cells was elevated to 73% at 40 min and 83% at 90 min compared to control values of 32% at 40 min and 47% at 90 min (n=5, P<0.001 at both 40 and 90 min). Values represent mean + standard error.
0 . 5 1 1 . 5 2 2 . 5 3
0 2 0 4 0 6 0 8 0 1 0 0 C o n t r o l E G T A
R
el
at
iv
e
V
o
lu
m
e
T i m e ( m i n )
- 1 0 0 1 0 2 0 3 0 4 0 5 0
4 0 9 0
C o n t r o l E G T A
P
er
ce
n
t
V
o
lu
m
e
R
ec
o
v
er
y
T im e ( m in )
A B
0 . 5 1 1 . 5 2 2 . 5 3
0 2 0 4 0 6 0 8 0 1 0 0 C o n t r o l L a n t h a n u m
R
el
at
iv
e
V
o
lu
m
e
T i m e ( m i n )
A B
0 20 40 60 80 100
40 90
Control Lanthanum
P
er
ce
n
t
V
o
lu
m
e
R
ec
o
v
er
y
Time (min)
0 .5 1 1 .5 2 2 .5 3
0 2 0 4 0 6 0 8 0 1 0 0 C o n tr o l G a d o l in iu m
R
el
at
iv
e
V
o
lu
m
e
T im e (m in )
0 2 0 4 0 6 0 8 0 1 0 0
4 0 9 0
C o n t r o l G a d o l i n i u m
Pe
rc
en
t
V
o
lu
m
e
R
ec
o
v
e
ry
T i m e ( m i n )
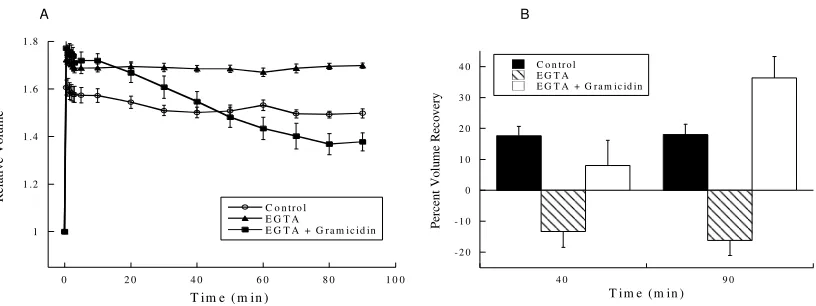
Figure 7. Removing extracellular Ca2+ inhibited volume recovery, and gramicidin reversed this inhibition.
(A) At time 0, cells were challenged with a hypotonic medium. RVD was inhibited by the removal of Ca2+ from the extracellular medium (n=7, P<0.001 at 90 min compared to control). However, with the addition of gramicidin (added at 30 sec, n=5), volume recovery exceeded that of control cells (P<0.01 at 90 min compared to control), even in the absence of extracellular Ca2+ (B) Percent volume recovery was -13% at 40 min and -16% at 90 min in EGTA-treated cells compared to control cell percent volume recovery of 18% at 40 and 90 min (n=5, P<0.01 at 40 and 90 min). Percent volume recovery of gramicidin-treated cells (n=5) was enhanced to 36% compared to control cell percent volume recovery of 18% at 90 min (P<0.05 at 90 min). Values are mean + standard error.
Figure 8. A23187 inhibited recovery following hypotonic shock in alligator cells.
(A) Control cells gradually recovered from cell swelling, whereas A23187-treated cells continued to increase in volume over the 90 min time course studied (n=6, P<0.001 at 90 min compared to control). (B) Following hypotonic shock, control cells recovered their volume by 13% and 18% at 40 and 90 min, respectively. In contrast, A23187-treated cells displayed a negative percent volume recovery of -42% at 40 min (n=6, P<0.001 compared to control) and -48% at 90 min (n=6, P<0.001 compared to control). Values are mean + standard error.
Figure 9. Gadolinium inhibited regulatory volume decrease of alligator red blood cells.
(A) Unlike control cells, which slowly recovered toward steady state cell volume following hypotonic shock, recovery was abolished in gadolinium-treated cells (n=7, P<0.01 at 90 min compared to control cells). (B)Alligator red cells exposed to gadolinium showed a percent volume recovery of -3% and -9% at 40 and 90 min respectively. This was in comparison to control cell percent volume recovery of 18% at the corresponding times (n=7, P<0.001 at 40 min and P<0.01 at 90 min). Values are means + standard error.
1 1 .2 1 .4 1 .6 1 .8
0 2 0 4 0 6 0 8 0 1 0 0 C o n tr o l
E G T A
E G T A + G r a m ic id in
R
el
at
iv
e
V
o
lu
m
e
T im e ( m in )
- 2 0 - 1 0 0 1 0 2 0 3 0 4 0
4 0 9 0
C o n tr o l E G T A
E G T A + G r a m ic id in
P
er
ce
n
t
V
o
lu
m
e
R
ec
o
v
er
y
T i m e ( m in )
A B
0 . 9 1 1 . 1 1 . 2 1 . 3 1 . 4 1 . 5 1 . 6 1 . 7
0 2 0 4 0 6 0 8 0 1 0 0 C o n t r o l A 2 3 1 8 7
R
el
at
iv
e
V
o
lu
m
e
T i m e ( m i n )
A B
-50 -40 -30 -20 -10 0 10 20
40 90
Control A23187
P
er
ce
n
t
V
o
lu
m
e
R
ec
o
v
er
y
Time (min)
- 1 5 - 1 0 -5 0 5 1 0 1 5 2 0 2 5
4 0 9 0
C o n tr o l G a d o l in i u m
P
er
ce
n
t
V
o
lu
m
e
R
ec
o
v
er
y
T im e ( m in )
0 .9 1 1 .1 1 .2 1 .3 1 .4 1 .5 1 .6
0 2 0 4 0 6 0 8 0 1 0 0 C o n tr o l G a d o l in i u m
R
el
at
iv
e
V
o
lu
m
e
T im e ( m in )
Figure 10. Cell volume recovery was attenuated in the presence of hexokinase.
(A) Hexokinase-treated cells remained more swollen throughout the 90 min time course than control cells (n=6, P<0.01 at 90 min compared to control). (B) Percent volume recovery of hexokinase-treated cells was limited to 2% at both 40 and 90 min. This was in contrast to control cells, which showed a percent volume recovery of 13% and 15% at 40 and 90 min, respectively (n=6, P<0.01 at 40 min and P<0.001 at 90 min compared to control). Values are mean + standard error.
Figure 11. Suramin reduced alligator cell volume recovery.
(A) Addition of suramin to the extracellular medium limited the ability of cells to reduce in volume over the 90 min time course (n=5, P<0.05 at 90 min compared to control). (B) In the presence of suramin, percent volume recovery was reduced to 6% at 40 min and 9% at 90 min, in comparison to control cell percent volume recovery of 16% and 19% at the corresponding times (n=6, P<0.01 at 40 min and 90 min). Values are mean + standard error.
Figure 12. Addition of ATP to the extracellular medium had no effect on regulatory volume decrease.
(A) Cells bathed in a hypotonic medium containing ATP showed a volume recovery response that paralleled the response of control cells (n=6). (B) Percent volume recovery of ATP-treated cells was equivalent to control cell percent volume recovery at both 40 and 90 min (n=6). Values are mean + standard error.
A B
0.9 1 1.1 1.2 1.3 1.4 1.5 1.6
0 20 40 60 80 100
Control Suramin
R
el
a
ti
v
e
V
o
lu
m
e
Time (min)
0 5 10 15 20 25
40 90
Control Suramin
P
er
ce
n
t
V
o
lu
m
e
R
ec
o
v
er
y
Time (min)
A B
0.9 1 1.1 1.2 1.3 1.4 1.5 1.6
0 20 40 60 80 100
Control ATP
R
el
at
iv
e
V
o
lu
m
e
Time (min)
0 5 10 15 20
40 90
Control ATP
P
er
ce
n
t
V
o
lu
m
e
R
ec
o
v
er
y
Time (min)
A B
0.9 1 1.1 1.2 1.3 1.4 1.5
0 20 40 60 80 100
Control Hexokinase
R
el
at
iv
e
V
o
lu
m
e
Time (min)
0 5 10 15 20
40 90
Control Hexokinase
P
er
ce
n
t
V
o
lu
m
e
R
ec
o
v
er
y
Figure 13. Quinine failed to inhibit volume recovery of alligator cells.
(A) After exposure to hypotonic shock, there was no significant difference in the overall volume recovery of quinine-treated cells when compared to control cells (n=5). (B) Quinine-treated cells and control cells displayed similar percent volume recoveries, both at 40 and 90 min (n=5). Values are means + standard error.
Figure 14. Pimozide-treated cells and control cells responded similarly to hypotonic challenge. (A) There was no significant difference between control cell volume recovery and cell volume recovery of pimozide-treated cells (n=5). (B) There was no difference between the percent volume recovery of control and pimozide-treated cells at either 40 min or 90 min (n=5). Values are means + standard error.
Figure 15. ONO-RS-082 abolished the RVD response of alligator cells.
(A) Control cells gradually recovered toward resting cell volume following hypotonic shock, but cells treated with ONO showed no volume recovery response and instead continued to swell over the 90 min time course (n=5, P<0.001 at 90 min compared to control cells). (B) Upon ONO treatment, a reduction in alligator cell percent volume recovery to -2% and -8% was observed at 40 and 90 min, respectively. This was in contrast to control cell percent volume recovery of 16% and 17% at the corresponding times (n=5, P<0.01 at 40 min and P<0.001 at 90 min). Values are mean + standard error.
A B
0 .9 1 1 .1 1 .2 1 .3 1 .4 1 .5
0 2 0 4 0 6 0 80 1 0 0 C o n tro l P im oz id e
R
el
at
iv
e
V
o
lu
m
e
T im e (m in )
0 5 10 15 20 25
4 0 9 0
C o n tro l P im o z id e
P
er
ce
n
t
V
o
lu
m
e
R
ec
o
v
er
y
T im e (m in )
A B
0 .9 1 1 .1 1 .2 1 .3 1 .4 1 .5 1 .6
0 2 0 4 0 6 0 8 0 1 0 0
C o n tro l
O N O
R
el
at
iv
e
V
o
lu
m
e
T im e (m in )
-1 5 -1 0 -5 0 5 1 0 1 5 2 0 2 5
4 0 9 0
C o n tro l O N O
Pe
rc
en
t
V
o
lu
m
e
R
ec
o
v
e
ry
T im e (m in )
A B
0.9 1 1.1 1.2 1.3 1.4 1.5
0 2 0 4 0 6 0 80 1 0 0 C o n tro l Q u in in e
R
el
at
iv
e
V
o
lu
m
e
T im e (m in)
0 5 10 15 20 25
4 0 9 0
C o ntrol Q u in ine
P
er
ce
n
t
V
o
lu
m
e
R
ec
o
v
er
y
Figure 16. DHAP attenuated percent volume recovery of alligator cells. (A) There was no significant difference in the final volume of control cells and DHAP-treated cells. (B) Addition of DHAP reduced percent volume recovery to 11% and 12% at 40 and 90 min, respectively. This was in contrast to control cells, which recovered by 16% and 19% at the corresponding times (n=6, P<0.05 at 40 min and 90 min). Values are mean + standard error.
Figure 17. ETYA had no effect on cell volume recovery. (A) There was no difference in the volume of ETYA-treated cells and control cells at 90 min (n=6). (B) The percent volume recovery of ETYA-treated cell matched that of control cells (n=6). Values are mean + standard error.
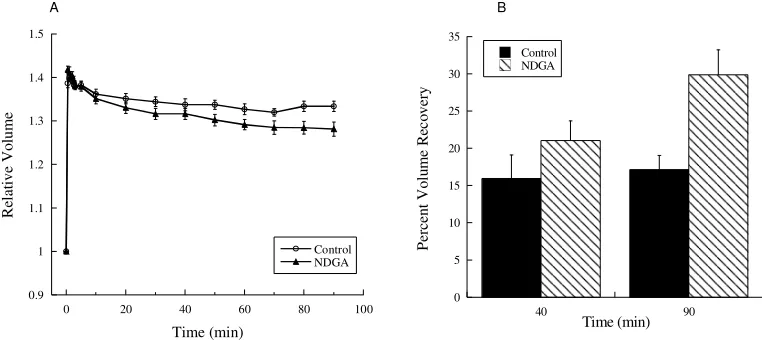
Figure 18. NDGA-treated cells displayed a potentiated volume recovery response following hypotonic challenge.
(A) Cells exposed to NDGA were slightly more successful in regulating their volume than control cells, as reflected in their smaller final volume (n=6, P<0.05 at 90 min compared to control cells). (B) The percent volume recovery of control cells and NDGA-treated cells was similar at 40 min (approximately 16%). However, the percent volume recovery of 30% experienced by NDGA-treated cells at 90 min surpassed the 17% volume recovery of control cells at this time (n=6, P<0.01). Values represent mean + standard error.
0.9 1 1.1 1.2 1.3 1.4 1.5 1.6
0 20 40 60 80 100
Control DBAP
R
el
at
iv
e
V
o
lu
m
e
Time (min)
0 5 10 15 20 25
40 90
Control DBAP
P
er
ce
n
t
V
o
lu
m
e
R
ec
o
v
er
y
Time (min)
A B
0.9 1 1.1 1.2 1.3 1.4 1.5
0 20 40 60 80 100
Control ETYA
R
el
at
iv
e
V
o
lu
m
e
Time (min)
0 5 10 15 20 25
40 90
Control ETYA
P
er
ce
n
t
V
o
lu
m
e
R
ec
o
v
er
y
Time (min)
A B
A B
0.9 1 1.1 1.2 1.3 1.4 1.5
0 20 40 60 80 100
Control NDGA
R
el
at
iv
e
V
o
lu
m
e
Time (min)
0 5 10 15 20 25 30 35
40 90
Control NDGA
P
er
ce
n
t
V
o
lu
m
e
R
ec
o
v
er
y