Employment status and other predictors of mental health
and cognitive functions in older Croatian workers
Adrijana Košćec Bjelajac
1, Jasminka Bobić
1, Jelena Kovačić
1, Veda Marija Varnai
1, Jelena Macan
1,
and Šime Smolić
21 Institute for Medical Research and Occupational Health, Zagreb, Croatia
2 Faculty of Economics and Business, University of Zagreb, Croatia
[Received in January 2019; Similarity Check in January 2019; Accepted in June 2019]
The aim of this study was to examine mental health and cognitive functions in older Croatian workers (50–65 years) taking into account their employment status, self-assessed health, and a set of demographic characteristics. We analysed the data collected on 650 older workers (71 % employed) in the Wave 6 of the Survey of Health, Ageing and Retirement in Europe (SHARE). Unemployed workers reported symptoms of loneliness more often than the employed, while in rural areas unemployment was additionally associated with more pronounced symptoms of depression. Feeling of loneliness
was also higher in those living without a partner in the household and in those with poorer health. In urban residents
symptoms of depression were more severe in women, respondents with higher education, those living without a partner,
and those who rated their health as poorer. As for cognitive functions, unemployment significantly predicted poorer subtraction in the rural subsample. Women in general showed less efficient numerical abilities. In the urban subsample poorer numerical abilities were also associated with lower education and living without a partner in the household. Better verbal recall was predicted by higher education and better self-rated memory. Higher scores in verbal fluency were predicted by urban residency and better self-rated health. Our results indicate that the protective factors for good mental health and cognitive functioning in older Croatian workers are being employed, having more education, living with a partner in the household, and being healthier. These findings stress the importance of implementing broader social policy
strategies covering employment, education, and health.
KEY WORDS: aging; depression symptoms; loneliness; self-rated health; unemployment
Modern society is confronted with various challenges due to population ageing. Although there is a common trend
to develop policies to keep workers in the labour market
longer, restructuring and optimisation processes are still mostly focused on excluding older workers from the
workforce. Between 2002 and 2015, the employment rate
of the oldest group of workers (55–64 years) in the European
Union had continuously been the lowest of all age groups
(1).
Beside financial issues, unemployment can lead to a
deterioration of physical and/or mental health, especially if it is long-term (2, 6), and older workers are at a greater
risk of long-term unemployment not only because of limited jobs availability but also because of age discrimination by
employers (3, 4).
It is usually assumed that younger and older persons show less severe unemployment consequences than
middle-aged persons, who are at greater family and financial pressure. However, the opposite has been evidenced by a
meta-analysis (5) of over 300 cross-sectional and longitudinal studies, as it showed that the young and
Corresponding author: Adrijana Bjelajac, PhD, Institute for Medical Research and Occupational Health, Ksaverska cesta 2, HR-10000 Zagreb, Croatia, E-mail: [email protected]
50-year-olds and over had significantly more symptoms of
distress, depression, anxiety, and psychosomatic symptoms,
and rated their well-being and self-esteem lower than other
age groups. Moreover, it showed that unemployment not
only correlated with distress but actually caused it. Bi-directional association between unemployment and
impaired physical, mental and/or cognitive health is well recognised (6–17). However, the strength of this relationship, as well as macro-economic, personal socio-economic, and life-style factors mediating and modifying this relationship,
are, at least to certain degree, country- and time-specific
(18–21).
To the best of our knowledge, studies in Croatia are
mainly focused on unemployment issues of workers under
55 years of age, whereas the age group between 50 and 65 years has not yet been investigated. Therefore, the aim of our study was to fill that gap by examining specific aspects
of mental health and cognitive functions, i. e. feeling of
loneliness, depression symptoms, numeracy, verbal fluency, and verbal recall in this population. Furthermore, we wanted
to explore the value of employment status, age, gender,
cohabitation, place of residence, and self-rated health as
The Survey of Health, Ageing and Retirement in Europe (SHARE) is a multidisciplinary and cross-national panel
database of micro data on health, socio-economic status,
and social and family networks of more than 120,000 individuals aged 50 or older (more than 380,000 interviews) covering 27 European countries and Israel. During the SHARE Wave 6 in 2014–2015, more than 68,000 face-to-face interviews were collected in 18 countries (22). SHARE
is based on its sister Health and Retirement Study (HRS)
conducted in the United States (https://hrs.isr.umich.edu) and the English Longitudinal Study of Ageing (ELSA) conducted in England (https://www.elsa-project.ac.uk).
More details about SHARE Wave 6, such as the
questionnaire, sampling design, and weighting procedures
are available in Malter and Supan (23) and Börsch-Supan et al. (24). In addition, compliance profiles for each country are available in Malter et al. (25). The SHARE study has been approved by the University of Mannheim on several occasions (until 2011) and by the Ethics Council of the Max Planck Society (from 2011 on), and was
conducted in accordance with the Declaration of Helsinki. Croatia joined SHARE in Wave 6, while the preparations for joining SHARE started as early as 2012 with the project The Economics of Ageing in Croatia (26). Data for Croatia
were collected between June and November 2015 through interviews with 2,494 persons aged 50 years and over (born
in 1964 or older) and their partners irrespective of their age (43.9 % male, and 56.1 % female respondents) (22) with
regular residence in Croatia. Persons were excluded from
the study if they were incarcerated, hospitalised, or out of
the country over the entire survey period (June to November 2015), unable to speak the language, or had moved to an
unknown address. With the response rate of nearly 42 %, Croatia met the minimum individual response rate
requirement in the baseline sample.
SHARE data collection is based on computer-assisted personal interviewing (CAPI). The interviewers conduct face-to-face interviews using a laptop on which the CAPI
instrument is installed. SHARE applies a concept of ex-ante harmonisation: there is one common generic questionnaire that is translated into national languages.
Of all respondents aged 50–65 years in the Croatian
sample (N=1,398), this study included 650 respondents who were either employed (N=460, including self-employed) or unemployed (N=190) at the time of the interview. Other respondents aged 50–65 years (N=748) were retired (N=569), homemakers (N=126), with unknown employment status (N=29), or permanently sick or disabled (N=24) and
were excluded from the analysis.
Variables
General characteristics of respondents included age,
gender, education, place of residence, and cohabitation. Age
SHARE release guide 6.0.0. p. 23 (22). Gender was not
self-reported but assigned by the interviewer (male/female). Applying the 1997 International Standard Classification of Education (ISCED), education was classified as low
(levels 0–2), middle (levels 3–4), or high (5–6) (27).
Place of residence was established from participants’ or interviewers’ responses, as follows: 1 – “Big city”, 2 – “Suburbs or outskirts of a big city”, 3 – “Large town”, 4 – “Small town”, and 5 – “Rural areas”. Responses from 1 to 4 were categorised as “Urban residence” and the response number 5 as “Rural residence”.
Cohabitation information was provided by the SHARE team. This variable had two categories: “Living with a partner in the same household” and “Living without a partner in the same household”.
Current employment status was taken from participant
responses to one of the following options: 1 – “Retired”, 2 – “Employed or self-employed”, 3 – “Unemployed”, 4 – “Permanently sick or disabled”, 5 – “Homemaker” or “Other”. Participants who opted for number 2 were categorised as employed and those who chose number 3
were categorised as unemployed.
Physical health was described by two self-report measures. The first was self-rated health, estimated on a five-point Likert-type scale ranging from 1 – “Poor” to 5 – “Excellent”. The second measure was a composite dichotomous measure of chronic illness combining
yes-or-no answers to whether the respondents had any long-term
physical and/or mental health problems and whether the
doctor diagnosed them with any of the following chronic health conditions: hypertension, increased cholesterol,
arthritis, diabetes, heart disease, cerebrovascular disease,
peptic ulcer, carcinomas, chronic lung disease, chronic
kidney disease, affective or emotional disorders, Parkinson disease, and Alzheimer’s disease.
Two mental health outcomes were considered: depression symptoms and feeling of loneliness. Depression symptoms were assessed using a EURO-D scale (28). It is a 12-item scale assessing the presence of different symptoms of depression such as feelings of pessimism,
irritability, enjoyment, fatigue, depression, suicidality, guilt, sleep problems, interests, appetite, concentration, and
tearfulness in the previous month. The scores ranged from 0 to 12, with higher scores indicating more symptoms of depression.
For loneliness we used a short form of the Revised – University of California at Los Angeles Loneliness Scale (29) adapted for the SHARE study (30). The scale consisted of three items indirectly measuring loneliness (feeling lack of companionship, feeling left out, feeling isolated), each rated on a three-point Likert-type scale ranging from 1 –
“Often” to 3 – “Never”. A simple linear combination of the
were considered: numeracy, verbal fluency, and verbal
recall. Two types of numeracy were assessed: calculating with percentages (four items with a total score from 1 to 5)
and simple subtraction (five items with a total score from 0 to 5). These two composite variables were suggested and generated by the SHARE team (22).
Verbal fluency represented the number of animals the
respondent succeeded to name over one minute.
Verbal recall was defined as the number of words successfully repeated by the respondent immediately or with a delay after hearing them read out loud by the
interviewer from a ten-word list (immediate and delayed
verbal recall, respectively). The respondents were also asked to self-rate their memory on a five-point Likert-type scale ranging from 1 – “Excellent” to 5 – “Bad”. The
responses were reverse coded for analysis, with higher
scores indicating better self-rated memory.
Statistical analysis
To obtain estimates representative for the whole population, calibrated individual weights were used for descriptive statistics. These weights were calculated based on the sizes of subpopulations belonging to specific age range, gender, and region groups and were provided by the SHARE team (22). For categorical variables, percentages of study population belonging to each category were shown. Numerical variables were described either by means and standard deviations, if their distributions were symmetrical or mildly skewed, or by medians and interquartile ranges
if they were not.
Mental health and cognitive outcomes (loneliness,
depression symptoms, verbal fluency, numeracy, and immediate and delayed verbal recall) were further analysed with regression analysis. Prior to analysis, verbal fluency was transformed by adding a constant and applying natural logarithm to achieve normal distribution of residuals. For
outcomes with low number of categories were dichotomised. Depression was defined as having a score of 4 and more on the EURO-D scale, as this categorisation is proposed by the SHARE team (22) and is widely used in publications based on SHARE data. Other mental health and cognitive
outcomes were dichotomised using the following cut-offs: greater than 4 for loneliness; less than 4 for low numeracy – percentages tasks; less than 5 for low numeracy -
subtraction tasks; less than 6 for immediate verbal recall; less than 4 for delayed verbal recall. These cut-offs were
selected in a way that one third (or as close to this share as
possible) of the study sample was marked as having an undesirable outcome.
For each model interaction between unemployment and
1) gender and 2) place of residence was tested. If the p-value for interaction was less than 0.1, models for each gender or place of residence were further analysed separately.
Although regression models were not weighted, we used
Huber-White corrections for standard errors to account for
clustering at the household level.
All analyses were performed in STATA 14.2 (StataCorp, College Station, TX, USA) and R 3.1.1. (R Foundation for Statistical Computing, Vienna, Austria) (31).
RESULTS AND DISCUSSION
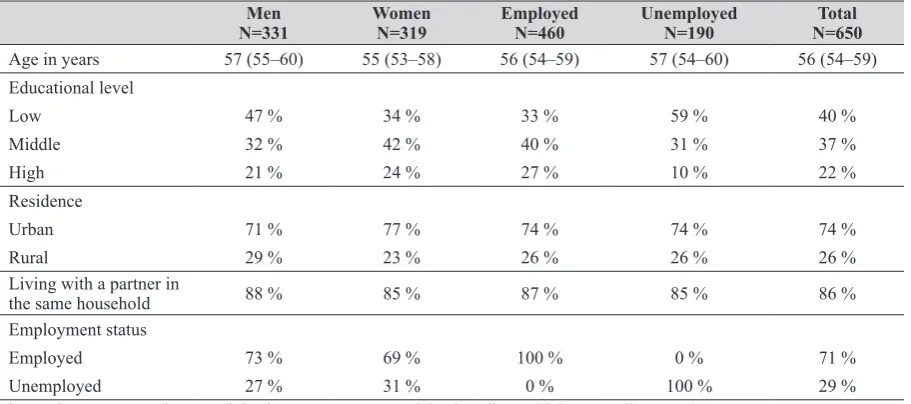
Characteristics of older Croatian workersSociodemographic characteristics of our sample
(N=650) are presented in Table 1. There were no age differences either by gender or employment status in older
Croatian workers. Most of the unemployed workers had low education level (59 %), while most of the employed had middle level of education (40 %). Low education level was more dominant among men than women. There were
no differences in the percentage of urban and rural residents
Table 1 Selected general characteristics in the sample of older Croatian workers (N=650)
Men
N=331 Women N=319 Employed N=460 Unemployed N=190 N=650Total
Age in years 57 (55–60) 55 (53–58) 56 (54–59) 57 (54–60) 56 (54–59)
Educational level
Low 47 % 34 % 33 % 59 % 40 %
Middle 32 % 42 % 40 % 31 % 37 %
High 21 % 24 % 27 % 10 % 22 %
Residence
Urban 71 % 77 % 74 % 74 % 74 %
Rural 29 % 23 % 26 % 26 % 26 %
Living with a partner in
the same household 88 % 85 % 87 % 85 % 86 %
Employment status
Employed 73 % 69 % 100 % 0 % 71 %
Unemployed 27 % 31 % 0 % 100 % 29 %
household regarding their employment status or gender. In our sample, the frequency of unemployment was equally
distributed between men and women (27 % and 31 %,
respectively).
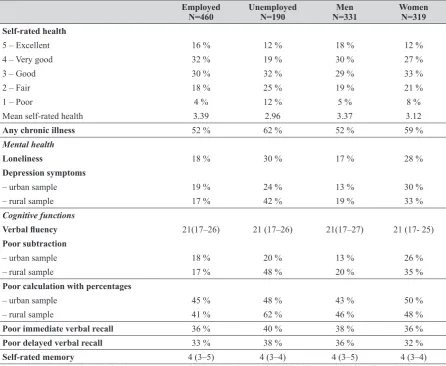
Table 2 shows physical health, mental health, and
cognitive function parameters in our population of older Croatian workers. Forty-eight percent of the employed workers rated their health as excellent or very good in contrast to only 31 % of the unemployed workers who
considered their health to be more than good. Also, more
unemployed than employed respondents reported poor health (12 % vs 4 %, respectively) and the trend was similar
for both men and women. In addition, 62 % of the
unemployed vs 52 % of the employed workers reported
chronic illness. Poorer health in unemployed workers has been reported in some other studies too (2, 15, 21) and raises further concern about the possibility of their re-employment. Even though this group may be in a greater need of preventive healthcare services, Vončina et al. (15) reported
that they use them less often than the employed. It points toward another aspect of negative discrimination this group has to suffer: lack of opportunities for health protection
points toward another risk factor regarding the health of older workers, which is female gender.
Our unemployed respondents reported more symptoms
of impaired mental health than the employed ones (Table
2). This finding is consistent with the findings of a
longitudinal study reported by Šverko et al. (4), who found
that unemployment (long-term in particular) led to the experience of social isolation. In our sample 30 % of the unemployed workers reported symptoms of loneliness (vs. 18 % of the employed). Regarding depression symptoms,
the difference between the employed and unemployed is bigger in the rural subsample (42 % and 17 %, respectively), but the same trend is present in the urban subsample as well.
Women generally reported more symptoms of depression
and loneliness than men, which is a common finding (32). Table 2 also points to significant differences in numerical abilities between the unemployed and employed
workers in rural residences. Unemployed workers showed
poorer results in subtraction task and calculation with percentages. Men in both urban and rural subsample had better results in subtraction tasks than women.
Table 2 Selected physical, mental health, and cognitive variables in older Croatian workers (N=650)
Employed
N=460 Unemployed N=190 N=331Men Women N=319 Self-rated health
5 – Excellent 16 % 12 % 18 % 12 %
4 – Very good 32 % 19 % 30 % 27 %
3 – Good 30 % 32 % 29 % 33 %
2 – Fair 18 % 25 % 19 % 21 %
1 – Poor 4 % 12 % 5 % 8 %
Mean self-rated health 3.39 2.96 3.37 3.12
Any chronic illness 52 % 62 % 52 % 59 %
Mental health
Loneliness 18 % 30 % 17 % 28 %
Depression symptoms
– urban sample 19 % 24 % 13 % 30 %
– rural sample 17 % 42 % 19 % 33 %
Cognitive functions
Verbal fluency 21(17–26) 21 (17–26) 21(17–27) 21 (17- 25)
Poor subtraction
– urban sample 18 % 20 % 13 % 26 %
– rural sample 17 % 48 % 20 % 35 %
Poor calculation with percentages
– urban sample 45 % 48 % 43 % 50 %
– rural sample 41 % 62 % 46 % 48 %
Poor immediate verbal recall 36 % 40 % 38 % 36 %
Poor delayed verbal recall 33 % 38 % 36 % 32 %
Self-rated memory 4 (3–5) 4 (3–4) 4 (3–5) 4 (3–4)
The results are presented as weighted percentages, weighted means (mean self-rated health) or weighted medians with interquartile
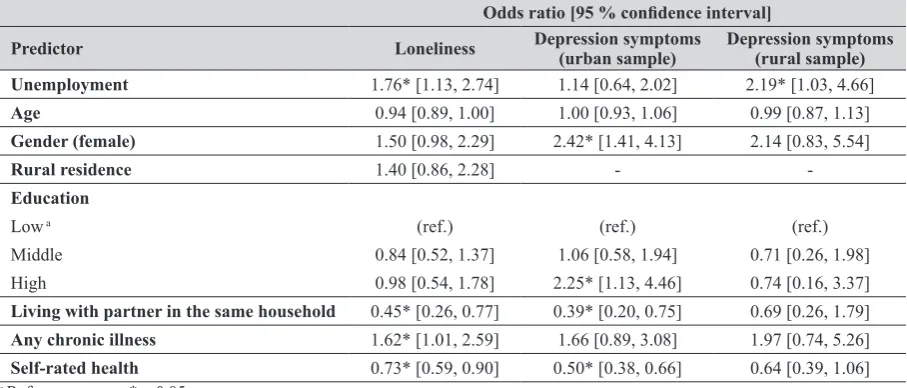
Table 3 Predictors of loneliness and depression symptoms (urban and rural settlement) in older Croatian workers (N=650)
Odds ratio [95 % confidence interval]
Predictor Loneliness Depression symptoms (urban sample) Depression symptoms (rural sample) Unemployment 1.76* [1.13, 2.74] 1.14 [0.64, 2.02] 2.19* [1.03, 4.66]
Age 0.94 [0.89, 1.00] 1.00 [0.93, 1.06] 0.99 [0.87, 1.13]
Gender (female) 1.50 [0.98, 2.29] 2.42* [1.41, 4.13] 2.14 [0.83, 5.54]
Rural residence 1.40 [0.86, 2.28] -
-Education
Low a (ref.) (ref.) (ref.)
Middle 0.84 [0.52, 1.37] 1.06 [0.58, 1.94] 0.71 [0.26, 1.98]
High 0.98 [0.54, 1.78] 2.25* [1.13, 4.46] 0.74 [0.16, 3.37]
Living with partner in the same household 0.45* [0.26, 0.77] 0.39* [0.20, 0.75] 0.69 [0.26, 1.79] Any chronic illness 1.62* [1.01, 2.59] 1.66 [0.89, 3.08] 1.97 [0.74, 5.26] Self-rated health 0.73* [0.59, 0.90] 0.50* [0.38, 0.66] 0.64 [0.39, 1.06]
a Reference group; *p<0.05
Regardless of the place of residence, unemployment predicted higher feeling of loneliness. The unemployed participants had 76 % higher odds of reporting loneliness symptoms than the employed participants, while controlling for other predictors in the model [odds ratio (OR) 1.76 with
95 % confidence interval (CI) 1.13, 2.74, Table 3]. The
feeling of loneliness was also more likely in respondents living without a partner in the same household, those reporting chronic illnesses, and those reporting poorer health.
Unlike loneliness, depression symptoms were described by different predictors depending on the place of residence. Quite expectedly, women from urban residences had at least double the odds of men to have more severe depression symptoms [OR=2.42 [1.41, 4.13]]. Judging by the review of Piccinelli and Wilkinson (32), this finding is consistent with the findings of a number of epidemiological studies reporting greater prevalence and morbidity risk of depressive disorders in women. Cohabitation confirmed the
expectations as a protective factor for emotional health in terms of depression symptoms and feeling of loneliness across the whole sample. Curiously enough, living without a partner in the same household predicted more pronounced
depression symptoms only in the urban sample. Similar was reported by Romans et al. (33), who also found a lower risk
of depression amongst rural dwellers. The reason may lie in the fact that those who live without a partner in their households in rural areas have stronger social connections
and potential community support from neighbours,
relatives, and other residents living in the vicinity, than people living in cities.
Reporting long-term physical and/or mental health
problems significantly predicted more intense sense of loneliness (OR=1.62 [1.01, 2.59]), while higher self-rated
health predicted less severe sense of loneliness in the whole
sample and less severe depression symptoms in the urban
self-rated health is considered to be a simple and valid
measure of health status and a valid predictor of future
mortality, morbidity, and disability (34–36). Reports on
older Croatian adults showed that, among other factors, higher self-rated health in 65-year-olds and over was
associated with higher educational level, better health, better functional ability (26), and higher life satisfaction (37). This finding was no surprise, since subjective estimation of one’s health comprises broad mental health aspects (38). We should bear in mind, however, that the relation between depression and perception of one’s health is bi-directional, as depression contributes to the self-perception of poor
health.
Interestingly enough, of all the associations between
education (low, middle, and high) and mental health
variables (loneliness and depression symptoms) only high education in the urban residents turned out to be a good predictor of more severe depression symptoms (Table 3). Greater vulnerability of highly educated urban residents to
depression symptoms may point to specific stressful
circumstances pertinent to the urban way of life.
Cognitive functions of older Croatian workers
Considering calculation with percentages we found that
urban women showed poorer performance in numerical tasks than men (Table 4). As expected, participants with middle or high education performed better in this task than
those with low education. Those living with the partner in
the same household also performed better.
Table 4
Predictors of cognitive functions in older Croatian workers (N
=650)
Pr
edictor
Odds ratio [95
% confidence interval]
β [95
% confidence interval]
Poor
calculation
with per
centages
(urban sample)
Poor
calculation
with per
centages
(rural sample)
Poor
subtraction
(urban sample)
Poor
subtraction
(rural sample)
Poor
immediate
verbal r
ecall
Poor
delayed
verbal r
ecall
Verbal fluency
Unemployment
0.88 [0.58, 1.34]
1.96 [0.97, 3.96]
1.07 [0.63, 1.82]
3.05* [1.36, 6.82]
0.91 [0.63, 1.33]
0.92 [0.63, 1.36]
0.02 [-0.03, 0.06]
Age
1.04 [0.99, 1.1
1]
1.00 [0.90, 1.1
1]
0.99 [0.93, 1.06]
1.08 [0.97, 1.22]
0.96 [0.92, 1.01]
0.97 [0.92, 1.02]
0.00 [-0.01, 0.01]
Gender
(female)
1.52* [1.07, 2.15]
0.90 [0.46, 1.77]
2.28* [1.40, 3.71]
2.58* [1.09, 6.12]
0.78 [0.56, 1.10]
0.82 [0.60, 1.12]
-0.02 [-0.05, 0.02]
Rural r
esidence
-0.96 [0.64, 1.43]
1.05 [0.67, 1.65]
-0.07* [-0.13, -0.01]
Education Low
a
(ref.)
(ref.)
(ref.)
(ref.)
(ref.)
(ref.)
(ref.)
Middle
0.53* [0.33, 0.84]
1.13 [0.54, 2.37]
0.50* [0.28, 0.89]
1.13 [0.49, 2.60]
0.52* [0.35, 0.76]
0.60* [0.40, 0.88]
0.04 [-0.01, 0.09]
High
0.53* [0.31, 0.91]
0.94 [0.32, 2.75]
0.79 [0.42, 1.46]
0.24 [0.03, 1.82]
0.43* [0.26, 0.70]
0.42* [0.25, 0.73]
0.06 [-0.01, 0.12]
Living with a partner
in the
same household
0.51* [0.28, 0.93]
0.84 [0.37, 1.91]
1.24 [0.61, 2.53]
0.50 [0.19, 1.34]
0.72 [0.44, 1.18]
0.87 [0.53, 1.44]
0.02 [-0.05, 0.08]
Any chr
onic illness
0.87 [0.57, 1.33]
1.76 [0.83, 3.72]
0.95 [0.56, 1.63]
1.60 [0.58, 4.45]
1.23 [0.83, 1.82]
1.28 [0.85, 1.92]
-0.01 [-0.06, 0.04]
Self-rated health
1.09 [0.89, 1.34]
0.88 [0.62, 1.24]
0.80 [0.63, 1.02]
0.83 [0.56, 1.22]
0.94 [0.78, 1.14]
1.12 [0.93, 1.35]
0.03* [0.00, 0.05]
Self-rated memory
-0.78* [0.64, 0.96]
0.70* [0.56, 0.86]
performed better in both types of verbal recall tasks
(immediate and delayed), irrespective of gender and place
of residence (Table 4).
We were also interested in the association between
self-rated memory and the actual performance in two memory tests, as memory decline is a very common complaint among the elderly, and impaired memory may severely
affect everyday functioning and mental health. Balash et
al. (39) found that memory complaints of the elderly
respondents were associated with sub-clinical symptoms of depression, even among those without objectively
measured cognitive decline. Our results suggest that
self-rated memory is a good predictor of performance in both immediate and delayed verbal memory tests. Even though self-assessment of one’s memory is often used as a
screening tool in clinical practice, there is only limited
evidence that such estimation corresponds to objective measures of one’s memory function (40).
Verbal fluency was significantly associated with urban residence and better self-rated health, irrespective of other factors (Table 4). It is well known that healthy persons retain speech fluency well into their 70s (41) and that the design of verbal fluency tests, i. e. calling for items only in a
specific category, reinforces these memory processes. Interestingly enough, of all cognitive outcomes in our study
only verbal fluency was not predicted by age, gender, or
education level.
Limitations
The main limitation of this study is its cross-sectional design, which gives no evidence of a temporal relationship
between exposure and outcome and does not allow conclusions about the causal relationships between mental
health and employment status. Furthermore, we were not
able to control for the duration of unemployment, which
could also have influenced the results. Moreover, the depression symptoms were assessed, and
self-assessment may be biased by the mood state at the time of
the interview (42).
CONCLUSIONS
Despite its limitations, our study clearly suggests that
belonging to the active workforce helps older workers in Croatia feel socially engaged and fully contributing to the
community. Unemployment in this population carries the
risks of the development of mental health problems such
as increased symptoms of loneliness and depression. Even
specific cognitive functions may be affected by these
adverse health and psychosocial conditions. Keeping older
workers in the active workforce may be a reasonable
preventive intervention strategy aiming at protecting
workers’ well-being and reducing health care system
expenditures.
SHARE data collection has mainly been funded by the
European Commission through the following Framework
Programmes: FP5 (QLK6-CT-2001-00360), FP6 (SHARE-I3: RII-CT-2006-062193, COMPARE:
CIT5-CT-2005-028857, SHARELIFE: CIT4-CT-2006-028812),
and FP7 (SHARE-PREP: N°211909, SHARE-LEAP: N°227822, SHARE M4: N°261982). Additional funding
was received from the German Ministry of Education and
Research, the Max Planck Society for the Advancement of Science, the US National Institute on Aging (U01_ AG09740-13S2, P01_AG005842, P01_AG08291, P30_ AG12815, R21_AG025169, Y1-AG-4553-01, IAG_ BSR06-11, OGHA_04-064, HHSN271201300071C) and
from various national funding sources (see www.share-project.org).
Conflict of interest
None to declare.
REFERENCES
1. Eurostat Statistics Explained. Europe 2020 indicators -
employment [dislayed 25 March 2019]. Available at http://
ec.europa.eu/eurostat/statistics-explained/index.php/
Europe_2020_indicators_-_employment
2. Galić Z, Šverko B. Effects of prolonged unemployment and
reemployment on psychological and physical health. Rev
Psychol 2008;15:3–10.
3. Kerovec N. Poteškoće u zapošljavanju osoba starije dobi [Difficulties in employing elderly persons, in Croatian]. Rev Soc Polit 2001;8:267–77. doi: 10.3935/rsp.v8i3.199
4. Šverko B, Galić Z, Maslić Seršić D. Nezaposlenost i socijalna isključenost: longitudinalna studija [Unemployment and social exclusion: a longitudinal study, in Croatian]. Rev Soc Polit
2006;13:1–14. doi: 10.3935/rsp.v13i1.417
5. Paul KI, Moser K. Unemployment impairs mental health: Meta-analyses. J Vocat Behav 2009;74:264–82. doi: 10.1016/j. jvb.2009.01.001
6. Worach-Kardas H, Kostrzewski S. Quality of life and health state of long-term unemployed in older production age. App Res Qual Life 2014;9:335–53. doi: 10.1007/s11482-013-9240-z 7. Wray LA. Mental health and labor force exits in older workers:
the mediating or moderating roles of physical health and job factors. WP 2003-047 Michigan Retirement Research Center,
University of Michigan, 2003 [displayed 25 March 2019].
Available at https://deepblue.lib.umich.edu/bitstream/ handle/2027.42/50572/wp047.pdf?sequence=1&isAllowed=y
8. Boyce CJ, Wood AM, Daly M, Sedikides C. Personality change following unemployment. J Appl Psychol 2015;100:991–1011.
doi: 10.1037/a0038647
9. Mousteri V, Daly M, Delaney L. The scarring effect of
unemployment on psychological well-being across Europe.
Soc Sci Res 2018;72:146–69. doi: 10.1016/j. ssresearch.2018.01.007
10. Leist AK, Glymour MM, Mackenbach JP, van Lenthe FJ,
2013;23:455–62. doi: 10.1016/j.annepidem.2013.05.014 11. Fitch C, Hamilton S, Bassett P, Davey R. The relationship
between personal debt and mental health: a systematic review.
Mental Health Rev J 2011;16:153–66. doi: 10.1108/13619321111202313
12. Šlachtová H, Jiřík V, Tomášek I, Tomášková H. Environmental
and socioeconomic health inequalities: a review and an
example of the industrial Ostrava region. Cent Eur J Public
Health 2016;24(Suppl):S26–32. doi: 10.21101/cejph.a4535 13. Silva M, Loureiro A, Cardoso G. Social determinants of mental
health: a review of the evidence. Eur J Psychiat 2016;30:259–92.
14. Jurcev-Savicevic A, Mulic R, Ban B, Kozul K, Bacun-Ivcek L, Valic J, Popijac-Cesar G, Marinovic-Dunatov S, Gotovac M, Simunovic A. Risk factors for pulmonary tuberculosis in Croatia: a matched case-control study. BMC Public Health
2013;13:991. doi: 10.1186/1471-2458-13-991.
15. Vončina L, Pristaš I, Mastilica M, Polašek O, Šošić Z, Stevanović R. Use of preventive health care services among
the unemployed in Croatia. Croat Med J 2007;48:667–74.
PMCID: PMC2205972
16. Dragun A, Russo A, Rumboldt M. Socioeconomic stress and
drug consumption: unemployment as an adverse health factor
in Croatia. Croat Med J 2006;47:685–92. PMCID: PMC2080470
17. Bartley M. Unemployment and ill health: understanding the
relationship. J Epidemiol Community Health 1994;48:333–7.
PMCID: PMC1059979
18. Škare M, Buterin V. Modelling and forecasting unemployment
non-linear dynamics using spectral analysis. Inz Ekon 2015;26:373–83. doi: 10.5755/j01.ee.26.4.8718
19. Bosque-Prous M, Espelt A, Sordo L, Guitart AM, Brugal MT, Bravo MJ. Job loss, unemployment and the incidence of
hazardous drinking during the late 2000s recession in Europe
among adults aged 50–64 years. PLoS One
2015;10(10):e0140017. doi: 10.1371/journal.pone.0140017 20. Brandt M, Hank K. Scars that will not disappear: long-term
associations between early and later life unemployment under different welfare regimes. J Soc Policy 2014;43:727–43. doi:
10.1017/S0047279414000397
21. Alavinia SM, Burdorf A. Unemployment and retirement and
ill-health: a cross-sectional analysis across European countries. Int Arch Occup Environ Health 2008;82:39–45. doi: 10.1007/ s00420-008-0304-6
22. Börsch-Supan A. Survey of Health, Ageing and Retirement in
Europe (SHARE) Wave 6. Release version: 6.0.0. SHARE-ERIC. Data set. 2018. doi: 10.6103/SHARE.w6.600 23. Malter F, Börsch-Supan A, editors. SHARE Wave 6: Panel
Innovations and Collecting Dried Blood Spots. Munich:
Munich Center for the Economics of Aging (MEA); 2017. 24. Börsch-Supan A, Brandt M, Hunkler C, Kneip T, Korbmacher J,
Malter F, Schaan B, Stuck S, Zuber S. Data resource profile: The
Survey of Health, Ageing and Retirement in Europe (SHARE). Int J Epidemiol 2013;42:992–1001. doi: 10.1093/ije/dyt088 25. Malter F, Schuller K, Börsch-Supan A. SHARE Compliance
Profiles - Wave 6. Munich: MEA, Max Planck Institute for Social Law and Social Policy; 2016.
26. Smolić Š. The determinants of health among the population aged 50 and over: evidence from Croatia. Public Sector
Economics 2017;41:85–108. doi: 10.3326/pse.41.1.9 27. Eurostat Statistics Explained. International Standard
Classification of Education (ISCED) [displayed 26 March
explained/index.php/International_Standard_Classification_ of_Education_(ISCED)#ISCED_1997_.28fields.29_and_ ISCED-F_2013
28. Prince MJ, Reischies F, Beekman AT, Fuhrer R, Jonker C, Kivela SL, Lawlor BA, Lobo A, Magnusson H, Fichter M, van Oyen
H, Roelands M, Skoog I, Turrina C, Copeland JR. Development of the EURO-D scale - a European Union initiative to compare
symptoms of depression in 14 European centres. Br J Psychiatry 1999;174:330–8. doi: 10.1192/bjp.174.4.330
29. Hughes ME, Waite LJ, Hawkley LC, Cacioppo JT. A short scale for measuring loneliness in large surveys: results from
two population-based studies. Res Aging 2004;26:655–72.
doi: 10.1177/0164027504268574
30. Malter F, Börsch-Supan A, editors. SHARE Wave 4 Innovations & Methodology. Munich: MEA, Max Planck Institute for Social Law and Social Policy; 2013.
31. The R Development Core Team. R: A Language and Environment for Statistical Computing. Vienna: R Foundation for Statistical Computing; 2014.
32. Piccinelli M, Wilkinson G. Gender differences in depression: Critical review. Br J Psychiatry 2000;177:486–92. doi: 10.1192/bjp.177.6.486
33. Romans S, Cohen M, Forte T. Rates of depression and anxiety
in urban and rural Canada. Soc Psychiatry Psychiatr Epidemiol
2011;46:567–75. doi: 10.1007/s00127-010-0222-2
34. Bailis DS, Segall A, Chipperfield JG. Two views of self-rated
general health status. Soc Sci Med 2003;56:203–17. doi: 10.1016/S0277-9536(02)00020-5
35. Dominick KL, Ahern FM, Gold CH, Heller DA. Relationship of health-related quality of life to health care utilization and mortality among older adults. Aging Clin Exp Res
2002;14:499–508. doi: 10.1007/BF03327351
36. Idler EL, Benyamini Y. Self-rated health and mortality: a
review of twenty-seven community studies. J Health Soc
Behav 1997;38:21–37. doi: 10.2307/2955359
37. Lučanin D, Despot Lučanin J, Košćec Bjelajac A, Delale EA.
Longitudinal psychosocial predictors of life satisfaction in old
persons. In: Proceedings of the 20th Psychology Days in Zadar;
19–21 May 2017. Zadar, Croatia. Zadar: University of Zadar; 2017. p. 115–25.
38. Lachytova M, Katreniakova Z, Mikula P, Jendrichovsky M, Nagyova I. Associations between self-rated health, mental health problems and physical inactivity among urban adolescents. Eur J Public Health 2017;27:984–9. doi: 10.1093/ eurpub/ckx051
39. Balash Y, Mordechovich M, Shabtai H. Merims D, Giladi N. Subjective memory decline in healthy community-dwelling elders. What does this complain mean? Acta Neurol Scand
2010;121:194–7. doi: 10.1111/j.1600-0404.2009.01159.x 40. Huang Z, Maurer J. Validity of self-rated memory among
middle-aged and older chinese adults: results from the China Health and Retirement Longitudinal Study (CHARLS).
Assessment 2017 Nov 1:1073191117741188. doi:
10.1177/1073191117741188
41. Benton AL, Sivan AB. Problems and conceptual issues in
neuropsychological research in aging and dementia. J Clin
Neuropsychol 1984;6:57–63. doi: 10.1080/01688638408401196
42. Klein DN, Kotov R, Bufferd SJ. Personality and depression:
explanatory models and review of the evidence. Ann Rev Clin
Psychol 2011;7:269–95. doi:
Cilj ovog rada bio je ispitati mentalno zdravlje i kognitivne funkcije starijih radnika u Hrvatskoj (50–65 godina), uzimajući u obzir njihov radni status, samoprocjenu zdravlja i skupinu demografskih karakteristika. Analizirani su podaci o 650
starijih radnika (71 % zaposlenih) iz šestog vala Istraživanja o zdravlju, starenju i umirovljenju u Europi (SHARE).
Nezaposleni stariji radnici značajno su češće navodili simptome usamljenosti nego zaposleni, a u sudionika iz ruralnih područja nezaposlenost je dodatno bila povezana s izraženijim simptomima depresivnosti. Osjećaj usamljenosti također je bio izraženiji u onih koji žive bez partnera u istom domaćinstvu i onih slabijeg zdravlja. Kad je riječ o sudionicima koji žive u gradu, simptomi depresivnosti bili su izraženiji u žena, u onih koji imaju više obrazovanje, u onih koji žive bez partnera i u onih koji svoje zdravlje procjenjuju lošijim. Što se tiče kognitivnih funkcija, nezaposlenost je bila značajni prediktor lošijeg rezultata na zadacima oduzimanja u ruralnom poduzorku. Žene su općenito pokazale slabije numeričke sposobnosti. U gradskom poduzorku slabije numeričke sposobnosti bile su također povezane s nižom razinom obrazovanja i životom bez partnera u domaćinstvu. Bolje verbalno dosjećanje bilo je povezano s boljim obrazovanjem i boljom samoprocjenom pamćenja. Prediktori boljih rezultata na testu verbalne fluentnosti bili su stanovanje u gradu i bolja samoprocjena zdravlja. Naši rezultati pokazuju da su zaposlenost, bolje obrazovanje, život s partnerom i bolje zdravstveno
stanje protektivni faktori mentalnog zdravlja i kognitivnog funkcioniranja starijih radnika u Hrvatskoj.