Analyzing brain structural differences
associated with categories of blood pressure
in adults using empirical kernel mapping‑based
kernel ELM
+
Xinying Yu
1,2, Bo Peng
2, Zeyu Xue
1,2, Hamidreza Saligheh Rad
2,3, Zhenlin Cai
4,5, Jun Shi
1, Jianbing Zhu
4,5*and Yakang Dai
2,6,7,8*Abstract
Background: Hypertension increases the risk of angiocardiopathy and cognitive disorder. Blood pressure has four categories: normal, elevated, hypertension stage 1 and hypertension stage 2. The quantitative analysis of hypertension helps determine disease status, prognosis assessment, guidance and management, but is not well stud-ied in the framework of machine learning.
Methods: We proposed empirical kernel mapping-based kernel extreme learning machine plus (EKM–KELM+) classifier to discriminate different blood pressure grades in adults from structural brain MR images. ELM+ is the extended version of ELM, which integrates the additional privileged information about training samples in ELM to help train a more effective classifier. In this work, we extracted gray matter volume (GMV), white matter volume, cerebrospinal fluid volume, cortical surface area, cortical thick-ness from structural brain MR images, and constructed brain network features based on thickness. After feature selection and EKM, the enhanced features are obtained. Then, we select one feature type as the main feature to feed into KELM+, and the rest of the feature types are PI to assist the main feature to train 5 KELM+ classifiers. Finally, the 5 KELM+ classifiers are ensemble to predict classification result in the test stage, while PI is not used during testing.
Results: We evaluated the performance of the proposed EKM–KELM+ method using four grades of hypertension data (73 samples for each grade). The experimental results show that the GMV performs observably better than any other feature types with a comparatively higher classification accuracy of 77.37% (Grade 1 vs. Grade 2), 93.19% (Grade 1 vs. Grade 3), and 95.15% (Grade 1 vs. Grade 4). The most discriminative brain regions found using our method are olfactory, orbitofrontal cortex (inferior), supple-mentary motor area, etc.
Conclusions: Using region of interest features and brain network features, EKM–
KELM+ is proposed to study the most discriminative regions that have obvious
structural changes in different blood pressure grades. The discriminative features that are selected using our method are consistent with the existing neuroimaging studies.
Open Access
© The Author(s) 2019. This article is licensed under a Creative Commons Attribution 4.0 International License, which permits use, sharing, adaptation, distribution and reproduction in any medium or format, as long as you give appropriate credit to the original author(s) and the source, provide a link to the Creative Commons licence, and indicate if changes were made. The images or other third party material in this article are included in the article’s Creative Commons licence, unless indicated otherwise in a credit line to the material. If material is not included in the article’s Creative Commons licence and your intended use is not permitted by statutory regulation or exceeds the permitted use, you will need to obtain permission directly from the copyright holder. To view a copy of this licence, visit http://creat iveco mmons .org/ licen ses/by/4.0/. The Creative Commons Public Domain Dedication waiver (http://creat iveco mmons .org/publi cdoma in/zero/1.0/) applies to the data made available in this article, unless otherwise stated in a credit line to the data.
RESEARCH
*Correspondence: [email protected]; [email protected]
2 Suzhou Institute
of Biomedical Engineering and Technology, Chinese Academy of Science, Suzhou, Jiangsu, China
4 The Affiliated Suzhou
Science & Technology Town Hospital of Nanjing Medical University, Suzhou, Jiangsu, China
Moreover, our study provides a potential approach to take effective interventions in the early period, when the blood pressure makes minor impacts on the brain structure and function.
Keywords: Hypertension, Magnetic resonance imaging (MRI), Kernel extreme learning machine plus (KELM+), Empirical kernel mapping (EKM), Regions of interest (ROI) features, Brain network features
Background
Hypertension is one of the risk factors for cognitive dysfunction. According to the epi-demiological survey, the global incidence of hypertension in 2000 was about 26.4%, affecting 972 million people worldwide. By 2025, the number of people affected by hypertension is to increase by 60% to 1.56 billion [1]. A long-term follow-up of elderly patients at risk for cardiovascular disease found that the patient’s blood pressure (BP) variability affects the patient’s cognitive function [2]. A latitudinal investigation dem-onstrates that high systolic blood pressure (SBP), high diastolic blood pressure (DBP) and persistent hypertension can accelerate the decline of cognitive function, as well as increase the incidence of dementia [3]. Longitudinal studies have found that antihyper-tensive therapy can effectively reduce the incidence of cognitive dysfunction [4]. Exces-sive BP can cause cerebral vascular damage, which in turn causes white matter and gray matter ischemic or hemorrhagic damage [5], while white matter and gray matter ischemia can cause brain atrophy and leukoaraiosis. All these studies indicate that high BP may affect cognitive function.
Hypertension can be classified by severity. The classification scheme for hypertension helps determine the condition, quantify the risk, evaluate the prognosis and guide the management [6]. The “2017 American College of Cardiology/American Heart Associa-tion (2017 ACC/AHA) Guideline for the PrevenAssocia-tion, DetecAssocia-tion, EvaluaAssocia-tion, and Man-agement of High Blood Pressure in Adults” recently recommended a new categorization for BP grades. This new guideline commends that BP should be classified in four catego-ries: normal (Grade 1), elevated (Grade 2), hypertension stage 1 (Grade 3) and 2 (Grade 4). And defined hypertension as a SBP of ≥ 130 mmHg and/or a DBP of ≥ 80 mmHg,
reducing the former SBP and DBP by 10 mmHg (a SBP of ≥ 140 mmHg and/or DBP
of ≥ 90 mmHg [7]). The research of Ettehad [8] and Xie et al. [9] also supported this BP ≥ 130/80 mmHg as critical value of hypertension intervention.
The overall situation of prevention and control of hypertension in China is severe. At present, Chinese diagnostic criteria of hypertension is still BP ≥ 140/90 mmHg. Accord-ing to the 2017 ACC/AHA new diagnostic criteria of hypertension, China will add another 100 million hypertensive patients. Treatment in the early stages of disease devel-opment may help prevent the develdevel-opment of cardiovascular disease and reduce the risk and complications of hypertension [10, 11]. It is necessary for us to learn from the 2017 ACC/AHA guidelines, which is of great significance for the prevention and control of hypertension as well as the entire chronic patient population in China.
morphometry to study the gray matter and white matter volume of hypertension, reveal-ing the relationship between hypertension and anterior creveal-ingulate cortex (ACC), lower forehead (IFG) and hippocampal volume. Studies of structural abnormalities in the brain based on MR images of hypertensive patients have shown that brain atrophy and brain tissue lesions often occurred in gray matter and white matter [14, 15], affecting the transport of nutrients to neurons and leading to the decline of cognitive function [16]. From MR-related studies, it is known that gray matter damages appeared in the pre-frontal cortex, hippocampus, lower jaw, and inferior parietal lobe, white matter lesions mainly occurs in the frontal area [17, 18]. Peter et al. [19] demonstrated that atrophy of the auxiliary motor areas, superior frontal gyrus, anterior cingulate cortex and middle temporal lobe is associated with hypertension. In addition, high BP gives rise to atrophy of the medial temporal lobe, which plays an important role in cognitive development [20]. Detection of hypertension-related brain regions is of great value in clinical and aca-demic studies. Those researches above have only studied hypertension brain morphom-etry. Their subjects consist of normal group and hypertension group whose diagnostic criterion is BP ≥ 140/90 mmHg. And less use automated classification to extract hyper-tension-related brain regions. Therefore, more studies are needed to further explain the relationship between BP grades and brain morphometry.
In this paper, we examined the hypertension-related brain morphometry in regions of interest (ROIs) using features, which consist of ROI features and brain network features. ROI features were extracted from the brain structural MR images including gray matter volume (GMV), white matter volume (WMV), cerebrospinal fluid volume (CSFV), corti-cal thickness (Thickness), and corticorti-cal surface area (Area). Brain network features were constructed by computing the correlation index of cortical thickness values between ROIs. The two feature types complement each other in revealing neuroanatomical infor-mation about hypertension.
Due to the complexity of brain diseases, the use of single information cannot fully represent the disease characteristics in process of the diagnosis. For this reason, com-prehensive consideration of multiple information is required. Learning Using Privileged Information (LUPI), a new learning paradigm for classifier proposed by Vapnik and Vashist, can be a good way to solve this problem. The privileged information (PI) is only available during the training phase of model, but unavailable during the testing phase [21]. PI can help establish better prediction rules by providing additional information to training samples. It has become a trend for researchers to embed LUPI paradigm in dif-ferent classifiers, such as the support vector machine plus (SVM+) and random vector functional link network plus (RVFL+) [22], which usually achieves improved classifica-tion performance [21].
nuances of ELM and RVFL, we also consider that KELM+ outperforms SVM+ in the network structure.
Empirical kernel mapping (EKM), one of the kernel methods, can map raw data to a high-dimensional data space via the inner-product forms [25], which works as the implicit kernel mapping (IKM) [25]. EKM overcomes the limitations of traditional IKM on inner-product calculation, and can explicitly map samples to feature space. In the meanwhile, it can fully retain the structural characteristics of data [26].
In this study, we proposed an EKM-based KELM+ (EKM–KELM+) method, which
can be used to investigate brain structural differences in different grades of BP. Specif-ically, first EKM performed on six types of feature to generate six enhanced features. Then, one type of feature is selected as the main feature, and the other five features are used as PI, together with the main feature to form five feature pairs, which are built to train five individual KELM+ classifiers. Finally, ensemble learning is performed on the KELM+ classifiers to give the classification result.
The main contributions of the method are twofold: (1) by transforming the origi-nal features to high-dimensioorigi-nal to form enhancement features through EKM, EKM– KELM+ has a more meaningful input layer in the neural network, which help improving classification performance; (2) instead of using simple multi-level ROI for mixed ture selection, one soft tissue feature is selected as main feature, and the other five fea-tures are used as PI to assist the classifiers training. Only the main feature is used in the testing. The most discriminative brain regions, which have structural changes affected by hypertension, can be found using our method. This can also help us to analyze the changes of specific brain regions in BP from grade 2 to grade 4. Moreover, our study pro-vides a potential approach to take effective interventions in the early period, when the BP has minor impacts on the brain structure and function.
Results
The proposed EKM–KELM+ algorithm is compared with the following algorithms: (1) SVM classifier with Radial Basis Function (RBF) kernel is used for every ROI feature; (2) KELM classifier is used for every ROI feature; (3) KELM+ without EKM.
In this experiment, the fivefold cross-validation (CV) strategy was conducted; for each round of CV, the performance of the model can be calculated separately, which reduces the variance of the evaluation. The classification accuracy (ACC), sensitivity (SEN), specificity (SPC), Youden index (YI), positive predictive value (PPV), negative predictive value (NPV) and F1-score (F1) are used as evaluation indices. Our classification results were presented in the form of mean ± SD.
Classification performance
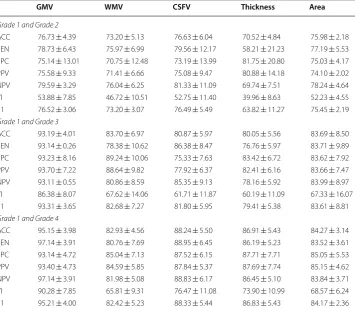
sensitivity of 93.14%, and specificity of 93.23% in Grade 1 and Grade 3. In Grade 1 and Grade 4 group, GMV has the highest classification accuracy of 95.15%, sensitivity of 97.14%, and specificity of 93.14%, while WMV performs worst.
It can be seen from Table 1 that all the best results are achieved on GMV. It means that the high BP group and the normal BP group have more differences in GMV than in oth-ers. On every type of feature, the classification accuracy increases with the increase of BP grade, which indicates that higher BP will aggravate the change of ROI feature.
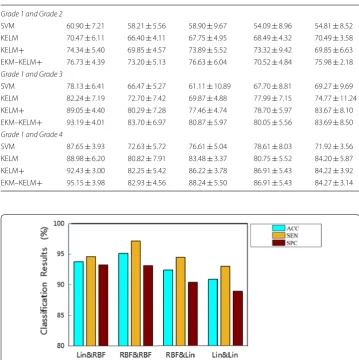
Table 2 gives the classification results of different algorithms on the different feature types. It can be found that the proposed EKM–KELM+ outperforms all the compared algorithms.
Experiment on kernel type
Different kernel function types represent different ways of data mapping. Polynomial kernel, RBF kernel, and linear kernel are mostly used kernel types. In this study, we used RBF kernel and linear kernel. We chose the most suitable kernel function type through experiments to achieve the best classification performance. Classification results of Grade 1 vs. Grade 4, using EKM–KELM+ with different kernel types (RBF kernel or linear kernel of EKM & KELM+) on the GMV feature are shown in Fig. 1. Experimental
Table 1 Classification performance using different feature types between Grade 1 and Grade 2, Grade 1 and Grade 3 and Grade 1 and Grade 4 (mean ± std, UNIT: %)
GMV gray matter volume, WMV white matter volume, CSFV cerebrospinal volume, thickness, cortical thickness, Area cortical surface area, ACC accuracy, SEN sensitivity, SPC specificity, PPV positive predictive value, NPV negative predictive value, YI Youden’s index, F1 F1‑score
GMV WMV CSFV Thickness Area
Grade 1 and Grade 2
ACC 76.73 ± 4.39 73.20 ± 5.13 76.63 ± 6.04 70.52 ± 4.84 75.98 ± 2.18 SEN 78.73 ± 6.43 75.97 ± 6.99 79.56 ± 12.17 58.21 ± 21.23 77.19 ± 5.53 SPC 75.14 ± 13.01 70.75 ± 12.48 73.19 ± 13.99 81.75 ± 20.80 75.03 ± 4.17 PPV 75.58 ± 9.33 71.41 ± 6.66 75.08 ± 9.47 80.88 ± 14.18 74.10 ± 2.02 NPV 79.59 ± 3.29 76.04 ± 6.25 81.33 ± 11.09 69.74 ± 7.51 78.24 ± 4.64 YI 53.88 ± 7.85 46.72 ± 10.51 52.75 ± 11.40 39.96 ± 8.63 52.23 ± 4.55 F1 76.52 ± 3.06 73.20 ± 3.07 76.49 ± 5.49 63.82 ± 11.27 75.45 ± 2.19 Grade 1 and Grade 3
ACC 93.19 ± 4.01 83.70 ± 6.97 80.87 ± 5.97 80.05 ± 5.56 83.69 ± 8.50 SEN 93.14 ± 0.26 78.38 ± 10.62 86.38 ± 8.47 76.76 ± 5.97 83.71 ± 9.89 SPC 93.23 ± 8.16 89.24 ± 10.06 75.33 ± 7.63 83.42 ± 6.72 83.62 ± 7.92 PPV 93.70 ± 7.22 88.64 ± 9.82 77.92 ± 6.37 82.41 ± 6.16 83.66 ± 7.47 NPV 93.11 ± 0.55 80.86 ± 8.59 85.35 ± 9.13 78.16 ± 5.92 83.99 ± 8.97 YI 86.38 ± 8.07 67.62 ± 14.06 61.71 ± 11.87 60.19 ± 11.09 67.33 ± 16.07 F1 93.31 ± 3.65 82.68 ± 7.27 81.80 ± 5.95 79.41 ± 5.38 83.61 ± 8.81 Grade 1 and Grade 4
results show that the kernel function has an important impact on the performance of the classification. Using RBF kernel for EKM and KELM+ can achieve the best classification performance, which reflects the robustness of our method. The RBF kernel function is commonly used as the kernel functions for the reason that is has good anti-interference ability for noise in the data.
The most discriminative features
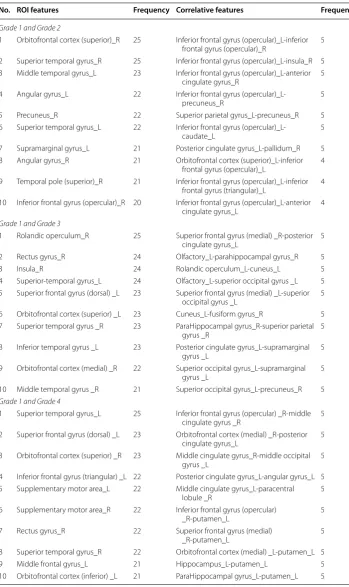
The most discriminative features are selected from ROI features and brain network fea-tures, respectively. The top 10 of the most discriminative ROI features and brain network features for Grade 2, Grade 3 and Grade 4 compared with Grade 1 are listed in Table 3.
For Grade 2 compared with Grade 1, the top 10 of the most discriminative ROI fea-tures are mainly distributed in frontal lobe [inferior frontal gyrus (opercular) right, olfactory right], temporal lobe (bilateral superior temporal gyrus, middle temporal gyrus
Table 2 Comparison with different types of features using different algorithms on classification accuracy (mean ± std, UNIT: %)
GMV WMV CSFV Thickness Area
Grade 1 and Grade 2
SVM 60.90 ± 7.21 58.21 ± 5.56 58.90 ± 9.67 54.09 ± 8.96 54.81 ± 8.52 KELM 70.47 ± 6.11 66.40 ± 4.11 67.75 ± 4.95 68.49 ± 4.32 70.49 ± 3.58 KELM+ 74.34 ± 5.40 69.85 ± 4.57 73.89 ± 5.52 73.32 ± 9.42 69.85 ± 6.63 EKM–KELM+ 76.73 ± 4.39 73.20 ± 5.13 76.63 ± 6.04 70.52 ± 4.84 75.98 ± 2.18 Grade 1 and Grade 3
SVM 78.13 ± 6.41 66.47 ± 5.27 61.11 ± 10.89 67.70 ± 8.81 69.27 ± 9.69 KELM 82.24 ± 7.19 72.70 ± 7.42 69.87 ± 4.88 77.99 ± 7.15 74.77 ± 11.24 KELM+ 89.05 ± 4.40 80.29 ± 7.28 77.46 ± 4.74 78.70 ± 5.97 83.67 ± 8.10 EKM–KELM+ 93.19 ± 4.01 83.70 ± 6.97 80.87 ± 5.97 80.05 ± 5.56 83.69 ± 8.50 Grade 1 and Grade 4
SVM 87.65 ± 3.93 72.63 ± 5.72 76.61 ± 5.04 78.61 ± 8.03 71.92 ± 3.56 KELM 88.98 ± 6.20 80.82 ± 7.91 83.48 ± 3.37 80.75 ± 5.52 84.20 ± 5.87 KELM+ 92.43 ± 3.00 82.25 ± 5.42 86.22 ± 3.78 86.91 ± 5.43 84.22 ± 3.92 EKM–KELM+ 95.15 ± 3.98 82.93 ± 4.56 88.24 ± 5.50 86.91 ± 5.43 84.27 ± 3.14
Table 3 Top 10 of the most discriminative ROI features and correlative features that were selected using the proposed classification framework
R right hemisphere, L left hemisphere
No. ROI features Frequency Correlative features Frequency
Grade 1 and Grade 2
1 Orbitofrontal cortex (superior)_R 25 Inferior frontal gyrus (opercular)_L-inferior frontal gyrus (opercular)_R 5 2 Superior temporal gyrus_R 25 Inferior frontal gyrus (opercular)_L-insula_R 5 3 Middle temporal gyrus_L 23 Inferior frontal gyrus (opercular)_L-anterior
cingulate gyrus_R 5
4 Angular gyrus_L 22 Inferior frontal gyrus
(opercular)_L-precuneus_R 5
5 Precuneus_R 22 Superior parietal gyrus_L-precuneus_R 5 6 Superior temporal gyrus_L 22 Inferior frontal gyrus
(opercular)_L-caudate_L 5
7 Supramarginal gyrus_L 21 Posterior cingulate gyrus_L-pallidum_R 5 8 Angular gyrus_R 21 Orbitofrontal cortex (superior)_L-inferior
frontal gyrus (opercular)_L 4 9 Temporal pole (superior)_R 21 Inferior frontal gyrus (opercular)_L-inferior
frontal gyrus (triangular)_L 4 10 Inferior frontal gyrus (opercular)_R 20 Inferior frontal gyrus (opercular)_L-anterior
cingulate gyrus_L 4
Grade 1 and Grade 3
1 Rolandic operculum_R 25 Superior frontal gyrus (medial) _R-posterior
cingulate gyrus_L 5
2 Rectus gyrus_R 24 Olfactory_L-parahippocampal gyrus_R 5
3 Insula_R 24 Rolandic operculum_L-cuneus_L 5
4 Superior-temporal gyrus_L 24 Olfactory_L-superior occipital gyrus _L 5 5 Superior frontal gyrus (dorsal) _L 23 Superior frontal gyrus (medial) _L-superior
occipital gyrus _L 5
6 Orbitofrontal cortex (superior) _L 23 Cuneus_L-fusiform gyrus_R 5 7 Superior temporal gyrus _R 23 ParaHippocampal gyrus_R-superior parietal
gyrus _R 5
8 Inferior temporal gyrus _L 23 Posterior cingulate gyrus_L-supramarginal
gyrus _L 5
9 Orbitofrontal cortex (medial) _R 22 Superior occipital gyrus_L-supramarginal
gyrus _L 5
10 Middle temporal gyrus _R 21 Superior occipital gyrus_L-precuneus_R 5 Grade 1 and Grade 4
1 Superior temporal gyrus_L 25 Inferior frontal gyrus (opercular) _R-middle
cingulate gyrus _R 5
2 Superior frontal gyrus (dorsal) _L 23 Orbitofrontal cortex (medial) _R-posterior
cingulate gyrus_L 5
3 Orbitofrontal cortex (superior) _R 23 Middle cingulate gyrus_R-middle occipital
gyrus _L 5
4 Inferior frontal gyrus (triangular) _L 22 Posterior cingulate gyrus_L-angular gyrus_L 5 5 Supplementary motor area_L 22 Middle cingulate gyrus_L-paracentral
lobule _R 5
6 Supplementary motor area_R 22 Inferior frontal gyrus (opercular)
_R-putamen_L 5
7 Rectus gyrus_R 22 Superior frontal gyrus (medial)
_R-putamen_L 5
left), limbic lobe (temporal pole (superior) right), and parietal lobe (bilateral angular gyrus, precuneus right, supramarginal gyrus left).
For Grade 3, the main distribution of the top 10 discriminative ROI features is in frontal lobe (rectus gyrus right, superior frontal gyrus (dorsal) left, orbitofrontal cor-tex (superior) left, orbitofrontal corcor-tex (medial) right), temporal lobe (bilateral superior temporal gyrus, bilateral Inferior temporal gyrus, bilateral middle temporal gyrus), bilat-eral Insula, and central region (rolandic operculum right), which compared with Grade 1.
As for Grade 4, the top 10 of the most discriminative ROI features are found in frontal lobe (superior frontal gyrus (dorsal) left, bilateral orbitofrontal cortex (superior), bilat-eral orbitofrontal cortex (inferior), bilatbilat-eral supplementary motor area, inferior frontal gyrus (triangular) left, bilateral middle frontal gyrus, rectus gyrus right), and temporal lobe (bilateral superior temporal gyrus).
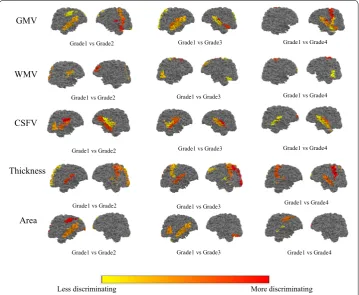
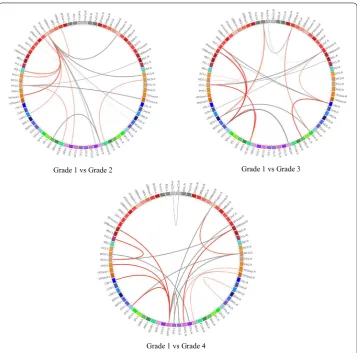
Figure 2 shows the results of projecting the most discriminative ROI features (top-10) onto the cortical surface. Three connection graphs of the most discriminative brain network features for three groups are shown in Fig. 3 (top-20), which are generated by Circos software [27]. Thicker line in the connection graph indicates stronger connec-tion between ROIs, while thinner line implies weaker connecconnec-tion. The red lines rep-resent brain connections in the same hemisphere, while the gray lines reprep-resent brain
GMV
Grade1 vs Grade2
WMV
Grade1 vs Grade2
CSFV
Grade1 vs Grade2
Grade1 vs Grade3 Grade1 vs Grade4
Grade1 vs Grade3 Grade1 vs Grade4
Grade1 vs Grade3 Grade1 vs Grade4
Less discriminating More discriminating
Thickness
Area
Grade1 vs Grade2 Grade1 vs Grade3 Grade1 vs Grade4 Grade1 vs Grade4 Grade1 vs Grade3
Grade1 vs Grade2
connections in different hemispheres of the brain. As we can see in lower grade of BP, the most discriminative brain network features are mainly distributed in left hemisphere. As the BP increases, the features will be gradually distributed in the right hemisphere and finally across both the right and left sides of the brain and almost across all brain regions, including frontal lobe, occipital lobe, limbic lobe, parietal lobe, sub-cortical gray nuclei, and central region. Moreover, regions in the bilateral frontal lobes and limbic lobes show close internal relation. That is, the most sensitive biomarkers of hypertension are mainly distributed in frontal lobe and limbic region.
Discussion
In this work, the proposed EKM–KELM+ algorithm can help study the brain struc-tural differences associated with BP grades and achieve effective classification results. Its effectiveness is demonstrated on datasets of different BP grades.
Grade 1 vs Grade 2 Grade 1 vs Grade 3
Grade 1 vs Grade 4
Improvement of the proposed method
Due to the complexity of brain diseases, the use of multiple anatomical MRI measures can provide more information to help research the disease. Although the proposed
EKM–KELM+ algorithm is based on the LUPI paradigm that required additional
modality for PI in previous work, we successfully performed EKM–KELM+ on multi-parameter information of single-modality neuroimaging data in this work. In fact, GMV, WMV, CSFV, thickness and area are extracted from structural brain MRI, brain network features are computed based on cortical thickness between ROIs. During the training phase, the five feature pairs are built to train five individual KELM+ models. While in testing phase, only one type of feature, extracting from structural brain MR images, will be directly fed to the well-trained KELM+ models to give the final clas-sification result, which is flexible and convenient. The use of EKM before KELM+ results in data obtaining a more powerful expression, which improves the classifica-tion performance.
A well-classified performance and discriminative features reported in our study are important in clinical studies. By using our model, we can classify hypertension patients as with and without structural brain changes. Clinicians can give the targeted recommendations for initiation of treatment for these two types of patients. It con-forms more with the principles of hypertension treatment.
The current studies on hypertension are all in the population with SBP ≥ 140 mmHg or DBP ≥ 90 mmHg (Grade 4), to find specific brain regions related to hypertension. However, these studies have some shortcomings. They only explain the relationship between hypertension and the relevant brain regions in a general way, which has not considered the network activity of specific brain regions. We have fixed the deficiency of these existing methods by using quantitative analysis. This can provide information of both isolated ROI and brain connectivity between pairs ROIs, and help us under-stand the change pattern of brain morphological in different BP grades.
Analysis of discriminative ROIs
We performed t test between different groups and counted the number of ROIs with significant changes (p value < 0.05) of each feature type. Figure 2 shows the results of projecting the most discriminative ROI features (top 10) onto the volumetric and cor-tical. The GMV, cortical thickness, and surface area encoded by the color from yellow (larger, thicker) to red (smaller, thinner).
Comparison with other methods
Studies have shown that high SBP, high DBP and persistent high BP will lead to cognitive impairment [28]. Morphological studies have shown that different cogni-tive dysfunction manifestations (such as overall cognicogni-tive function, execucogni-tive abil-ity, memory impairment) are associated with structural changes in specific brain regions. Researchers [29] found that hypertension patients showed atrophy of the prefrontal and hippocampus, while the prefrontal cortex was closely related to exec-utive ability, emotional processing ability, and social cognition. Blood flow in the posterior parietal region of hypertensive patients increased less than that of non-hypertensive patients when they completed the memory task, which indicates that hypertension may damage cognitive function by reducing local cerebral blood flow [30]. Elevated BP is associated with more executive function impairment than mem-ory, which shows a significant decrease compared with the executive function of the non-hypertensive group [31]. Functional magnetic resonance imaging (fMRI) and diffusion tensor imaging (DTI) on 1007 elderly populations (including 405 hyperten-sive patients) are used to find that impaired executive function and decreased atten-tion caused by hypertension may be associated with decreased white matter integrity and decreased functional connectivity of the frontotemporal lobe. In addition, corti-cal gray matter atrophy is closely related to executive dysfunction [32]. Hypertension can also cause atrophy of the medial temporal lobe, which plays an important role in cognitive formation [20].
Since there have been few reports on the automatic classification of hypertension grades, we only compared the brain regions that are differentiated in our results with existing hypertension-related morphological studies. Our results also examined the frontal lobe (bilateral orbitofrontal cortex (superior), superior frontal gyrus (dorsal) left, rectus gyrus right), temporal lobe (bilateral superior temporal gyrus, middle temporal gyrus left), central region (rolandic operculum right), insula right, limbic lobe (hippocampus), sub-cortical gray nuclei (thalamus), and parietal lobe (precu-neus right) associated with elevated BP. It is consistent with current morphologi-cal studies, demonstrating the effectiveness of our classification method in revealing hypertension-related brains. Meanwhile, the central region and insula, which have not been reported in previous hypertension-related studies, were found in our study. Further research is needed to rule out false positives in our results. It can be found that the discriminative ROIs are mostly located in frontal lobe, which is mainly responsible for planning, sequencing and organizing attention, moral judgment and self-control behaviors. This is consistent with the fact that high blood pressure can cause cognitive damages.
Limitations
Conclusion
In summary, the proposed Empirical Kernel Mapping-Based Kernel ELM+
frame-work can be used in studying the changes of brain structure associated with blood pressure by a quantitative way. One type of feature is used as the main feature, and other different feature types are used as PI. Finally, the result is obtained by ensem-ble learning. Compared with other algorithms, our method has the best classification accuracy, which can provide more accurate early intervention identification meth-ods and potential guiding significance for the treatment of hypertension patients. The ROI features and the brain network features can be used to locate specific brain regions that process hypertension. The discriminative features selection by EKM– KELM+ is consistent with existing structural studies. Moreover, our study provides an important step in investigating brain structure and brain connective changes asso-ciated with hypertension, which offers a potential research direction to further study the mechanisms basis of the cognitive neuroscience of hypertension.
Materials and methods
Participants
The structural MRI data utilized in this study were obtained from the Suzhou Science and Technology town hospital that consist 292 adults, aged from 25 to 76 years. The study is approved by the Ethics Committee of the Third Affiliated Hospital of Soo-chow University. According to the “2017 American College of Cardiology/American Heart Association (2017 ACC/AHA) Guideline for the Prevention, Detection, Evalu-ation, and Management of High Blood Pressure in Adults”, we classified the data as four grades: Grade 1, Grade 2, Grade 3, and Grade 4 (more details in Table 4). Each grade includes 73 subjects. Each participant received a structured clinical interview by a psychiatrist to rule out smoking, secondary hypertension, traumatic head injury, diabetes, and congestive heart failure or pulmonary disease. Characteristics of all subjects are shown in Table 5.
All images were collected on a Ingenia 3.0T PHILIPS Medical Systems equipment with a standard head coil. The scanning parameters are as follows: repetition time (TR) = 7.90 ms, echo time (TE) = 3.50 ms, flip angle (FA) = 8°, slice thickness = 1 mm, field of view (FOV) = 250 mm and voxel dimensions 1.0 mm isotropic.
Image process
All structural brain MR images were processed using BrainLab software [33], running automatically on Linux platform: (1) the original brain MR images were re-sampled in
Table 4 Four grades according to 2017 ACC/AHA
BP blood pressure, SBP systolic blood pressure, DBP diastolic blood pressure
Grade BP category SBP (mmHg) DBP (mmHg)
Grade 1 Normal < 120 and < 80
Grade 2 Elevated 120–129 and < 80
Grade 3 Hypertension stage 1 130–139 and/or 80–89
Grade 4 Hypertension stage 2 > 140 and/or ≥ 90
terms of direction, voxel size and volume according to right-hand rules. N3 bias field correction is to eliminate intensity non-uniformity [34]. (2) 3D deformable-surface-based brain extraction algorithm [35] removed non-brain tissue from the preprocessed images. (3) Level-set-based tissue segmentation algorithm [36] was used to separate GMV, WMV, CSFV, and background by limiting thickness to a biologically reasonable range with 1–6.5 mm. (4) Then, the tissue segmented images are registered to the brain atlas using a non-rigid matching algorithms derived from a concept of diffusing models [37]. The brain atlas is based on the Automated Anatomical Labeling (AAL) template with 45 labeled ROIs for each hemisphere [38]. (5) A deformable surface method accu-rately reconstructs inner, central, and outer cortical surfaces [39]. (6) ROI volume and cortical thickness were measured, respectively, according to the amount of voxels.
Finally, we obtained 90 cortical ROIs [40]. We computed the GMV, WMV, CSFV, Thickness, and Area for each ROI.
Feature extraction and selection
Two types of features are used in this paper: ROI features and brain network features. The ROI features are extracted from the brain structural MR images including GMV, WMV, CSFV, Thickness and Area. Considering individual differences, the GMV, WMV, CSFV of each ROI are normalized according to the total brain volume of each subject [41], and the cortical thickness and cortical surface area of each ROI are normalized according to the standard deviation and the total cortical surface area of each subject.
Brain network features have been widely used in recent years for neuroimaging-based analysis of brain disease. The brain network features consist of Pearson correlation coef-ficient which are computed based on cortical thickness between ROIs. Because sub-cortical regions are not researched in this study, we neglected 12 sub-sub-cortical ROIs of 90 cortical ROIs in the calculation [35], and finally got the 78 × 78 correlation matrix. The upper triangular elements of the matrix are used to construct the feature vector (3003-dimensional) for each subject.
Furthermore, statistical t test is first adopted to select the features with their p val-ues less than 0.05. Then, on the basis of t test, mutual information method is further used to reduce feature dimensionality and improve feature representation. After the two feature selection steps, we obtained the optimal feature subsets for each feature type, respectively.
Table 5 Characteristics of all subjects
SBP systolic blood pressure, DBP diastolic blood pressure
Grade 1 Grade 2 Grade 3 Grade 4
Number of subjects 73 73 73 73
(Male/female) (33/40) (37/36) (30/43) (31/42)
Age 40.8 ± 12.3 53.4 ± 17.6 54.1 ± 17.0 62.2 ± 14.2
Age range 25–76 25–76 25–76 25–76
Weight 62.54 ± 9.8 62.74 ± 11.53 62.30 ± 10.6 61.33 ± 10.6 Height 165.76 ± 6.7 162.13 ± 8.2 163.14 ± 7.7 164.09 ± 6.9 SBP 109.1 ± 7.3 122.9 ± 3.1 126.2 ± 6.6 153.8 ± 8.1
Classification
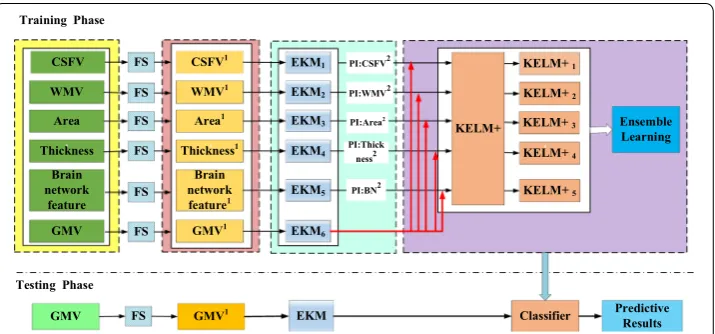
We proposed empirical kernel mapping-based kernel extreme learning machine plus (EKM–KELM+) classifier for classification. The EKM–KELM+ algorithm has 5 parts: ROI features and brain network features, feature selection (FS), features after FS, EKM, and KELM+ classifiers. FS is used for feature reduction. EKM solves the problem of data linear indivisibility and improves the performance of classifier. KELM+ is for classifica-tion. Ensemble learning is used to get the final classification label by voting on 5 classifi-cation results. In the following parts, we will further elaborate the algorithm.
Empirical kernel mapping‑based KELM+
Figure 4 shows the flowchart of the proposed EKM–KELM+ algorithm with the follow-ing steps (GMV as the main feature as an example):
1. Six kinds of features are extracted from the brain MR images after image preprocess-ing, and feature selection is performed, respectively, to obtain optimal feature sub-sets.
2. EKM is then performed on six optimal feature subsets to generate six new enhanced feature subsets.
3. The enhanced feature subsets are then sent to KELM+ classifier. During the train-ing stage, GMV is selected as the main feature sendtrain-ing to 5 KELM+ classifiers (KELM +1–KELM+5). The other five features (CSFV, WMV, Thickness, Area and
brain network feature) are used as privileged information sending to KELM+1–5, respectively, which provide additional information for the main feature GMV to train 5 KELM+ classifiers.
4. The ensemble learning algorithm is finally applied to the 5 KELM+ classifiers for classification. In this work, the final classification label is decided by voting on 5 clas-sification results.
5. During the testing stage, the GMV features extracted from structural MR images will be directly input to the 5 KELM+ classifiers (in the purple box), which then give the final classification result with the ensemble learning algorithm.
Empirical kernel mapping
The EKM algorithm maps original data to a given empirical feature space incrementally with explicit feature representation. Here is a brief introduction to EKM [42].
Let {xi}mi=1 be a d-dimensional training samples set. The input samples space is mapped
to an r-dimensional empirical feature space is by a particular kernel function Φe . The
kernel mapping of paired xi and xj is calculated as follows:
where ker(·,·) is a particular kernel function, leading to a kernel matrix K =(Ki,j)m×m ,
and K is a symmetrical positive semi-definite matrix with size of m×m . K can be
decomposed as
where Λ is a diagonal matrix containing r positive eigenvalues of K in decreasing order,
and P consists of the eigenvectors corresponding to the positive eigenvalues.
The EKM to an r-dimension Euclidean space Φr is then can be given ase
Thus a sample x can be mapped into empirical feature space incrementally with Φre(x).
KELM
The ELM performs a classification decision by nonlinearly expanding the original fea-tures (enhancement nodes) through a single hidden layer [43].
In ELM, the output weight β can be calculated by ridge regression as
where T is a label matrix, C is the regularization parameter, which represents the trade-off between the minimization of training errors and the maximization of the marginal distance and H is the enhanced matrix.
To overcome the problem of randomness in ELM, the kernel trick is then introduced into ELM as shown in Fig. 4. For KELM [23], we define the kernel matrices as
where K is a linear kernel function and K˜ represents a nonlinear kernel function. The output of KELM is then given by
(1) Ki,j =Φe(xi)T·Φe(xj)=ker(xi,xj),
(2) Km×m=Pm×rΛr×rPr×mT ,
(3) Φre(x)=Λ−1/2PT(k(x,x1),k(x,x2),. . .k(x,xm))T.
(4) β=HTH+I/C−1HTT,
(5) ˜
with the output weights calculated by the ridge regression as
KELM+
ELM+ successfully integrates the LUPI paradigm to ELM, which has simpler optimization constraint than the commonly used SVM+.
Define a set of training data {(xi,Pi,ti)|xi∈Rd1,Pi∈Rd2,ti∈Rm,i=1. . .n} , where
{Pi ∈Rd2,i=1. . .n} is a set of PI. In LUPI paradigm, ELM+ is formulated as
where ɛ is a regularization coefficient, h(xi) and h˜(Pi) are concatenated vector, and β˜ is
an output weight vector in the privileged feature space.
The Lagrangian function is then constructed to solve the optimization problem in Eq. (8) by
where =[1,. . .,n]T are Lagrange multipliers.
After using the Karush–Kuhn–Tucker (KKT) condition to calculate the saddle points of the Lagrangian function, we have
By substituting Eqs. (10) and (11) into (12), we have
After combining Eqs. (10) and (13), the closed-form solution to the ELM+ is given by
(6) f(x)=
K(x,x1)
.. . K(x,xn)
× � 1 C + ˜Ω
�−1 T,
(7)
β=
1
C + ˜Ω
−1 T.
min
β,β˜
LELM+= 1 2�β�
2+ ε
2|| ˜β||
2+ C
2 n k=1 ˜ h(Pk)β˜
2 ,
(8)
s.t. h(xk)β=tk− ˜h(Pk)β˜,∀1≤k≤n,
(9) LELM+=
1 2�β�
2+ε 2 β˜ 2 +C n
k=1
˜
h(Pk)β˜− n
k=1
h(xk)β−tk+ ˜h(Pk)β˜
,
(10) β=HT,
(11) ˜
β= 1 ε
˜
HT− ˜HTC1,
(12) ˜
h(pi)β˜−ti=0 ∀1≤i≤n.
(13)
1
ε ˜
HH˜T
=T −C1
ε ˜
Moreover, 1
C is added to Eq. (13) so as to avoid singularity and guarantee the
stabil-ity for ELM+, which leads to the following closed-form solution:
The output function of the ELM+ is defined as
Although ELM+ can implement the LUPI-based classification task, it also suffers
from the same problem of randomness as ELM. Therefore, the kernel-based ELM+
algorithm is then proposed.
For the KELM+, we define the kernel matrices with same structure as Eqs. (4) and (5), the output weight vector is then given by
The output of KELM+ is finally calculated as
For multiclass cases, the predicted class label of a testing point is the index number of the output node, which has the highest output value for the given testing samples
Abbreviations
MRI: magnetic resonance imaging; EKM: empirical kernel mapping; KELM+: kernel extreme learning machine plus; ROI: regions of interest; ACC/AHA: American College of Cardiology/American Heart Association; BP: blood pressure; GMV: gray matter volume; WMV: white matter volume; CSFV: cerebrospinal fluid volume; Thickness: cortical thickness; Area: cortical surface area; LUPI: learning using privileged information; PI: privileged information.
Acknowledgements
The authors would like to thank the physicians in the Department of Radiology, Suzhou Science and Technology Town Hospital for their helpful contribution to validating the categories of each collected blood pressure brain MR image. In addition, Xinying Yu especially wishes to thank Xuanyi Wu, whose healing smile and persistent attitude towards dreams have given her powerful spiritual support over the passed days.
Authors’ contributions
XY and BP: proposed the idea, performed experiments and analyzed the data, made discussions and composed the manuscript together with ZX and YD. HSR, ZC and JS: directed the experiments and made discussions. All authors read and approved the final manuscript.
Funding
This work was supported by National Natural Science Foundation of China (61801476, 61971413, 61502426), National Key Research and Development Plan (2018YFC0116904, 2017YFC0114304, 2017YFB1103602), Scientific Research Equip-ment Program of Chinese Academy of Science (YJKYYQ20170050), Jiangsu Key Technology Research DevelopEquip-ment
(14)
β= HT
1
ε ˜ HH˜T
−1
T −C1 ε
˜ HH˜T
.
(15) β=HT
1
ε
˜
HH˜T+ 1
C
T− C1
ε
˜
HH˜T
.
(16)
f(x)=h(x)β=h(x)HT
1 ε ˜
HH˜T+ 1
C
−1
T− C1 ε
˜
HH˜T
.
(17) βkernel=
1
ε
˜
Ω+ 1 C
−1 T −C1
ε ˜ Ω . (18)
fkernel(x)=
K(x,x1)
.. .
K(x,xn)
× �1 ε ˜
Ω+ 1
C
�−1�
T− C1
ε ˜ Ω � . (19)
label(x)=arg max fj(x) j∈{1,...,m}
Program (BE2016613, BE2017675, BE2017663, BE2018610, BE2017664), Jiangsu Natural Science Foundation (BK20170387, BK20180221), Jiangsu Postdoctoral Research Program (2018K030A), Suzhou Industry Technological Innovation Projects (SYG201606, SYG201707), Suzhou Science and Technology Projects for People’s Livelihood (SS201866, SYS2018010, SS201854, SS201855), Suzhou Science and Technology Development Project (SZS201609, SZS201818), Lishui Key Tech-nology R&D Program (2019ZDYF17, 2019ZDYF09), SIBET Medical and TechTech-nology Project (Y853111305, Y853171305), SND Medical Plan Project (2016Z010, 2017Z005), Jinan Innovation Team (2018GXRC017).
Availability of data and materials
The datasets used and/or analyzed during the current study are available from the corresponding author on reasonable request.
Ethics approval and consent to participate
The study is approved by the Ethics Committee of the Third Affiliated Hospital of Soochow University.
Consent for publication
All subjects gave written informed consent in accordance with the Declaration of Helsinki.
Competing interests
The authors declare that they have no competing interests.
Author details
1 Shanghai Institute for Advanced Communication and Data Science, School of Communication and Information
Engi-neering, Shanghai University, Shanghai, China. 2 Suzhou Institute of Biomedical Engineering and Technology, Chinese
Academy of Science, Suzhou, Jiangsu, China. 3 Quantitative Medical Imaging Systems Group, Research Center for
Molec-ular and CellMolec-ular Imaging, Institute for Advanced Medical Technologies and Devices, Tehran University of Medical Sciences, Tehran, Iran. 4 The Affiliated Suzhou Science & Technology Town Hospital of Nanjing Medical University, Suzhou,
Jiangsu, China. 5 Suzhou Science & Technology Town Hospital, Suzhou 215153, Jiangsu, China. 6 Suzhou Key Laboratory
of Medical and Health Information Technology, Suzhou, China. 7 Nanjing Guoke Medical Engineering Technology
Devel-opment Co., Ltd, Nanjing, China. 8 Jinan Guoke Medical Engineering Technology Development Co., Ltd, Jinan, China.
Received: 27 July 2019 Accepted: 6 December 2019
References
1. Kearney PM, et al. Global burden of hypertension: analysis of worldwide data. Lancet. 2005;365(9455):217–23. 2. Nagai M, et al. Visit-to-visit blood pressure variations: new independent determinants for cognitive function in the
elderly at high risk of cardiovascular disease. J Hypertens. 2012;30(8):1556–63.
3. Cacciatore F, et al. The role of blood pressure in cognitive impairment in an elderly population. J Hypertens. 1997;15(2):135–42.
4. Gorelick PB, et al. Vascular contributions to cognitive impairment and dementia: a statement for healthcare profes-sionals from the American Heart Association/American Stroke Association. Stroke. 2011;42(9):2672–713. 5. Veglio F, et al. Hypertension and cerebrovascular damage. Atherosclerosis. 2009;205(2):331–41. 6. Elliott WJ, Black HR. Rationale and benefits of classification of hypertension severity. Curr Opin Cardiol.
1997;12(4):368–74.
7. Chobanian AV, et al. The seventh report of the Joint National Committee on Prevention, Detection, Evaluation, and Treatment of High Blood Pressure: the JNC 7 report. JAMA J Am Med Assoc. 2003;289(19):2560–72.
8. Ettehad D, Emdin CA, Kiran A, et al. Blood pressure lowering for prevention of cardiovascular disease and death: a systematic review and meta-analysis. Lancet. 2016;387(10022):957–67. https ://doi.org/10.1016/S0140 -6736(15)01225 -8.
9. Xie X, Atkins E, Lv J, et al. Effects of intensive blood pressure lowering on cardiovascular and renal outcomes: updated systematic review and meta-analysis. Lancet. 2015;387(10017):435–43. https ://doi.org/10.1016/S0140 -6736(15)00805 -3.
10. Whelton PK, et al. 2017 ACC/AHA/AAPA/ABC/ACPM/AGS/APhA/ASH/ASPC/NMA/PCNA guideline for the prevention, detection, evaluation, and management of high blood pressure in adults. J Am Coll Cardiol. 2017;71(19):213–21. 11. Vasan RS, et al. Assessment of frequency of progression to hypertension in non-hypertensive participants in the
Framingham Heart Study: a cohort study. Lancet. 2001;358(9294):1682–6.
12. Kuwako, et al. Voxel-based analysis of Tl-201 SPECT for grading and diagnostic accuracy of gliomas: comparison with ROI analysis. Ann Nucl Med. 2013;27(6):493–501.
13. Meurs M, et al. The associations of depression and hypertension with brain volumes: independent or interactive? Neuroimage Clin. 2015;8(S331):79–86.
14. Jennings J, et al. Regional grey matter shrinks in hypertensive individuals despite successful lowering of blood pres-sure. J Hum Hypertens. 2012;26(5):295.
15. Kennedy KM, Raz N. Pattern of normal age-related regional differences in white matter microstructure is modified by vascular risk. Brain Res. 2009;1297:41–56.
16. Dai W, et al. Abnormal regional cerebral blood flow in cognitively normal elderly subjects with hypertension. Stroke. 2008;39(2):349–54.
17. Romanowski CA, Wilkinson ID. Atrophy: when too much atrophy is too little brain. Neuroradiology. 2011;53(1):133. 18. Raz N, et al. White matter deterioration in 15 months: latent growth curve models in healthy adults. Neurobiol
• fast, convenient online submission •
thorough peer review by experienced researchers in your field • rapid publication on acceptance
• support for research data, including large and complex data types •
gold Open Access which fosters wider collaboration and increased citations maximum visibility for your research: over 100M website views per year •
At BMC, research is always in progress.
Learn more biomedcentral.com/submissions
Ready to submit your research? Choose BMC and benefit from:
19. Gianaros PJ, et al. Higher blood pressure predicts lower regional grey matter volume: consequences on short-term information processing. Neuroimage. 2006;31(2):754–65.
20. Zhou Y, et al. A primary study of diffusion tensor imaging-based histogram analysis in vascular cognitive impairment with no dementia. Clin Neurol Neurosurg. 2011;113(2):92–7.
21. Vapnik V, Vashist A. A new learning paradigm: learning using privileged information. Neural Netw. 2009;22(5):544–57.
22. Zhang PB, Yang ZX. A new learning paradigm for random vector functional-link network: RVFL+. 2017.
23. Huang GB, Zhu QY, Siew CK. Extreme learning machine: a new learning scheme of feedforward neural networks. In: IEEE international joint conference on neural networks. 2005.
24. Horata P, Chiewchanwattana S, Sunat K. Robust extreme learning machine. Neurocomputing. 2013;102(2):31–44. 25. Xiong H, Swamy MNS, Ahmad MO. Optimizing the kernel in the empirical feature space. 2005.
26. Zhe W, et al. Random projection ensemble learning with multiple empirical kernels. Knowl Based Syst. 2013;37(2):388–93.
27. Krzywinski M, Schein JI. Circos: an information aesthetic for comparative genomics. Genome Res. 2009;19(9):1639–45.
28. Elias MF, et al. Untreated blood pressure level is inversely related to cognitive functioning: the Framingham Study. Am J Epidemiol. 1993;138(6):353–64.
29. Alvarez JA, Emory E. Executive function and the frontal lobes: a meta-analytic review. Neuropsychol Rev. 2006;16(1):17–42.
30. Jennings JR, et al. Reduced cerebral blood flow response and compensation among patients with untreated hyper-tension. Neurology. 2005;64(8):1358–65.
31. Hajjar I, et al. Roles of arterial stiffness and blood pressure in hypertension-associated cognitive decline in healthy adults. Hypertension. 2015;67(1):171.
32. Li X, et al. Disrupted frontoparietal network mediates white matter structure dysfunction associated with cognitive decline in hypertension patients. J Neurosci Off J Soc Neurosci. 2015;35(27):10015.
33. Peng B, et al. Detection and analysis of T2DM biomarkers from brain MR images using BrainLab. In: 2014 7th interna-tional conference on biomedical engineering and informatics (BMEI). New York: IEEE; 2014.
34. Sled JG, Zijdenbos AP, Evans AC. A nonparametric method for automatic correction of intensity nonuniformity in MRI data. IEEE Trans Med Imaging. 1998;17:87–97. https ://doi.org/10.1109/42.66869 8.
35. Wang Y, et al. Knowledge-guided robust MRI brain extraction for diverse large-scale neuroimaging studies on humans and non-human primates. PLoS ONE. 2014;9(1):e77810.
36. Wang L, et al. 4D segmentation of brain MR images with constrained cortical thickness variation. PLoS ONE. 2013;8(7):e64207.
37. Thirion JP. Image matching as a diffusion process: an analogy with Maxwell’s demons. Med Image Anal. 1998;2:243– 60. https ://doi.org/10.1016/S1361 -8415(98)80022 -4.
38. Wu G, et al. S-HAMMER: hierarchical attribute-guided, symmetric diffeomorphic registration for MR brain images. Hum Brain Mapp. 2014;35(3):1044–60.
39. Li G, et al. Consistent reconstruction of cortical surfaces from longitudinal brain MR images. Neuroimage. 2012;59(4):3805–20.
40. Tzourio-Mazoyer N, et al. Automated anatomical labeling of activations in SPM using a macroscopic anatomical parcellation of the MNI MRI single-subject brain. Neuroimage. 2002;15(1):273–89.
41. Whitwell JL, et al. Normalization of cerebral volumes by use of intracranial volume: implications for longitudinal quantitative MR imaging. Am J Neuroradiol. 2001;22(8):1483.
42. Huilin X, Swamy MNS, Omair AM. Optimizing the kernel in the empirical feature space. IEEE Trans Neural Netw. 2005;16(2):460–74.
43. Huang GB, Zhu QY, Siew CK. Extreme learning machine: theory and applications. Neurocomputing. 2006;70(1):489–501.
Publisher’s Note