Mathematical Modeling for Volatile Organic Compounds Removal
in a Biofilter: Model Validation and Sensitivity Analysis
S. Ranjbar, A. Ghaemi∗
School of Chemical Engineering, Iran University of Science and Technology, Narmak, Tehran, Iran
Abstract
In this work, a dynamic model has been developed for prediction of biofilters performance. The model includes most of the phenomena occurring in a biofilter. For biodegradation of pollutants in the biofilm, the Michaelis-Menten kinetic has been considered. The model equations including gas phase and biofilm partial differential equations were solved simultaneously using finite difference and method of lines. The model parameters were evaluated by sensitivity analysis to determine their respective effects on the model performance. The model predictions were validated by experimental data for mixture of methyl propyl ketone, toluene, p-Xylene and n-Butyl acetate. The simulation results of empty bed residence times 30, 60, 90 seconds were compared with experimental data. The comparison of results showed the model predictions had a good agreement with experimental data. The sensitivity analysis of the model parameters showed that Henry's constant and specific area of biofilter had the strongest influence on biofilter performance.
Keywords: Biofilter, VOCs biodegradation, Mathematical modeling, Sensitivity nalysis
1. Introduction
In recent years, biofiltration has emerged as an efficient and reliable biological process for treatment of pollutants from contaminated air emissions. This technology has been successfully used to remove a wide range of pollutants such as volatile organic compounds (VOCs), ammonia and sulphurous compounds, etc. [1-2]. It could cost-effectively remove VOCs and odours from waste gas stream [3-5]. Biofiltration involves the passage of a polluted air stream through a packed bed containing
absorption-biodegradation theory [8]. Both steady-state and dynamic mathematical models have been developed to evaluate performance of biofilters. No single model has become a generally accepted standard; each research group has developed its own approach, often specific to the experiments being performed [9].
Modeling of biofilters for the biotreatment of volatile organic compounds in air began in the 1980s with the work of Ottengraf et al. by considering diffusion and biodegradation of pollutants in biofilms [8]. The kinetics of biodegradation of the single pollutants by the microorganisms on the biofilm was described by a Monod-type expression, assuming first or zero-order kinetics. While several models with increased degree of complexity were reported thereafter [10-12], the original model often has been used to represent biofiltration data [13].
Mathematical modeling of biofiltration systems is faced with the complexity of the physicochemical and microbiological phenomena involved in multiphase systems. Majority of the published models include parameters that were not measured independently by experimentation but were obtained by fitting experimental data, thus masking their real influence as they are generally lumped in the equations. These parameters often include the superficial transfer area, the biofilm thickness, the partition coefficient, the effective diffusivity and majority of the bio-kinetic parameters [14].
The aim of this work is to present a dynamic model to predict performance of biofilters. The equations for the mass transport and bioreactions within the biofilm phase and gas
phase and the accumulation of biofilms in this model were solved using finite difference and method of lines. The model predictions were validated by experimental data for mixture of MPK, Toluene, p-Xylene and n-Butyl acetate that were obtained from the literature [15]. The kinetic parameters of the model were determined using experimental data [15]. Also, sensitivity analysis of the model parameters was done to determine the biofilter significant parameters.
2. Model development
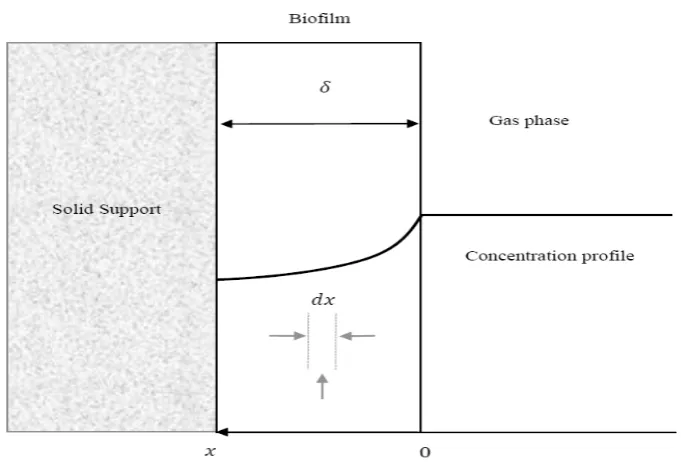
The model was built considering the most relevant phenomena occurring during the biofiltration process including convection, absorption, diffusion and biodegradation. The degradation of pollutants in the biofilter was described by a dynamic model based on mass balances. A schematic representation of the model is shown in Fig.1.
The following major assumptions are made in developing a mathematical model:
1. The flow pattern of the air stream through the filter bed is plug flow-type and the flow velocity remains constant. 2. Gas-biofilm interface equilibrium is
described by Henry’s law.
3. Diffusion in the biofilm is described by Fick’s law.
4. Planar geometry and perpendicular diffusion in biofilm are used to derive model equations considering that the solid support size is significantly higher than the biofilm thickness.
by monitoring a practically constant pressure drop and reactor weight in the whole studied operation period as shown in Maestre et al. [16].
6. Adsorption of pollutant onto the support is neglected due to the low pollutants concentrations.
Figure 1. Schematic diagram of biodegradation of pollutants in biofilm.
3. Mass balance of pollutant in the gas phase
Volatile organic compounds concentration in the gas phase can be assumed to be uniform in the column cross section. Model equation for the bulk gas phase in the dynamic state is shown in equation 1[24].
2 2
g g g s
g z
C C C A
D v N
t Z Z ε
∂ ∂ ∂
= − −
∂ ∂ ∂ (1)
N is the specific mass flux from gas phase to the biofilm phase for pollutant and it is given by Fick's law:
0
( b)
b x
C
N D
x =
∂ = −
∂ (2)
The interstitial gas velocity was calculated by considering the porosity of the reactor bed:
z Q v
Aε
= (3)
Where Cg is Concentration of pollutant in gas phase (g/m3), Dg is diffusion coefficient of pollutant in gas phase (m2/s), Z is axial direction (m), Q is flow of gas phase (m3/s),
is the concentration of pollutant in biomass (g/m3), x is the position in the biofilm from the surface (m) and vz is the interstitial gas velocity (m/s). Initial and boundary condition for gas phase equation (eq. 1) are:
at t =0,Cg =0 (4)
at Z =0,Cg =Cin (5)
at Z H, Cg 0
Z
∂
= =
∂ (6)
Where Cg in, is the concentration of pollutant in influent (g/m3) and H is the height of biofilter (m).
Average Absolute Relative Error (AARE) was used to determination the accuracy of the model:
1
100
% N t t
t t
A P
AARE
N = A
−
=
∑
(7)Where, At is experimental data Pt is predicted data and N is the number of data.
4. Mass balance of pollutant in the biofilm phase
Model equation for the biofilm under dynamic conditions contains diffusion term and biodegradation term [24]:
2 2
b b
b
C C
D r
t x
∂ = ∂ −
∂ ∂ (8)
Initial and boundary condition for biomass phase equation:
at 0,t = Cb =0 (9)
at x =0,Cg,interface =h C( b x) =0 (10)
at x , Cb 0
Z
δ ∂
= =
∂ (11)
The last boundary condition states that the concentration gradient at the biofilm/media interface is zero. It implies there is no mass transfer to the media and it, therefore, follows that the media is inert. Where
Cg,interface is interface concentration of
pollutant, h is the gas–liquid distribution coefficient given by Henry’s law and δ is biomass thickness (m).
5. Biodegradation kinetic expression
Several kinetic expressions have been used in
VOCs degradation by biofiltration such as zero or first-order kinetics depending on the pollutant concentration in the bio filter [8]. Haldane type kinetics has been also used for modeling interaction between pollutants during the biological degradation in the biofilm [17]. Currently, in the most works, the specific consumption rate for VOC
degradation is described by a Michaelis-Menten kinetic expression as it is used here:
max b
s b
r C
r
K C
× =
+ (12)
max
( ) / ln( / )
( / ln( / ))
in out in out
in out s
C C C C
r θ C C K
− =
− (13)
Where Cin is the concentration of pollutant in inlet and Cout is effluent concentration and is empty bed residence time (EBRT) (s). A plot of (Cin −Cout) / ln(Cin/Cout) versus
( / ln(θ Cin/Cout)) should correspond to a
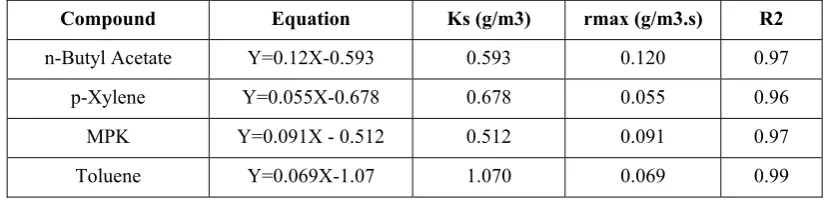
straight line, and Ks and rmax can be determined. In Fig. 2, for instance, the plot for toluene was presented. For the other Compounds, the results were presented in Table 1.
The model parameters and biofilter characteristics were presented in Table 2 and 3 respectively.
Figure 2. Plot of (Cin −Cout) / ln(Cin /Cout) vs. ( / ln(θ Cin/Cout)) for toluene.
Table 1. Biodegradation kinetics parameters for n-Butyl Acetate, p-Xylene, MPK, Toluene.
Compound Equation Ks (g/m3) rmax (g/m3.s) R2
n-Butyl Acetate Y=0.12X-0.593 0.593 0.120 0.97
p-Xylene Y=0.055X-0.678 0.678 0.055 0.96
MPK Y=0.091X - 0.512 0.512 0.091 0.97
Toluene Y=0.069X-1.07 1.070 0.069 0.99
Table 2. Model parameters value for simulating [15, 21].
Component Dg (m2/sec) Db (m2/sec) h (atm/mol. m3) Cin (g/m3)
n-Butyl acetate 7.3×10⁻⁶ 8×10⁻¹⁰ 2.57×10⁻⁴ 0.1
Toluene 8.7×10⁻⁶ 8.5×10⁻¹⁰ 6.35×10⁻³ 0.081
p-Xylene 7.7×10⁻⁶ 8.4×10⁻¹⁰ 5.15×10⁻³ 0.084
Table 3. Physical characteristics of biofilter [15].
Parameter value
As(m2/m3) 340
θ(s) 30 , 60 , 90
V(m3) 0.014
A(m3) 0.031
( )m
δ 13e-5
( / min)
Q lit 13.2 , 19.8 , 29.7
ε 0.65
H (m) 1
6. Numerical solution
The model equations including a set of partial differential equations of gas phase and biofilm were discretized in space along the bed height and biofilm thickness, respectively. The resulting sets of ordinary differential equations were solved using MATLAB in a home-made modeling environment using finite difference and method of lines. The algorism of equations solution was presented in Fig. 3.
7. Model validating
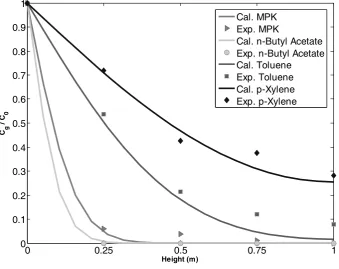
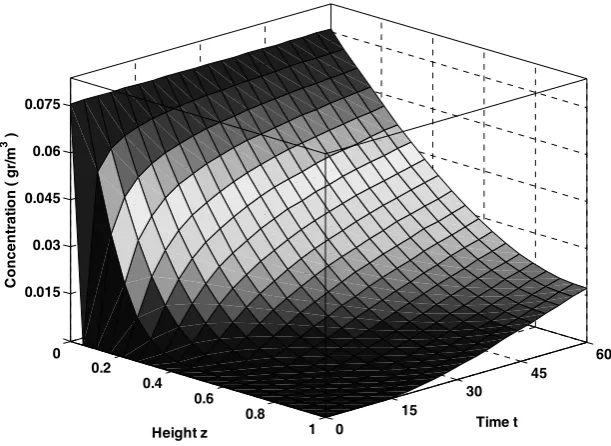
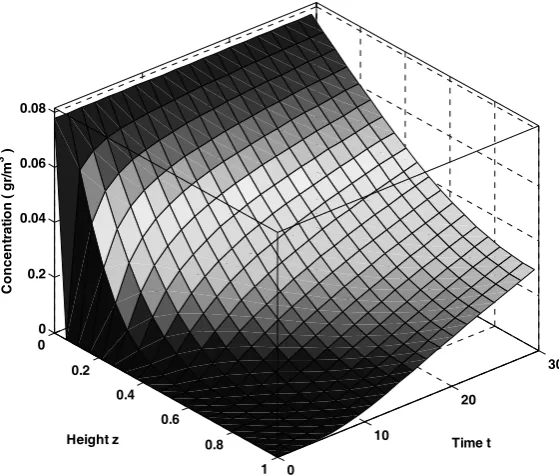
The simulation results were compared with experimental data for each of the VOCs [15]. In Figs 4 to 6, the predicted profiles of pollutants concentrations for 3 EBRTs of 90, 60, and 30 seconds were presented. Also, in order to better understand what happened in biofilter, in Figs. 7 and 8, toluene and p-xylene concentration at EBRT 60 sec was presented along the biofilter height and during time. The results showed that the model had good agreement with experimental data for MPK and n-butyl acetate whereas for p-xylene and toluene the model results deviated slightly from experimental data in shorter contact times of pollutants and bed. The figures showed that the model has better prediction of concentration profile for the longest EBRTs. Although for n-Butyl acetate, the results showed that for all of the EBRTs, the experimental data agreed with the model prediction completely.
Figure 3. the algorism of gas phase and biofilm equations solution.
Stage: 1
Component Balance equations (Gas phase)
Stage: 2
Component Balance equations (Gas phase)
Stage: 3 to N-1
Component Balance equations (Gas phase)
Stage: N
Component Balance equations (Gas phase)
Stage: 2
Component Balance equations (biofilm)
Stage: 3 to n-1
Component Balance equations (biofilm)
Stage: n
Component Balance equations (biofilm) ODE Function (Gas Phase)
Process inputs
Number of stages (discretization) Output of process
Biodegradation Kinetic (eq. 11)
Cg( t , z )
Cb( t , r )
ODE Function (Biofilm) Stage: 1
0 0.25 0.5 0.75 1 0
0.1 0.2 0.3 0.4 0.5 0.6 0.7 0.8 0.9 1
Height (m) Cg
/C0
Cal. MPK Exp. MPK
Cal. n-Butyl Acetate Exp. n-Butyl Acetate Cal. Toluene Exp. Toluene Cal. p-Xylene Exp. p-Xylene
Figure 4. pollutants concentrations profiles along the biofilter height for EBRT 90 s.
0 0.25 0.5 0.75 1
0 0.1 0.2 0.3 0.4 0.5 0.6 0.7 0.8 0.9 1
Height (m) Cg
/
C0
Cal. MPK Exp. MPK
Cal. n-Butyl Acetate Exp. n-Butyl Acetate Cal. Toluene Exp. Toluene Cal. p-Xylene Exp. p-Xylene
0 0.25 0.5 0.75 1 0
0.1 0.2 0.3 0.4 0.5 0.6 0.7 0.8 0.9 1
Height (m)
C g
/ C
0
Cal. MPK Exp. MPK
Cal. n-Butyl Acetate Exp. n-Butyl Acetate Cal. Toluene Exp. Toluene Cal. p-Xylene Exp. p-Xylene
Figure 6. pollutants concentrations profiles along the biofilter height for EBRT 30 s.
0 0.2
0.4 0.6
0.8
1 0
15 30
45 60 0.015
0.03 0.045 0.06 0.075
Time t Height z
C
oncent
rat
io
n (
gr
/m
3 )
0 0.2
0.4 0.6
0.8
1 0
10
20
30 0
0.2 0.04 0.06 0.08
Time t Height z
C
once
n
tr
at
io
n (
gr
/m
3 )
Figure 8. P-xylene concentrations along the biofilter height and time.
8. Sensitivity analysis of model parameters
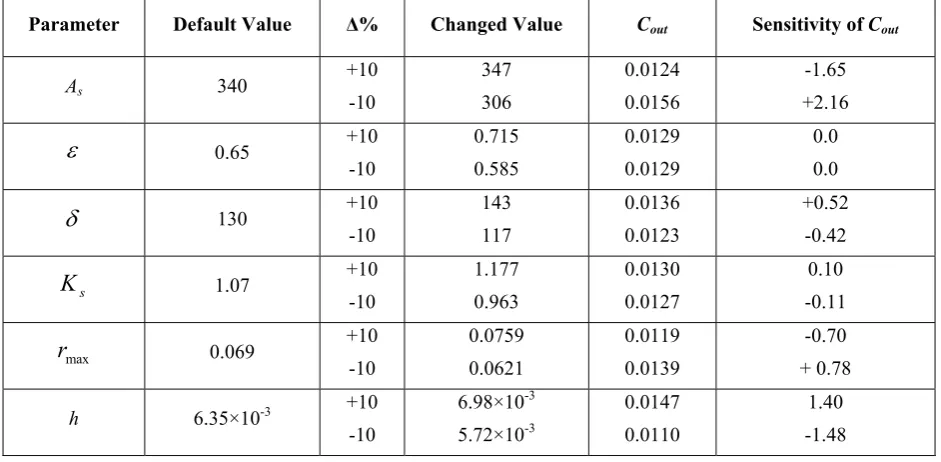
A sensitivity analysis of the model parameters was performed in order to determine their influence on the model predictions (Table 4). Sensitivity was assessed by increasing and decreasing 10% the values of the parameters in Tables 2 and 3 (the default parameters), and comparing the relative change of the state variables to a relative change of the value of the parameter according to the following expression:
/ /
d
d
Sensitivity
P P
Δω ω Δ
= (14)
Where Δω is the difference between the simulated variable under the new conditions
Table 4. Sensitivity analysis for the main parameters of the model.
Parameter Default Value Δ% Changed Value Cout Sensitivity of Cout
As 340
+10 -10 347 306 0.0124 0.0156 -1.65 +2.16
ε 0.65 +10
-10 0.715 0.585 0.0129 0.0129 0.0 0.0
δ 130 +10
-10 143 117 0.0136 0.0123 +0.52 -0.42 s
K 1.07 +10
-10 1.177 0.963 0.0130 0.0127 0.10 -0.11 max
r 0.069 +10
-10 0.0759 0.0621 0.0119 0.0139 -0.70 + 0.78
h 6.35×10⁻³ +10
-10 6.98×10⁻³ 5.72×10⁻³ 0.0147 0.0110 1.40 -1.48
Table 5. Comparison of present work with other works.
AARE% Pollutant Model Sensitive Parameters Degradation Kinetic Steady/ Unsteady Model Authors 18 Phenol max
r , h
Monod Steady
Spigno et. al.[25]
16 Toluene
As Haladene-type
Steady Liao et. al.[27]
23 Toluene
As, h Monod
Unsteady Dorado et. al.[26]
10 21 Ethyl acetate
Toluene
ε, Y
Haladene-type Unsteady
Alvarez et. al.[9]
14 Butyl acetate
As, Y , EBRT
Monod Steady
Lu et. al.[23]
20 Ammonia
As, δ , Y Haladene-type
Unsteady Baquerizo et. al.[22]
11 12 4 2 Xylene Toluene MPK nBA
As, h, rmax Monod
Unsteady Present work
9. Conclusions
In this work, a dynamic model was developed for prediction of biofilter performance. The model simulation has been proven suitable in describing the gas concentration profiles within the bed for the biofiltration of methyl propyl ketone, toluene, p-xylene and n-butyl acetate as a mixture over different EBRTs conditions. The main differences between the
influence on the performance of biofilter versus other parameters. The complete degradation of MPK and n-butyl acetate in lower height of biofilter occurred because of having more solubility in water. This result also was obtained in sensitivity test, in which henry's constant has strong influence on degradation.
Nomenclature
A
s [m2/m3] Specific surface areaε [ــــ] Bed porosity
δ [m] Biofilm thickness s
K [g/m3] Half-saturation
constant
max
r [g/m3S] Maximum rate of degradation
h [atm/mol.m3] Henry's constant H [m] Bio filter height Q [m3/s] Flow of gas phase A [m2] Cross section area of
bio filter
V [m3] Volume of bio filter
θ [s] Empty bed residence time (EBRT)
Dg [m2/s] Diffusion coefficient
of pollutant in gas phase
Db [m2/s] Diffusion coefficient
of pollutant in biomass Cin [g/m3] Concentration of
pollutant in input
Cout [g/m3] Concentration of
pollutant in effluent
Cb [g/m3] Concentration of
pollutant in biomass
Cg [g/m3] Concentration of pollutant in bio filter
N [g/m3S] Specific mass flux x [m] Position in the biofilm Z [m] Axial direction
vz [m/S] Interstitial gas velocity
Y
[g/g biomass] Microbal yield coefficientReferences
[1] Groenestijn, V. and Kraakman, J.W.,
"Recent developments in biological waste gas purification in Europe", Chem. Eng. J., 113, 85, (2005).
[2] Delhomenie, M.C. and Heitz, M., "Biofiltration of air: a review", Crit. Rev. Biotechnol., 25, 53, (2005).
[3] Wang, Q., Tian, S. and Xie, W., "Treatment of mix gas containing butyl acetate, n-butyl alcohol and phenylacetic acid from pharmaceutical factory by bio-trickling filter", Chin. J. Environ. Sci., 26, 55, (2005).
[4] Liu, Y., Quan, X. and Sun, Y., "Simultaneous removal of ethyl acetate and toluene in air streams using compost-based biofilters", J. Hazard. Mater., 95, 199, (2002).
[5] Zhu, X., Suidan, M.T. and Pruden, A., "Effect of substrate Henry’s constant on biofilter performance", J. Air Waste Manag. Assoc., 54, 409, (2004).
[6] Deviney, J.S., Deshusses, M.A. and Webster, T., Biofiltration for air pollution control, Lewis Publishing Inc., New York, (1999).
[7] Sun, P., Huang, B. and Huang, R., "Kinetic model and simulation of the adsorption-biofilm theory for the process of biopurifying VOC waste gases", Chin. J. Environ. Sci., 23, 14, (2002).
[8] Ottengraf, S.P.P. and Oever, V., "Kinetics of organic compoundremoval from waste gases with a biological filter", Biotechnol Bioeng, 25, 3089, (1983).
[9] Hornos, F., Gabaldn, C., Soria, V., Marzal, P. and Penya-roja, J., "Mathematical modeling of the biofiltration of ethyl acetate and toluene and their mixture", Biotechnol. Eng. J., 43, 169, (2009).
[10] Shareefdeen, Z.M., Development of a biofilter media for removal of hydrogen sulphide, Global NEST J., 11, 218, (2009).
biotreatment: Dynamic model development", Environ. Sci. Technol., 29, 1048, (1995).
[12] Devinny, J.S., Deshusses, M.A. and Webster, T.S., Biofiltration for air pollution control, Lewis Publishers, (1999).
[13] Abumaizar, R.J., Smith, E.H. and Kocher, W., "Analytical model of dual-media biofilter for removal of organic air pollutants", J. Environ. Eng., 123, 606, (1997).
[14] Aizpuru, A., Malhautier, L. and Fanlo, J.L., "Quantitative structure-activity relation-ship modeling of biofiltration removal", J. Environ. Eng., 128, 953, (2002).
[15] Park, J.S., Biodegradation of paint VOC mixtures in biofilters, Thesis, Doctor of Philosophy in Engineering, the University of Texas at Austin. Research Supervisor: Dr. A. Kinney, (2004).
[16] Maestre, J.P., Gamisans, X., Gabriel, D. and Lafuente, J., "Fungal biofilters for toluene biofiltration: Evaluation of the performance with four packing materials under different operating conditions", Chemosphere, 67, 684, (2007).
[17] Morales, M., Hernandez, S., Cornabe, T., Revah, S. and Auria, R., "Effect of drying on biofilter performance: Modeling and experimental approach", Environ. Sci. Technol., 37, 985, (2003). [18] Valsaraj, K.T., Elements of environ-mental engineering: Thermodynamics and kinetics. Lewis Publishing Inc., New York, (1995).
[19] Chan, W.C. and Lai, T.Y., "Compounds interaction on the biodegradation of acetone and methyl ethyl ketone mixture in a composite bead bio filter", Bioresource Technol., 101, 126, (2010).
[20] Chan, W.C. and Peng, K.H.,
"Biofiltration of ketone compounds by a composite bead biofilter", Bioresource Technol., 99, 3029, (2008). [21] Pankow, J.F., Johnson, R.L. and
Cherry, J.A., "Air sparging in gate wells in cutoff walls and trenches for control of volatile organics", Ground Water, 31, 654, (1993).
[22] Baquerizo, G., Maestre, J.P., Sakuma, T., Deshusses, A., Gamisans, X., Gabriel, D. and Lafuente, J., "A detailed model of a biofilter for ammonia removal: Model parameters analysis and model validation", Chem. Eng. J., 113, 205, (2005).
[23] Lu, C., Chang, K., Hsu, Sh. and Lin, J., "Biofiltration of butyl acetate by a trickle-bed air biofilter", Chem. Eng. Sci., 59, 99, (2004).
[24] Anil Kumar, R., Shashi Bala, M. and Majumder, C., "Modelling and computa-tional fluid dynamic behavior of a biofilter treating benzene", Bioresource Technol., 125, 200, (2012). [25] Spigno, G., Zilli, M. and Nicolella, C.,
"Mathematical modelling and simulation of phenol degradation in biofilters", Biochem. Eng. J., 19, 267, (2004).
[26] Dorado, A.D., Baquerizo, G., Maestre, J.P., Gamisans, X., Gabriel, D. and Lafuente, J., "Modeling of a bacterial and fungal biofilter applied to toluene abatement: Kinetic parameters estimation and model validation", Chem. Eng. J., 140, 52, (2008).
![Table 3. Physical characteristics of biofilter [15].](https://thumb-us.123doks.com/thumbv2/123dok_us/8887635.1823349/6.595.73.527.472.730/table-physical-characteristics-of-biofilter.webp)