Designs: A Case Study
Abstract
A proposed design for the American Society of Clinical Oncology (ASCO) Web site was evaluated against the original design in terms of the ease with which the right starting points for key tasks were located and processed. This report focuses on the eye tracking methodology that accompanied other conventional usability practices used in the evaluation.
Twelve ASCO members were asked to complete several search tasks using each design. Performance measures such as click accuracy and time on task were supplemented with eye movements which allowed for an assessment of the processes that led to both the failures and the successes.
The report details three task examples in which eye tracking helped diagnose errors and identify the better of the two designs (and the reasons for its superiority) when both were equally highly successful. Advantages and limitations of the application of eye tracking to design comparison are also discussed.
Keywords
Eye tracking, design evaluation, design comparison, visual search, case study
Permission to make digital or hard copies of all or part of this work for personal or classroom use is granted without fee provided that copies are not made or distributed for profit or commercial advantage and that copies bear this notice and the full citation on the first page. To copy otherwise, or republish, to post on servers or to redistribute to lists, requires prior specific permission and/or a fee. Copyright 2006, UPA.
Agnieszka Bojko
User Centric, Inc.
2 Trans Am Plaza Dr Ste 105 Oakbrook Terrace, IL 60181 USA
Introduction
We were asked by the American Society of Clinical Oncology to improve the information architecture of the ASCO.org Web site (Figure 1). The Web site contains a wealth of information on research, meetings, training, technology, and government policies that are of interest to oncologists. The primary goal of the redesign was to improve the ease with which this information and key functionality could be found on the Web site.
Based on previous user research and usability analysis conducted on the ASCO Web site, stakeholder inputs, and Web design best practices, a new information architecture was proposed (Figure 2). The Web site’s content was reorganized and renamed as a result of a card sort activity conducted with users in an earlier phase of the project. Information categories were repositioned on the page based on their importance, frequency of use, and relatedness. Additional navigational elements were added, allowing for easier access to information that was buried too deeply in the original structure.
To validate the redesign, we conducted a series of evaluation activities including an eye tracking study. The specific goals of the eye tracking study were to assess whether the redesigned home page would make it easier for users to locate the right starting point for their tasks, and
to help determine any potential areas for improvement within the proposed design.
Eye tracking has been successfully used in perception and visual search research (e.g., Findlay & Golchrist, 2003) as well as human factors (e.g., Duchowski, 2003; Wickens & Hollands, 2000) for many years. However, it has not yet established itself strongly as a method to study the screen-level search behavior* that is a
frequent component of human-computer interaction. Combined with conventional techniques that gather data based on users’ overt behavior (e.g., mouse clicks), eye tracking provides another layer of insight into how users process the visual information to which they respond when interacting with systems.
To find the correct link, button, or another control on a Web page, users must successfully complete two stages of visual search: (1) deployment of attention and (2) target processing (Bojko & Stephenson, 2005). In the first stage, attention needs to be allocated to the target, so the target can be processed. Effectiveness and efficiency of this stage depends on how easy the target is to notice, which is affected by the overall display layout as well as the location and visual presentation of the target and other elements.
During the second stage of visual search, target processing, users’ attentional resources are allocated to
* ‘Search’ in human-computer interaction can have at least two
meanings: one that involves using a search box and the other that is related to visual search (i.e., looking for a target element on the screen). This paper focuses on the latter meaning of ‘search’, calling it ‘screen-level search’.
Figure 2. Proposed redesign of the ASCO home page.
recognizing the meaning of the target and its relationship with their goal. Completion of this stage depends on how easy the target is to comprehend, which is related to the target’s content (e.g., label) and affordances (e.g., whether it appears clickable or not). Only upon successful completion of both search stages, can users select the correct target.
The focus of the study was to research and compare users’ visual search behavior on the original ASCO home page and its redesigned version with regard to the key targets (such as links to information on conferences or ASCO membership). Two types of data were collected: behavioral data (location of mouse clicks and time on task) and eye movement data (number and location of fixations of at least 100 ms).
The contribution of the eye tracking measures can be twofold. First of all, they make it possible to compare two successful searches in terms of their efficiency. The more efficient search requires fewer fixations (Kotval & Goldberg, 1998), indicating a more efficient attention deployment stage. In addition, the search target in an efficient search is selected upon users’ initial gaze (i.e., once users look at it, they recognize it as the target) rather than being revisited multiple times, which indicates an efficient target processing stage.
Eye tracking also helps uncover likely causes of failed searches. If the target was fixated during an unsuccessful search at least once, failure at the target processing stage occurred – users saw the target but did not realize its meaning or relevancy to their goal. If the target was never fixated, however, attention deployment failed – users simply never noticed it (Bojko & Stephenson, 2005; Schiessl, Duda, Thölke & Fischer, 2003).
The combination of measures used in this study (i.e., clicks and fixations) allowed us not only to determine which of the ASCO home page designs – the original or the proposed – led to more successful searches, but also to understand what went on while users were looking for the targets and, based on these insights, make recommendations.
Method
ParticipantsTwelve participants ranging in ages from 30 to 55 were recruited at the 2005 ASCO Annual Meeting in Orlando, FL. All were members of ASCO and reported using the ASCO Web site on average once a month.
Apparatus
The tasks and stimuli were displayed on a 17” monitor with screen resolution set to 1024 x 768 pixels. Participants used a mouse to indicate responses. Eye movements were recorded with a Tobii 1750 eye tracker (Figure 3).
Procedure
Participants were asked to perform tasks using both the original and proposed home page designs. Each participant completed two blocks of 25 tasks, one block per design. The blocks consisted of the same set of tasks presented in a random order. To compensate for learning effects between the two stimuli, block order was counterbalanced across participants, with a 20-minute unrelated exercise separating the two blocks. Each task began with instructions (e.g., “Find information on FDA drug approvals”) that were displayed until the participant clicked on the Go button. Each task also corresponded to and was representative of a specific target on the home page (either a link or a Figure 3. Tobii 1750 binocular
remote eye tracker with sampling rate of 50Hz and 0.5° spatial resolution. The tracking hardware is fully integrated into the monitor and, by being almost invisible to the users, has little impact on the ecological validity of the studies.
MINI-DICTIONARY
Fixation – relatively stationary eye position over an object lasting from ~50 to ~500 ms
Saccade – rapid eye movement from one location to another
Scanpath – spatial & temporal arrangement of a sequence of fixations
button) that needed to be selected in order for the task to be completed successfully.
Once the ASCO home page appeared, the participant would click on the element that he/she would expect to lead to the successful completion of the task. Upon clicking, instructions for the next task were displayed. Since all participants were somewhat familiar with the original Web site, to avoid any surprise effects, they had an opportunity to familiarize themselves with the new design before the eye tracking study began.
Findings and Discussion
Overall, the original and proposed designs did not significantly differ at the .05 level in terms of efficiency (average time on task: 4.1 s and 4.4 s, respectively) and accuracy (percentage of correct clicks: 71% and 69%, respectively). However, several differences in accuracy were observed on a per task basis, such that the tasks could be divided into three groups:
A.
Tasks with similar accuracy levels with both designs (13 tasks)B.
Tasks where a substantially higher accuracy wasachieved using the original design (5 tasks)
C.
Tasks where the proposed design led to higheraccuracy (7 tasks).
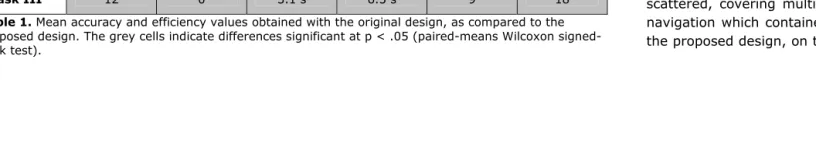
In our eye movement analysis, we attempted to explain the differences in accuracy in task groups B and C, and to identify any potential differences where none were detected with the accuracy measure in task group A. To present our analysis in sufficient detail, we will focus on three representative tasks that show a wide spectrum of the contributions of eye tracking to the study. Two of these tasks achieved perfect or almost perfect success rates with both designs, while in one the proposed design was far less successful than the original. Table 1 summarizes the search accuracy and efficiency results for all three tasks.
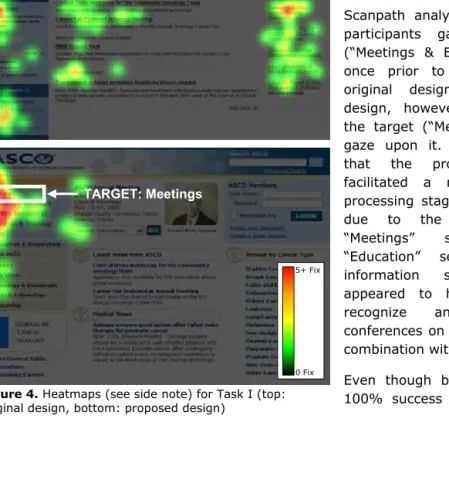
TASK I: Find a list of upcoming conferences (Figure 4) All participants selected the intended targets using both designs. The time on task data indicated that the proposed design facilitated faster search (1.1s) than the original design (2.4s). This statistically significant difference (p < .05) could be attributed to the number of fixations that it took for the participants to find and select the target. While the original design required an average of seven fixations, the proposed design reduced this number to three (p < .05). The distributions of these fixations in Figure 4 illustrate what happened during search.
Conference information is one of the main content areas on the ASCO Web site that users should be able to access immediately, without having to scan the entire page. However, fixations on the original design were scattered, covering multiple areas besides the left side navigation which contained the target. Most fixations in the proposed design, on the other hand, concentrated in ACCURACY
# participants who selected correct target
OVERALL EFFICIENCY
Time on task SEARCH EFFICIENCY # fixations prior to selection
original
design proposed design original design proposed design original design proposed design
Task I 12 12 2.4 s 1.1 s 7 3
Task II 10 12 7.4 s 1.7 s 21 5
Task III 12 0 3.1 s 6.5 s 9 18
TARGET: Meetings & Education
TARGET: Meetings
Figure 4. Heatmaps (see side note) for Task I (top: original design, bottom: proposed design)
5+ Fix
0 Fix
the upper (blue) portion of the left side navigation, where all the key links were located. This indicates that the proposed design was more efficient at the attention deployment stage in a search for the particular target. A likely cause of the increase in efficiency was the removal of page elements that act as distractors, often pulling users’ attention in many different directions. For example, in the proposed design, the top navigation links were combined with the other navigational items to form a single main navigational area, thus reducing the number of elements competing for attention.
Scanpath analysis revealed that four participants gazed on the target (“Meetings & Education”) more than once prior to its selection in the original design. In the proposed design, however, everyone selected the target (“Meetings”) on their first gaze upon it. This finding suggests that the proposed design also facilitated a more efficient target processing stage of the search, likely due to the separation of the “Meetings” section from the “Education” section in the new information structure. “Meetings” appeared to have been easier to recognize and associate with conferences on its own, rather than in combination with “Education”.
Even though both designs yielded a 100% success rate in this task, the
proposed design required fewer fixations overall and fewer gazes on the target to complete the task, thus exhibiting higher efficiency at both stages of search: attention deployment and target processing.
TASK II: Join ASCO (Figure 5)
Accuracy in this task was high for both home page versions – ten participants made a correct selection in the original design and all twelve in the proposed design. Scanpath analysis of both designs revealed that when the target was selected, it was selected upon the participants’ first gaze on it, suggesting that it was recognized as soon as it was noticed. Hence, no differences between the designs were noted at the target processing stage.
A large difference in efficiency was observed at the attention deployment stage, however, with the original home page requiring 21 fixations and 7.4s for the search to be completed, and the proposed home page requiring only five fixations and 1.7s (p < .05). What led to this significant improvement was most likely the relocation of the target control relative to other elements (its absolute location remained almost the same) in addition to a change in graphic treatment. In the original design, the “Become a Member” control appeared separate from the other navigation and similar to the non-functional divider between the main navigation and the membership area. When scanning the page, users tended to focus on those two areas, while avoiding direct fixations on the “dividers”. Eventually, they would start a more systematic search, which would bring them to the target. In the proposed design, the “Membership” link became a part of the main navigation, which was consistent with user expectations and made it much easier to find.
This is another example where users chose the right starting point for their task using both designs, but the designs were not equally “good”. What distinguished them from each other was not the effectiveness of search, but the efficiency at the attention deployment stage. The search targets, while easy to understand and correctly selected when noticed, differed in terms of the
ease with which they were noticed. TASK III: Find ASCO’s position statements (Figure 6)
Unlike in Tasks I and II, the two home page versions in this task had different success rates, with the original design leading to 100% accuracy and the proposed one to 0%. To make recommendations, we had to determine the cause of this drop. Our improvement suggestions were to be based on the combined learnings from both the successful and unsuccessful designs in each task.
The distribution of fixations on the proposed home page indicates that participants conducted a thorough search of the left-side navigation before making their (incorrect) selection. Participants made an average of 18 fixations and spent 6.5 s on that page, as compared to the nine fixations and 3.1s on the original design (p < .05).
During the task, the target in the proposed design (“Practice Resources”) was gazed upon twice on
average, which made it likely to be registered. However, the participants did not select the target because they failed to either comprehend its meaning or realize its relationship to the task. The link that was eventually selected by most (nine) users was “Legislative & Regulatory” located right below the target.
These findings indicate that the position statements users were looking for were more strongly associated with regulations and policies than with resources. Although all users were able to find the target under “Policy & Practice” in the original design, changing “Practice Resources” back to “Policy & Practice” was not recommended. The original category encompassed two distinctive types of content and dividing it into “Legislative & Regulatory” and “Practice Resources” in the proposed design proved to be very effective for many other tasks. Instead, we suggested moving position statements to the “Legislative & Regulatory” section to better meet user expectations.
The targets in both designs were noticed by all users. The search failure that was noted in the proposed design occurred at the target processing stage due to a mismatch between user expectations and the categorization of information.
Conclusion
Most tasks that users attempt when interacting with interfaces include visual search components, requiring that users locate correct controls and information on the display. The outcomes of these searches, such as time and accuracy, are easy to determine using conventional testing techniques. It is, however, far more challenging to examine the process that led to these outcomes. Most methods that can provide us with process-related TARGET: Membership
Figure 5. Heatmaps illustrating the distribution of fixations for Task II (top: original design, bottom: proposed design)
TARGET: Become a Member
5+ Fix
information are limited. For example, mouse movements are an impoverished source of data (users process a lot more information than indicated by the areas visited with the cursor), user self-reports are often biased or incomplete (people are rarely fully conscious of their attention shifts), and brain activity is impractical to observe in user experience studies.
Eye movement data are fairly reliable (i.e., most of the time people focus their attention where they are looking – Liversedge & Findlay, 2000) and easy to collect without sacrificing ecological validity of the study. They provide a more complete picture of the interaction by filling in the gaps between observable events (e.g., scrolling, clicking, typing) with information on attentional processes (Richardson & Spivey, 2004).
In a design vs. redesign comparison, the general role of eye tracking is to determine whether or not the new interface is better, not just in terms of the most apparent outcomes but also the process, and why. By evaluating the efficiency of the search process, eye tracking in the present study provided an additional quantitative measure (number of fixations) to support the time on task data in identifying a better design in a situation in which both designs produced equally high success rates (Tasks I and II).
While the number of fixations tends to be correlated with time on task, the unique value of eye tracking lies in the qualitative eye movement analysis. The time measure reflects the overall task efficiency but it does not provide any indication as to why the efficiency was low (or high). By knowing where users looked at any given time during search, we can pinpoint the reasons for any inefficiencies or even search failures.
In our study, the qualitative analysis of users’ eye movements helped identify issues at two stages of search: deployment of attention (Tasks I & II) and target processing (Tasks I and III). This diagnosis allowed us to determine the changes that made (or would make) the proposed design more successful, such as improving information categorization (Tasks I and III), removing distractors (Task I), or modifying graphic treatment and/or location of an element (Task II).
These benefits of using eye tracking for the diagnosis of the underlying causes of search problems were noted for 17 out of the 25 tasks that were administered in the study. The remaining eight tasks did not differ in terms of accuracy, time on task, and scanpath efficiency between the two designs, and eye tracking data merely supported the more conventional performance measures.
Based on the results of the eye tracking study for all 25 tasks and other evaluation activities, we determined that overall, the proposed design better meets user needs and expectations. We also made suggestions addressing the elements of the proposed design that did not improve or negatively affected the user experience. Because changing the appearance, location, or content of one element can easily affect other elements, all recommendations were made in consideration of the TARGET: Policy & Practice
TARGET: Practice Resources
5+ Fix
0 Fix
entire display. While not always feasible, it would be ideal for the re-redesign to be tested again to ensure that the implemented changes improved the user experience where intended without disrupting other areas of the interface.
The limitations of the eye tracking method include additional resource requirements, such as the relatively high cost of equipment and increased preparation and analysis time. It is thus important to ensure that the use of eye tracking is justified by the process-related questions of the study, as not all user experience research requires such fine-grained analysis (Bojko, 2005).
Another limitation involves having to study two or more interfaces to obtain best results. Because there are no absolute standards for eye movements in human-computer interaction, the data collected with one interface needs to be evaluated relative to the data collected with another. An additional constraint to keep in mind is that eye movement measures on their own have a limited applicability in user experience research (studies where eye tracking can answer all the questions are not very common), and should almost always be used in combination with other measures, including behavior and user attitudes/preferences.
We presented an example of how eye tracking can be used to supplement other techniques to compare and improve interfaces. Integrating data collected using different techniques is always a challenge, especially when one of the methods involves a different modality and has a potential that has not yet been fully uncovered in the field of user experience. We hope that this report provided an insight into why and how to conduct this integration.
Practitioner’s Take-Aways
There are a few practical implications of the above case study and discussion:
• One of the ways eye tracking can benefit user experience research is by providing additional measures that help compare alternative designs of the same interface.
• Time on task and error rate do not always tell the whole story. Eye movements help reveal the process, often not fully conscious, that led to these observable outcomes.
• Eye tracking should be used when a detailed evaluation of visual search is required to make recommendations. The number of times the target was looked at and the number of fixations prior to the first fixation on the target provide information about the attention deployment stage of search (Did users see the target? Did they have trouble locating it?) and about the target processing stage (Did users have difficulties comprehending the target?).
Acknowledgements
Special thanks to Bernie Khoo and Robert Schumacher for making this study possible, and to Amy Quinn and Catherine Gaddy for help with data collection.
References
Bojko, A. (2005). Eye Tracking in User Experience Testing: How to Make the Most of It. Proceedings of the 14th Annual Conference of the Usability Professionals
Association (UPA). Montréal, Canada.
Proceedings of the 11th International Conference on
Human-Computer Interaction (HCII). Las Vegas, NV.
Duchowski, A. T. (2003). Eye Tracking Methodology: Theory and Practice. London: Springer-Verlag.
Findlay, J. M. & Golchrist, I. D. (2003). Eye Movements in Visual Search (pp. 112 – 128). In: Active vision: Psychology of looking and seeing. Oxford: OUP.
Kotval, X. P. & Goldberg, J. H. (1998). Eye Movements and Interface Components Grouping: An Evaluation Method. Proceedings of the 42nd Annual Meeting of the
Human Factors and Ergonomics Society (HFES). Chicago, IL.
Liversedge, S. P. & Findlay, J. M. (2000). Saccadic Eye Movements and Cognition. Trends in Cognitive Sciences, Vol. 4, No. 1.
Richardson, D. & Spivey, M. (2004). Eye tracking: Research areas and applications. In G. Wnek & G. Bowlin (Eds.) Encyclopedia of Biomaterials and
Biomedical Engineering. (pp. 573-582). New York:
Marcel Dekker, Inc.
Schiessl, M., Duda, S., Thölke, A., & Fischer, R. (2003). Eye Tracking and Its Application in Usability and Media Research. MMI-Interaktiv, No 6.
Wickens, C. D. & Hollands, J. G. (2000). Engineering
psychology and human performance. Upper Saddle
River, NJ: Prentice-Hall.