University of New Orleans University of New Orleans
ScholarWorks@UNO
ScholarWorks@UNO
University of New Orleans Theses and
Dissertations Dissertations and Theses
5-20-2005
Environmental Performance of Copper Slag and Barshot as
Environmental Performance of Copper Slag and Barshot as
Abrasives
Abrasives
Sandhya Naidu Potana
University of New Orleans
Follow this and additional works at: https://scholarworks.uno.edu/td
Recommended Citation Recommended Citation
Potana, Sandhya Naidu, "Environmental Performance of Copper Slag and Barshot as Abrasives" (2005). University of New Orleans Theses and Dissertations. 242.
https://scholarworks.uno.edu/td/242
This Thesis is protected by copyright and/or related rights. It has been brought to you by ScholarWorks@UNO with permission from the rights-holder(s). You are free to use this Thesis in any way that is permitted by the copyright and related rights legislation that applies to your use. For other uses you need to obtain permission from the rights-holder(s) directly, unless additional rights are indicated by a Creative Commons license in the record and/or on the work itself.
ENVIRONMENTAL PERFORMANCE
OF
COPPER SLAG AND BARSHOT AS ABRASIVES
A Thesis
Submitted to the Graduate Faculty of
University of New Orleans
in partial fulfillment of the
requirements for the degree of
Master of Science
in
Environmental Engineering
by
Sandhya Naidu Potana
B. TECH (Civil) Jawaharlal Nehru Technological University, 2001
i
ACKNOWLEDGEMENTS
I would like to take this opportunity to thank several individuals for their help and contributions to the completion of this thesis.
First of all, my greatest gratitude to GOD, for my subsistence and success in my life.
I would like to express my gratitude to my advisor Dr. Bhaskar Kura for his generous, prompt, and patient guidance and instruction in the preparation of this document and the completion of my degree requirements. Dr. Kura has given me advice, support, and has provided me with a source of motivation since the beginning of my thesis
I would also thank Dr. Kenneth McManis and Dr. Gianna Cothren for serving on my Graduate Examining Committee.
Many thanks go to Mr. Byron Landry, Technician of the Civil and Environmental Engineering Department. Without his support, patience, and help, it would have been a tough job to complete this research.
Many thanks to the staff of the Civil and Environmental Engineering Department, especially to Juana, who were helpful in solving the problems I experienced from day to day.
ii
Sivaramakrishnan and Mr. Xavier for their help and cooperation throughout my project.
iii
TABLE OF CONTENTS
LIST OF TABLES
... vLIST OF FIGURES
... viLIST OF ABBREVIATIONS
...ixABSTRACT
...x1. INTRODUCTION
...11.1 Applications of Abrasive Blasting...2
1.1.1 Surface preparation:...2
1.1.2 Surface cleaning and finishing:...3
1.1.3 Shot Peening:...3
1.2 Principle of Abrasive Blasting: ...4
1. 3 Need for the Research...4
1.4 Research Objectives...6
2. BACKGROUND OF THE STUDY
...82.1 Sources and Applications of Copper Slag ...11
2.1.1 Sources of Copper Slag:...11
2.1.2 Applications:...12
2.2 Sources and Applications of Barshot...12
2.21 Sources of Bars...14
2.2.2 Applications...14
3. OBJECTIVES OF STUDY
...154. EQUIPMENT AND MATERIALS
...174.1 Test Chamber Design and Construction...17
4.2 Blasting Equipment (Blastpot) ...19
4.3 Compressor ...20
4.4 Exhaust Duct ...21
4.5 Stack Sampling Equipment...23
iv
4.7 Schmidt Valve...25
4.8 Sampling Train ...26
4.9 Particulate Collection System ...27
4.10 Test Constraints...28
5. FIELD TEST PROCEDURE
...305.1 Important Variables Monitored...31
5. 2 Surface Preparation Standards ...32
5.2.1 SP-5 SPC Standards ...34
5.2.2. A White Metal Blasting Cleaning SSPC SP- 5 Definition... 34
5.2.3. B Commercial Blast Cleaning SSPC SP- 6 Definition... 34
5.2.4. C Brush-off Blast Cleaning SSPC SP- 7 Definition ...34
5.2.5. D Near-White Blast Cleaning SSPC SP- 10 Definition...34
6. RESULTS AND ANALYSES
...707. CONCLUSIONS
...708. RECOMMENDATIONS
...729. BENEFITS
...7310. REFERENCES
...74v
LIST OF TABLES
Table S1: Field Data for Copper Slag ...38
Table S2: Productivity, Consumption and Emission Factors for Copper Slag...39
Table S3: Field Data for Barshot...40
Table S4: Productivity, Consumption and Emission Factors for Barshot ...41
Table S5: Minimum Emissions at Maximum Productivity...42
Table S6: Absolute* Minimum Emissions...43
Table A1. Annual Usage Data for various abrasives in United States ...76
Table A2 State wise data availability for different abrasives ...77
Table A3 Physical Properties of Blasting Abrasives...78
Table A4 NIOSH RELs, OSHA PELs, & ACGIH TLVs for Blasting Abrasive Ingredients ...79
Table A5: Range of Prices for Abrasives in 1997...82
Table A6: Applications of Abrasives...83
Table A7: Toxicology Rating for Abrasives ...85
Table C1 Field observations during stack sampling...92
Table C2 Stack Calculations...94
vi
LIST OF FIGURES
Figure 1: Copper Slag and major blasting application using Copper Slag ...12
Figure 2: Specular Hematite/Barshot ...13
Figure 3: Blasting using silica based abrasive / Using Barshot (dust free)...14
Figure 4: Emission test facility at UNO...18
Figure 5: Complete Assembly of the Test Facility ...18
Figure 6: Schematic Diagram of Blastpot...19
Figure 7: Blast pot; Hose with nozzle holder; Respirator, air purifier and air...20
supply hose kit; ...20
Figure 8: Compressor Sullair 375 H...21
Figure 9: Exhaust Duct Entrance ...22
Figure 10: Exhaust Duct Outside ...22
Figure 11: Sampling Train...24
Figure 12: Test Plate...25
Figure 13: Schmidt Valve...25
Figure 14: Two stage Particulate Collection System...27
Figure 15: Filter Bags...28
Figure 16: Plate before Blasting...33
Figure 17: White Metal Blast Cleaning SSPC SP-5 ...34
Figure 18: Commercial Blast Cleaning SSPC SP-6 ...35
Figure 19: Near-White Blast Cleaning SSPC-SP10 ...36
Table S1: Field Data for Copper Slag ...38
Table S2: Productivity, Consumption and Emission Factors for Copper Slag...39
Table S3: Field Data for Barshot...40
Table S4: Productivity, Consumption and Emission Factors for Barshot ...41
Table S5: Minimum Emissions at Maximum Productivity...42
Table S6: Absolute* Minimum Emissions...43
vii
Figure D2: Copper Slag Productivity vs. Feed Rate at 100 PSI ...44
Figure D3: Copper Slag Productivity vs. Feed Rate at 120 PSI ...45
Figure D4: Parameter Variation with Pressure at Maximum Feed ...45
Rate for Copper Slag ...45
Figure D5: Barshot Productivity vs. Feed Rate at 80PSI ...46
Fig D7: Barshot Productivity vs. Feed Rate at 120PSI...47
Figure D8: Parameter Variation with Pressure at Maximum Feed ...48
Rate for Barshot...48
Figure D9: Feed Rate vs. Productivity at 80 PSI for Copper Slag and...49
Barshot...49
Figure D10: Feed Rate vs. Productivity at 100 PSI for Copper Slag and...49
Barshot...49
Figure D11: Feed Rate vs. Productivity at 120 PSI for Copper Slag and...50
Barshot...50
Figure D12: Feed Rate vs. Emission Factors (g/sqft) at 80 PSI...51
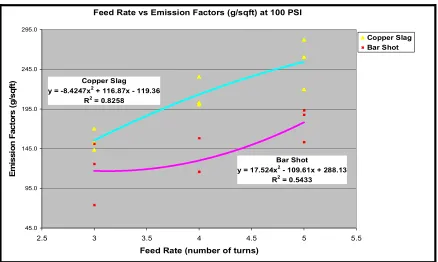
Figure D13: Feed Rate vs. Emission Factors (g/sqft) at 100 PSI...51
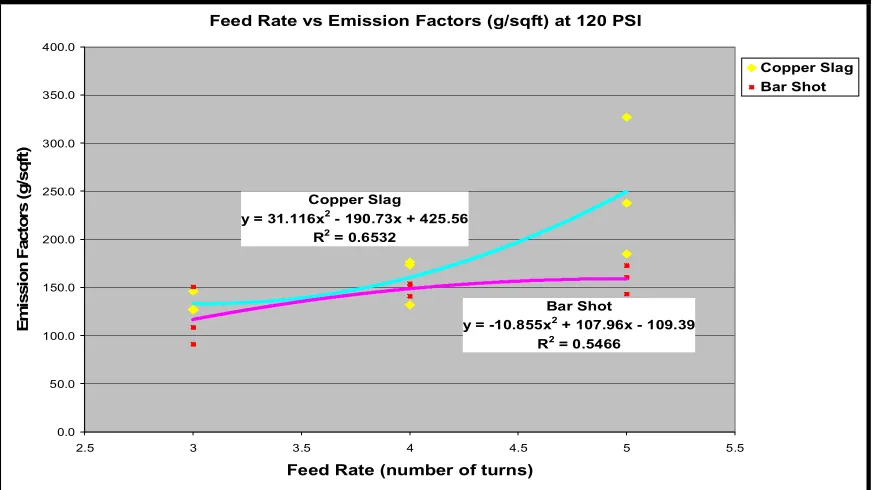
Figure D14: Feed Rate vs. Emission Factors (g/sqft) at 120 PSI...52
Figure D15: Feed Rate vs. Emission Factors (g/lb) at 80 PSI...53
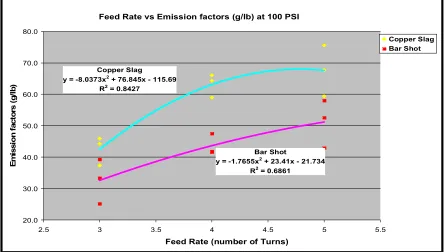
Figure D16: Feed Rate vs. Emission Factors (g/lb) at 100 PSI...53
Figure D17: Feed Rate vs. Emission Factors (g/lb) at 120 PSI...54
Figure D18: Pressure vs. Productivity at Max. Productivity...54
Figure D19: Pressure vs. Emissions Factors (g/Sqft) at Max. Productivity ...55
Figure D20: Pressure vs. Emissions Factors (g/lb) at Maximum Productivity ...56
Figure D21: Material feed rate vs. Productivity at 80 PSI...57
Figure D22: Material feed rate vs. Productivity at 100 PSI...57
Figure D23: Material feed rate vs. Productivity at 120 PSI...58
Figure D24: Material feed rate vs. Emission Factors (g/sqft) at 80 PSI...58
Figure D25: Material feed rate vs. Emission Factors (g/sqft) at 100 PSI...59
Figure 26: Material feed rate vs. Emission Factors (g/sqft) at 120 PSI ...59
Figure D27: Material feed rate vs. Emission Factors (g/lb) at 80 PSI...60
viii
Figure D29: Material feed rate vs. Emission Factors (g/lb) at 120 PSI...61
Figure D30: Pressure vs. Consumption ...61
Figure D31: Feed Rate vs. Consumption for at 80 PSI for...62
Copper Slag and Barshot...62
Figure D32: Feed Rate vs. Consumption at 100 PSI for Copper Slag ...63
and Barshot...63
Figure D33: Feed Rate vs. Consumption at 120 PSI for Copper Slag ...63
and Barshot...63
Figure D34: Material Feed Rate vs. Consumption at 80 PSI for Copper Slag...64
and Barshot...64
Figure D35: Material Feed Rate vs. Consumption at 100 PSI for ...65
Copper Slag and Barshot...65
Figure D36: Material Feed Rate vs. Consumption at 120 PSI for ...65
Copper Slag and Barshot...65
Figure D37: Material Feed Rate vs. Emission Factors (g/sqft) at Max. Productivity at 80 PSI...66
Figure D38: Material Feed Rate vs. Emission Factors (g/sqft) at Max. Productivity at 100 PSI...67
Figure D39: Material Feed Rate vs. Emission Factors (g/sqft) at Max. Productivity at 120 PSI...67
Figure D40: Material Feed Rate vs. Emission Factors (g/lb) at Max. Productivity at 80 PSI ...68
Figure D41: Material Feed Rate vs. Emission Factors (g/lb) at Max. Productivity at 100 PSI ...68
Figure D42: Material Feed Rate vs. Emission Factors (g/lb) at Max. Productivity at 120 PSI ...69
Table A1. Annual Usage Data for various abrasives in United States ...76
Table A2 State wise data availability for different abrasives ...77
Table A3 Physical Properties of Blasting Abrasives...78
ix
Table A5: Range of Prices for Abrasives in 1997...82
Table A6: Applications of Abrasives...83
Table A7: Toxicology Rating for Abrasives ...85
Figure B1: Graph Showing Minimum Number of Points...87
Figure B2: Arrangement of Pitot tube and Sampling Probe ...88
Figure B3: Isokinetic Sampling...89
Figure B4: Sampler ...90
Table C1 Field observations during stack sampling...92
Table C2 Stack Calculations...94
x
LIST OF ABBREVIATIONS
EPA: Environmental Protection Agency
GCRMTC: Gulf Coast Region Maritime Technology Center
MERIC: Maritime Environmental Research and Information Center
UNO: University Of New Orleans
SSPC: Society for Protective Coatings
PSI: Pounds per Square Inch (Pressure Unit)
MPH: Miles per hour
CFM: Cubic Feet per Minute
PM: Particulate Matter
HAP: Hazardous Air Pollutants
DGM: Dry Gas Meter
CFR: Code of Federal Register
xi
ABSTRACT
The basic objective of this study was to evaluate the environmental performance of two abrasives Copper Slag and Barshot in terms of productivity (in terms of area cleaned- ft2/hr), consumption and or used-abrasive generation rate (of the abrasive- ton/2000ft2; lb/ft2) and particulate emissions (mg/ft2; mg/lb; lb/lb; lb/kg; lb/ton). This would help in evaluating the clean technologies for dry abrasive blasting and would help shipyards to optimize the productivity and minimize the emissions by choosing the best combinations reported in this study to their conditions appropriately.
1
1. INTRODUCTION
Abrasive blasting is the most common method, which is used in majority of the shipyards for paint removal and surface preparation. Abrasive blasting is used to remove mill scale, rust, and old coatings, as well as to provide the surface profile necessary for good adhesion of the thermal spray coating (paint) to the substrate. Many materials can be used as abrasives. Sand is the most commonly used blasting abrasive. Other common abrasives, which provide a range of particle size and hardness are Copper Slag, Coal Slag, Steel Grit, Steel Shot, Glass and Garnet.
In conventional abrasive blasting also called as air-nozzle blasting or dry abrasive blasting, abrasive is conveyed to the surface to be prepared in a medium of high pressure compressed air (90-100 psi) through the nozzle at high velocity (450 mph). The abrasive particle’s mass and high velocity combine to produce kinetic energy sufficient to remove rust, mill scale, and old coatings from the substrate while simultaneously producing a roughened surface. The cost and properties associated with the abrasive material dictate its application.
2
no longer use sand for abrasive blasting because of concerns about silicosis, a condition caused by respiratory exposure to crystalline silica.
1.1 Applications of Abrasive Blasting
Abrasive blasting is the main operation in surface preparation in shipyards around the world. The innumerable applications of abrasive blasting can be categorized into standard applications and special applications. Standard applications can be summarized into three major categories:
1) Surface preparation,
2) Surface cleaning and finishing, and 3) Shot peening.
1.1.1 Surface preparation:
Surface preparation is a very important step in the shipbuilding
industry. Without proper surface preparation subsequent surface coatings will prematurely fail due to poor adhesion. The purpose of surface preparation is to roughen the surface, creating increased surface area for mechanical bonding of the paint spray coating to the substrate.
3 1.1.2 Surface cleaning and finishing:
Surface cleaning and finishing differ from surface preparation. While surface preparation is to improve the product appearance, surface cleaning is done to clean surfaces by removing the product contaminants and heat and preparing them for thermal spray coating. Surface treatment methods are done to alter the surface properties in order to increase corrosion resistance or abrasion resistance (Kura, 1996). Surface finishing includes deflashing and deburring molded parts, and enhancing visual features. Abrasive blasting can improve a products appearance by removing stains, manufacturing compound residue, corrosion, and tool marks.
1.1.3 Shot Peening:
Shot Peening is used to lengthen the fatigue life of any part that is subjected to stress. It isa cold-working method accomplished by pelting the surface of a metal part with round metallic shot (steel shot/ cast iron shot) thrown at high velocity. Each shot acts as a tiny peen-hammer, making a small dent in the surface of the metal and stretching the surface radially as it hits. To make a metal product or component, manufacturers must cast, cut, bend, stamp, and roll, or weld metal stock to produce the desired shape. Sometimes these processes leave residual stresses in the metal that, if not removed, can cause parts to fail when stressed.
4
Abrasive Blasting operations do not need to apply for legislative permits to operate under The Clean Air Act as industrial sources. However, they are required to follow state regulations and guidelines proposed by the Occupational Safety & Health Administration, which should reduce or eliminate any environmental risk associated with abrasive blasting. Louisiana State is more specific and states that adequate containment methods shall be employed during sandblasting or other similar operations. All reasonable precautions shall be taken to prevent particulate matter from becoming airborne.
Waste minimization can be done by using controls at all times, when abrasive blasting is being conducted. For indoor blasting, system should be exhausted through control equipment with a particulate matter outlet grain loading of 0.30 gdscf or less. (Ref Deq/L.A) Blast cabinet exhaust should be re-circulated to the cabinet or vented to emission control equipment.
1.2 Principle of Abrasive Blasting:
The principle of air-supported abrasive blasting is very elementary. Compressed air propels abrasive particles at high velocities to impact and clean a substrate. All the equipment between the air compressor and the emission of abrasive particles is used to supply, convey, and accelerate the abrasive. Three basic components of abrasive blasting operations are: the equipment, the abrasive, and the personnel. Careful attention to these three basic components is the key to the success or failure of the entire operation.
1. 3 Need for the Research
5
the processes. EPA has certain emission factors that are published in AP-42; but their quality rating is very low.
If various production alternatives can be optimized to achieve high productivity, lower consumption and lower emissions, the research will be very valuable for the maritime industry in minimizing costs and reducing the environmental burden. Evaluation of environmental performance of abrasives can be achieved by analyzing the characteristics of abrasives and their effect on blasting productivity, cleaning rates, recyclability, surface profile, dust, and waste generation.
Very limited information is available on emission factors for particulate emissions resulting from dry abrasive blasting. It is vital to evaluate emissions as it relates to life cycle costing and life cycle assessment. Shipyards are required to obtain environmental permits and maintain compliance, which require knowledge of the materials and processes used. Knowing environmental performance of abrasives and abrasive blasting processes, shipyards will be able to manage their environmental matters efficiently.
Besides emission factors, other parameters such as productivity (speed at which production can be achieved) which influence consumption of natural sources and raw materials are also important for evaluation of environmental performance of abrasives. Productivity and consumption directly relate to generation of multimedia waste quantities (solid wastes and air emissions).
6
test facility will be extracted with a variable ventilation rate, up to a maximum of 5400 cubic feet per minute (CFM) allowing capture of particles with different sizes generated during blasting, welding, metal cutting, and others. Two-stage particle collection system installed at test facility includes an inertial separator for coarse particles followed by bag house for fine particles. Emission test facility is equipped with a long 12” diameter duct to allow measurement of particles under iso-kinetic conditions as recommended by the EPA for particle collection from stationery sources.
The discussion above clearly indicates that evaluation of environmental performance of abrasives will reduce shipyard costs by reducing consumption, improve productivity, and minimize damage to the environment and public health.
1.4 Research Objectives
This research is aimed at optimization of dry abrasive blasting process and various production alternatives that will result in regulatory compliance, high productivity, lower consumption, and cost optimization. This research will be very valuable for the maritime industry in minimizing costs and reducing the environmental burden. Abrasive blasting is used widely in most of the shipyard repair and maintenance industry. Feed rate (lb/hr), blast pressure (PSI), types of abrasive materials, abrasive material gradation, and number of reuses will influence the material consumption, thus solid waste generation as well as atmospheric emissions. Also, it has a bearing on shipyard costs, namely, labor, material, cleanup, disposal, environmental fees, and other types of costs.
7
The specific goals of the project are to identify relationships among process parameters/types of abrasives (independent parameters) and environmental/cost parameters (dependent parameters) through optimization studies. The parameters to be evaluated include:
Process parameters/Types of Abrasives (Independent Parameters):
• Abrasive feed rates (lb/hr),
• Blast pressures (PSI),
• Gradations of abrasives (coarse, medium, and fine). Environmental/Cost Parameters (Dependent Parameters):
• Solid waste generation potential (lb/ft2),
• Atmospheric emissions (lb/1000 ft2),
• Productivity (ft2/hr) - assists in cost computations by shipyards.
8
2. BACKGROUND OF THE STUDY
Abrasive blasting is used for a variety of surface cleaning and texturing operations, mostly involving metallic target materials. It is the process of propelling a jet of blast material through a medium (compressed air) to propel the abrasive using either a suction-type or pressure-type process. The medium serves as a carrier to help the blast material obtain the adequate velocity and strength at the time of collision.
In 1991, about 4.5 million tons of abrasives, including 2.5 million tons of sand, 1 million tons of coal Slag, 500 thousand tons of smelter Slag, and 500 thousand tons of other abrasives were used for domestic abrasive blasting operations. Traditionally sand was used as the abrasive, but it is replaced by a metallic grit due to adverse health and environmental effects of silica dust associated with sand blasting.
Abrasive blasting system consists of three essential components:
• Abrasive container/ Blasting pot
• Propelling device and
• Blasting nozzle
The exact equipment used depends to a large extent on the specific application and type of abrasive used. Abrasive blasting can be either dry blasting or wet blasting. Three basic methods can be used to project the abrasive towards the target:
1) Air pressure 2) Centrifugal wheels or 3) Water pressure.
9
because the abrasive which is propelled at high velocity disintegrates into small particles and becomes airborne, which, if inhaled, might be very harmful to human health.
Centrifugal wheel systems also called as roto-blasting or automatic blasting, use a rotating impeller/spinning wheel to mechanically propel the abrasive by a combination of centrifugal and inertial forces. This process allows easy recovery of abrasive materials for reuse and recycling which will reduce the material and disposal costs.
Wet abrasive blasting involves blasting with a mixture of water, air and solid abrasives. It is generally performed on ships to remove chipping paint from ship’s hull. Hydro-blasting is a widely used wet blasting technique which uses only high pressure water.
Abrasive materials used in blasting can generally be classified as sand, Slag, metallic shot or grit, synthetic, or other. The cost and properties associated with the abrasive material dictate its application. Hazardous air pollutants, typically particulate metals, are emitted from some abrasive blasting operations. These emissions are dependent on both the abrasive material and the targeted surface. Abrasive selection depends on the desired quality of the product.
10
Metallic abrasives include cast iron shot, cast iron grit, and steel shot. Cast iron shot is hard and brittle. Steel shot is not as hard as cast iron shot, but is much more durable. These materials are reclaimed and reused.
Synthetic abrasives, such as silicon carbide and aluminum oxide, are becoming popular substitutes for sand. These abrasives are more durable and create less dust than sand. These materials are also typically reclaimed and reused.
Other abrasives include mineral abrasives such as garnet, olivine e.t.c. Mineral abrasives are reported to create significantly less dust than sand and Slag abrasives. The type of abrasive used in a particular application is usually specific to the blasting method. Dry abrasive blasting is usually done with Slag, sand, metallic grit or shot, aluminum oxide (alumina), or silicon carbide. Wet blasters are operated with sand, glass beads, or other materials that remain suspended in water.
Particulate matter (PM), HAP’s and solid waste disposal is always an issue at all the facilities. Lots of money and time goes into proper disposal of the wastes generated by these processes. Optimization of dry abrasive blasting process and abrasive materials which will result in waste minimization, regulatory compliance, and cost optimization.
The abrasive used affects the product quality. It determines the nozzle size, operating frequencies of the compressor, and amount of blast material to be used in the process. From this discussion, it is conspicuous that the choice of the proper blasting material is the most governing factor.
11
using stringent limitations due to increased emissions is another important consideration affecting cost.
The test facility at University of New Orleans, located north of the engineering building was used for development of emission factors for Copper Slag and Barshot with the help of maritime industry, regulatory agencies, equipment vendors, and materials suppliers. The environmental performance of these two abrasives was evaluated at different feed rates (3, 4, 5 turns) and at different blast pressures (80,100, and 120 PSI).
The Environmental Protection (Abrasive Blasting) Regulations 1998 (U.S.A) require abrasive blasting to be carried out in a blasting chamber unless such a chamber cannot reasonably be used because of the size, shape, position or location of the object being blasted. The study was conducted in a closed environment (a chamber specially constructed for the tests) and under controlled conditions (filter bags were used to restrict release of emissions into atmosphere).
Abrasive blasting presents some risks for worker health and safety, because blasting operations have the potential to produce air emissions. Although abrasives used in blasting booths are not hazardous in themselves (steel shot, and grit, etc.), their use can present a serious danger to operators, such as burns due to projections, cuts due to walking on round shots scattered on the ground, exposure to hazardous dust, creation of an explosive atmosphere, and exposure to a detrimental noise level. Both blasting booths and blaster equipment have to be adapted to these dangers.
2.1 Sources and Applications of Copper Slag
2.1.1 Sources of Copper Slag:
12
a molten by-product of high temperature processes that are primarily used to separate the Copper metal and nonmetal constituents contained in the bulk ore. Arizona produces in excess of 20,000 tons of Slag per year
Figure 1: Copper Slag and major blasting application using Copper Slag
2.1.2 Applications:Copper Slag can be used as
• Granular base and embankment materials,
• Aggregate substitutes in hot mix asphalt,
• Mine backfill materials,
• Railway ballast materials,
• Grit blast abrasives,
Roofing granule material,
• Manufacture of blended cements
2.2 Sources and Applications of Barshot
2.2.1 Sources of Barshot: Barshot is an economical, recyclable, blast cleaning
13
scale, and corrosion, quickly, leaving a near white to white metal preparation. It is recommended that proper abrasive metering valves be used to reduce abrasive consumption and maximize production speed.
Figure 2: Specular Hematite/Barshot
It is a cost effective and an environmentally friendly abrasive for the reason that
• Significantly less abrasive per square foot
• Fast blast rate (density 180 lbs/ft3)
• Recyclable 3-5 times reducing media and disposal costs
• California Air Resources Board Approved.
• Non toxic guaranteed - less than 0.3% free silica.
• Pure iron oxide (mineral not metallic) easily recyclable for cement manufacture.
14
Figure 3: Blasting using silica based abrasive / Using Barshot (dust free)
2.2.2 Applications: Barshot can be used as
• Alloying agent in raw material feed stock industries
• Additive in Cement manufacturing industries,
15
3. OBJECTIVES OF STUDY
The main objectives of this study were:
• Evaluation of clean technologies for dry abrasive blasting
• To study the environmental performance of Copper Slag and Barshot.
• Optimization of dry abrasive blasting process and abrasive materials which will result in waste minimization, regulatory compliance, and cost optimization.
• Establish relationships among process conditions/materials and the cost/environmental parameters by measuring productivity and waste quantities (solid/hazardous wastes and air emissions)
The specific objectives of the project were:
• Design and construction of the test chamber to be used for simulating actual blasting operations conducted at shipyards under enclosed, controlled conditions on plates similar to steel plates commonly blasted at shipyards
• Evaluation of performance parameters which include:
Abrasive feed rates: Corresponds to no. of turns on feed valve; mass flow rate of abrasive through the nozzle under given pressure conditions.
Productivity (lb/hr): mass of abrasive material per unit area cleaned Blast pressures (PSI),
Gradations of abrasives (coarse, medium or fine), Types of abrasives (Copper Slag and Barshot) and Number of reuses
16
Emission Factors – this is indicative of the pollutant mass emitted in terms of input or output parameters, and can be defined as follows:
Mass of pollutant / area cleaned,
Mass of pollutant / mass of abrasive used.
17
4. EQUIPMENT AND MATERIALS
4.1 Test Chamber Design and Construction
An emission test facility was installed on the rear end of the engineering building on the main campus of UNO in New Orleans with partial funding received through a research project funded by EPA region VI. Test facility is of size 12 x 10 x 8 feet (length x width x height) and was designed as per the guidelines of EPA method 204. The chamber was constructed using plastic sheets which were connected and riveted firmly to the wooden floor. The floor was made up of seasoned wood and then treated with waterproofing materials. Gaps were sealed with the silicon to prevent any seepage of the water that may interfere with the test process. A wooden ramp was used to move the panel cart in and out of the chamber smoothly before and after blasting. A plastic tarpaulin was erected adjacent to the chamber to house the sampling equipment and test aids. The cover was also used to shield the sampling equipment against rain and storm events.
18
Figure 4: Emission test facility at UNO
Blast chamber consists of a room with internal lighting that holds both the work piece and the operator. The operator may hold the blasting nozzle on the end of the hose. The work piece rest on wooden flooring that allows used abrasive to drop through for recycling. Provisions were made for the air needed to replace the air being exhausted by the exhaust fan. An exhaust window located at one end of the chamber leads to the sampling duct through which the particulates would be collected using a variable speed fan.
Figure 5: Complete Assembly of the Test Facility
19
The exhaust fan is capable of operating at various speeds and corresponds to a maximum flow of 5500 cubic feet per minute (CFM). The operating conditions at UNO test facility are varying between 2800-3600 CFM. It has a variable speed meter which was operated at 60 HZ. The particles are then collected through a two-stage particulate collection system (gravimetric and bag filters) with an efficiency of 90% in the first stage in a drum and then through the filter bags.
4.2 Blasting Equipment (Blastpot)
The action of propelling the blast material with the help of air takes place in this blastpot. The abrasive as well as the air will be at the same pressure, which sweeps the abrasive towards the hose. The blast material mixes with compressed air and gains its strength in the blasting equipment. The blasting equipment known as blast pot used in this experiment is of 600 lbs capacity and with 1.25 inches piping, with moisture separator, air filter, and helmet with air conditioning unit.
20
The abrasive material used should be free from lumps and dust, which may obstruct the free flow of the material during the process of blasting. Any lumps, dust, or other foreign material present in the material obstructs the flow by choking the valves and interrupts the smooth flow of material. A known quantity of abrasive is put in the blast pot.
Figure 7: Blast pot; Hose with nozzle holder; Respirator, air purifier and air supply hose kit;
If the flow is obstructed, then immediately the path of the flow must be cleared. All of the hose joints must be fastened properly with the help of fasteners and must be checked before each run. After the desired amount of blast material is poured into the pot, the opening and side walls of the hopper have to be cleaned thoroughly. After cleaning, the side opening, a small window on the side of the blastpot, as shown in Fig. 5 must be closed tightly.
4.3 Compressor
Compressed air is, with abrasive, one of the most important
21
velocity to the blast material. The desired effect depends on many parameters such as grain size and shape of the abrasive, pressure of the compressed air, e.g., but the velocity at which the blasting material strikes the target to be prepared is the focal factor.
The compressor used for the study was a SULLAIR 375H, which is capable of providing the maximum pressure of 150 pounds per square inch (PSI). The pressures used for the study were 80 PSI, 100 PSI and 120 PSI. The compressor is diesel operated and wheel based with a swing down cooler, circuit breaker, two-stage air filters, and a high/low pressure selector.
Figure 8: Compressor Sullair 375 H
4.4 Exhaust Duct
22
variable speed fan was positioned at 2 diameters from the port to minimize the turbulence on the downstream end.
The exhaust window is directly connected to the duct, which carries the emissions collected through the exhaust. The inner portion of the duct should be smooth and free of undulations and fairly straight. A nozzle size of 0.18 inches turned out to be best for the test set up, which gave fairly balanced results. (Pilot tests were conducted to determine the size of the nozzle).
Figure 9: Exhaust Duct Entrance
Figure 10: Exhaust Duct Outside
23
minimum number of locations needed to make measurements depend on the extent of disturbance or turbulence in the flow. A total of eight traverse points were chosen for testing for the circular duct. The traverse points were measured and marked on the sampling probe to ensure accuracy and ease of traverse.
Iso-kinetic sampling should be ensured throughout each and every test run. Iso-kinetic sampling helps in getting the representative sample from the duct and in getting accurate test results. Getting Iso-kinetic sampling is one of the important steps in obtaining accurate results. For ensuring iso-kinetic flow conditions a nozzle of size of 0.18 inches was chosen for the runs.
A change in the diameter of stack or change in the direction of flow is considered as turbulence or disturbance to the flow. The exhaust should be properly protected with mesh of proper size to remove the coarser particles, but allow the fine particles to go smoothly into the duct.
4.5 Stack Sampling Equipment
24
Figure 11: Sampling Train
Since the objective is to measure accurately the water vapor in the condenser/absorber section of the apparatus, the probe and sample lines upstream of this section must be inert and heated to avoid condensation, and the whole system must be leak free. The apparatus consists of four glass impingers connected in series and installed in an ice bath. The first two impingers are filled with an accurately measured quantity (100 ml) of water and act as bubblers; the gas is drawn down through the cold water and bubbles up, then travels out to the next impinger. The third impinger is left dry for further condensation. The fourth impinger contains a quantity of silica gel (adsorbent) that removes nearly all the remaining water vapor as the gas passes through before finally exiting.
4.6 Plate Size Specifications
The test plates used for blasting operations were made of cast iron (8’x5’), similar to those used in shipyards. The experiments were conducted for surfaces with flash rust. A total of four plates were used and they were mounted on a panel cart. The results presented in this document correspond to blasting of plates having flash rust generated by the action of moisture and air on the
Impinger
Stack
Sampling
25
exposed plates. Typically the plates were allowed to rust after every blasting run for around 24 hours (average over all the runs) to ensure uniform rust.
Figure 12: Test Plate
To support the plates during the experiment a panel cart was used. The panel cart was chosen in such a way that two plates can be mounted at a time and can be turned using the castors during the experiment if needed.
4.7 Schmidt Valve
Schmidt valve was used to vary the feed rates in terms of the number of turns by which the valve is open. A Schmidt valve controls the flow of blast material. The range of turns was a minimum of one turn to a maximum of nine and half turns. The
26
The number of turns used in the experiment ranged from a minimum of three to a maximum of five.
4.8 Sampling Train
The sampling train, an important piece of equipment, consists of the following parts: nozzle, the sampling probe, the filter holder, connectors, and the impinger. In this part of the set up, the moisture separates from the sample gas volume.
Probe and Nozzle: The probe and nozzle should be of aluminum with a sharp
tapered leading edge. The angle of taper should be on the outside to preserve a constant internal diameter. The probe and nozzle shall be constructed of seamless tubing.
Filter Holder: The filter holder is of aluminum with a screen and silicone rubber
gaskets. The holder is attached directly to the outlet of the probe. The probe and filter holder must be constructed to be leak free.
Connectors: The glass connectors are used to connect the impingers with each
other and to assure air tight sealing clamps are used. Each joint is clamped properly and securely to provide air tightness throughout the test run.
Impingers: There are a total of four impingers in the sampling train. The first two
27
4.9 Particulate Collection System
Two-stage particle collection system installed at test facility includes an inertial separator for coarse particles followed by bag house for fine particles. Emission test facility is equipped with a long 12” diameter duct to allow measurement of particles under iso-kinetic conditions as recommended by the EPA for particle collection from stationery sources.
The two stage particulate collection system (Refer to Figure 13) is designed to trap the maximum amount of emissions and to prevent it from becoming airborne. In the first stage the exhaust duct is diverted into a 55-gallons drum after passing the sampling train. In this process the coarser particles settle down at the bottom of the drum and thus will be removed from the system.
Figure 14: Two stage Particulate Collection System
28
trapping more and more emissions and preventing them from becoming airborne, thus increasing the efficiency of the overall collection system.
Figure 15: Filter Bags
4.10 Test Constraints
It is important to recognize that particulate emissions depend on a number of factors, such as, (1) blast pressure, (2) feed rate, (3) blast nozzle size, (4) abrasive grading, (5) exhaust rate, (6) exhaust flow pattern, (7) orientation of the plate inside the test chamber, (8) distance between the plate and the blast nozzle, (9) angle of the blast nozzle with respect to the test plate, (10) surface finish required, and (11) surface contamination at the beginning. Though every effort was made to simulate field conditions, it is important to note the conditions of this study.
• Blast pressure and feed rates were measured for all runs in the study and the results are expressed with respect to these parameters.
• Blast nozzle used was size # 6 (Bazooka) for all test runs.
• Medium grade Copper Slag and medium grade Barshot were used without a recycling option.
29
• Exhaust flow pattern maintained same for all test runs by maintaining the plate orientation with respect to exhaust opening.
• An average distance of 12” was maintained between the test plate and the blast nozzle.
• Blast nozzle was kept perpendicular to the plate as much as possible.
• Surface finish quality maintained was near to commercial finish (SPC-6).
30
5. FIELD TEST PROCEDURE
Field testing at UNO included two major mechanisms (1) Blasting the rusted panels using Copper Slag and Barshot, and (2) Stack sampling to evaluate particulate emissions.
For source sampling, EPA’s emissions test methods 1 through 5 were used. Methods 1 through 5 is presented in Appendix B. Commonly observed shipyard blasting procedures (Society for Protective Coatings- SSPC) recommendations were followed for blasting. SSPC has visual standards to characterize the metal surface that is cleaned using abrasives. These guidelines are presented in Section 5.2. This section presents general procedures used for the field tests.
To begin with, rusted substrates were mounted on the cart (one on each side). The desired amount of abrasive was poured into the blast pot through a sieve to remove any foreign material that may interfere with the smooth flow of the abrasive. Blast nozzle size # 6 was used in all the field tests in this study. The compressor was kept ready to supply compressed air to the blast pot. Stack sampling equipment was also kept ready for the sample collection at various traverse points which were marked on the probe in advance. The sampling train was connected properly with impingers in position and leak tests were done to make sure the connections were tight.
31
The sampling probe was inserted into the sampling port and the necessary parameters, namely, velocity head, stack temperature, vacuum, DGM readings, and box temperature were recorded for the iso-kinetic sampling conditions at the time. Then the filters used in the test along with sampling probe were taken to the laboratory for analysis.
The filter was weighed and the sampling probe was rinsed thoroughly with acetone to get the remaining particulates stuck on the side of the wall in a pre-weighed beaker. The difference between the final weight of the filter and the initial weight of the filter plus the final weight and initial weight of the beaker after evaporating the acetone and acetone blank test gives the particulate loading for the volume of gas sampled. After this step, the leak test was performed again to check for leakage in the sampling train.
The following sequence was used to perform various field activities:
• Obtain the values for barometric pressure and temperature.
• Using these values and the nozzle diameter calculate the K factor necessary for isokinetic sampling. (Delta H = K* Delta P). Set up the instrument and sampling train on site.
• Perform leak check (pre test).
• Note down various parameters needed for the run viz., velocity head, stack temperature, vacuum, DGM readings, box temperature, etc.
• Perform leak check (post test).
• Obtain the percentage isokinetic from the observed parameters and formulae listed in the EPA methods. (Within 90% to 110%).
• Get the particulate loading by weighing the filters in the laboratory and acetone blank.
5.1 Important Variables Monitored
32
Blast Pressure: The tests were conducted at three blast pressures, 80 PSI, 100
PSI, and 120 PSI.
Feed Rate: Feed rate of the abrasive was varied using a Schmidt valve connected
to the bottom of the blast pot, corresponding to 3, 4, and 5 turns in an open condition of the valve.
Stack Sampling Nozzle Size: A nozzle of diameter 0.18 inch was used to ensure
isokinetic sampling conditions as described earlier.
Blasting Time: The total blasting time was measured for each run using a
stopwatch. The sampling time was constant for all the runs: 2 minutes at each traverse point adding up to a total of 16 minutes for an entire run.
Area Cleaned: The blasted area was calculated using a measuring tape.
Necessary corrections were made for accurately measuring the area cleaned.
Productivity: Productivity is a measure of blasting speed and is defined as: Productivity (sq ft/hr) = Area Cleaned (sq ft) / Total Blasting Time (Hr)
Emission Factors: The emission factors are expressed in this report in terms of
the following units:
a. Mass of particles emitted (mg) / Area cleaned (ft2)
b. Mass of particles emitted (mg) / Quantity of abrasive used (lb) c. Mass of particles emitted (lb) / Quantity of abrasive used (lb) d. Mass of particles emitted (lb) / Quantity of abrasive used (kg) e. Mass of particles emitted (lb) / Quantity of abrasive used (ton)
Consumption: Defined as
Consumption = Quantity of Abrasive Used (lb) / Area Cleaned (sq ft)
5. 2 Surface Preparation Standards
33
characteristics are illustrated in Figures 15 through 17. Figure 15 illustrates a rusted panel before blasting. Figures 16 and 17 illustrate finished surfaces.
34
5.2.1 SP-5 SPC Standards
5.2.1. A White Metal Blasting Cleaning
SSPC SP- 5 Definition: Whitemetal blast cleaning is a method of preparing steel surfaces by use of abrasive blasting. Using an abrasive along with compressed air, water, or both, removes all dirt, dust, loose mill scale, loose rust, and loose paint. The completed surface shall be cleaned to a gray-white metallic color. Uniformity of color may be affected by the grade of the metal, original surface condition, or shadowing from blast cleaning patterns
Figure 17: White Metal Blast Cleaning SSPC SP-5
35
Figure 18: Commercial Blast Cleaning SSPC SP-6
5.2.1 C Brush-off Blast Cleaning SSPC SP-7 Definition: Brush-off blast cleaning is a method of preparing steel surfaces by use of abrasive blasting. Using an abrasive along with compressed air, water, or both, removes all dirt, dust, loose mill scale, loose rust, and loose paint. Tightly adherent mill scale, rust, and paint may remain on the surface. Mill scale, rust and paint are considered adherent if they cannot be removed by a dull putty knife.
36
37
6. RESULTS AND ANALYSIS
This chapter presents the field results obtained in the study. Table S1 gives the field data observed for Copper Slag and Table S2 shows the statistical parameters (mean and standard deviations) of productivity (sq. ft/hr), consumption (lb/sqft) and emission factors (mg/sq. ft, mg/lb, and lb/ton) for Copper Slag. Tables S3 and S4 show similar data for Barshot.
The columns in these tables can be read as follows: Column 1: Press: Pressure (PSI).
Column 2: Turns: Number of turns.
Column 3: Wt: Weight of the abrasive used (lbs). Column 4: BT: Blasting time (minutes).
Column 5: A: Cleaned area of the plate (square feet).
Column 6: E: Quantity of emissions obtained in the sampling train (grams of pollutant mass collected).
Column 7: P: Productivity (sq ft/hr). Column 8: C: Consumption (lb/sq ft).
Column 9: EF1: Emission factor represented as mass of pollutant per area cleaned (mg/sq ft).
38
Table S1: Field Data for Copper Slag
Press Turns Wt BT MCR A E P C EF1 EF2
PSI Lbs min lbs/min sqft gm sqft / hr lb/sqft g/sqft g/lb lb/lb lb/kg lb/ton
120 3 100 10 10.00 28 3573.95 168.00 3.57 127.6 35.7 0.079 0.173733 158 120 4 100 9 11.11 27 4674.05 180.00 3.70 173.1 46.7 0.103 0.227211 206 120 5 100 12 8.33 25 5942.15 125.00 4.00 237.7 59.4 0.131 0.288855 262 120 3 100 9 11.11 26 3801.92 173.33 3.85 146.2 38.0 0.084 0.184816 168 120 4 100 12 8.33 38 5017.84 190.00 2.63 132.0 50.2 0.111 0.243923 221 120 5 100 8 12.50 20 6540.91 150.00 5.00 327.0 65.4 0.144 0.317961 288 120 3 100 11 9.09 30 3791.32 163.64 3.33 126.4 37.9 0.084 0.1843 167 120 4 100 10 10.00 28 4937.27 168.00 3.57 176.3 49.4 0.109 0.240006 218 120 5 100 13 7.69 30 5541.10 138.46 3.33 184.7 55.4 0.122 0.269359 244 100 3 100 11 9.09 26 3733.54 141.82 3.85 143.6 37.3 0.082 0.181492 165 100 4 100 8 12.50 28 6604.31 210.00 3.57 235.9 66.0 0.146 0.321043 291 100 5 100 9 11.11 24 6775.42 160.00 4.17 282.3 67.8 0.149 0.329361 299 100 3 100 12 8.33 27 4593.59 135.00 3.70 170.1 45.9 0.101 0.223299 203 100 4 100 9 11.11 29 5893.23 193.33 3.45 203.2 58.9 0.130 0.286477 260 100 5 100 10 10.00 27 5941.67 162.00 3.70 220.1 59.4 0.131 0.288831 262 100 3 100 13 7.69 29 4424.41 133.85 3.45 152.6 44.2 0.098 0.215076 195 100 4 100 11 9.09 32 6429.16 174.55 3.13 200.9 64.3 0.142 0.312529 284 100 5 100 11 9.09 29 7562.42 158.18 3.45 260.8 75.6 0.167 0.367617 334 80 3 100 15 6.67 34 2298.39 136.00 2.94 67.6 23.0 0.051 0.111727 101 80 4 100 13 7.69 38 2817.61 175.38 2.63 74.1 28.2 0.062 0.136967 124 80 5 100 15 6.67 32 3594.64 128.00 3.13 112.3 35.9 0.079 0.174739 159 80 3 100 12 8.33 28 2050.83 140.00 3.57 73.2 20.5 0.045 0.099693 90 80 4 100 11 9.09 32 2833.42 174.55 3.13 88.5 28.3 0.062 0.137736 125 80 5 100 12 8.33 28 3546.39 140.00 3.57 126.7 35.5 0.078 0.172394 156 80 3 100 11 9.09 25 2254.12 136.36 4.00 90.2 22.5 0.050 0.109575 99 80 5 100 13 7.69 30 3061.60 138.46 3.33 102.1 30.6 0.068 0.148828 135 80 4 100 10 10.00 29 3272.67 174.00 3.45 112.9 32.7 0.072 0.159088 144
BT= Blasting Time, A = Area, E= Emission, P=Productivity, EF1= Emission Factor 1 (mass/unit surface area cleaned) in mg/ ft2, EF2= Emission Factor 2 (mass/unit material used) mg/lb, lb/lb, lb/kg, lb/ton)
39
Table S2: Productivity, Consumption and Emission Factors for Copper Slag
Press Turns Wt Productivity Consumption Emission Factors
PSI Lbs sqft /
hr Mean S D lb/sqft Mean S D g/sqft Mean SD g/lb Mean SD lb/ton Mean SD
120 3 100 168.00 3.57 127.6 35.7 158
120 3 100 173.33 168.32 4.85 3.85 3.58 0.26 146.2 133.40 11.10 38.0 37.20 1.30 168 164.33 5.51 120 3 100 163.64 3.33 126.4 37.9 167
120 4 100 180.00 3.70 173.1 46.7 206 120 4 100 190.00 179.33 11.02 2.63 3.30 0.58 132.0 160.47 24.70 50.2 48.77 1.83 221 215.00 7.94 120 4 100 168.00 3.57 176.3 49.4 218
120 5 100 125.00 4.00 237.7 59.4 262 120 5 100 150.00 137.82 12.51 5.00 4.11 0.84 327.0 249.80 71.92 65.4 60.07 5.03 288 264.67 22.12 120 5 100 138.46 3.33 184.7 55.4 244 100 3 100 141.82 3.85 143.6 37.3 165 100 3 100 135.00 136.89 4.31 3.70 3.67 0.20 170.1 155.43 13.48 45.9 42.47 4.55 203 187.67 20.03 100 3 100 133.85 3.45 152.6 44.2 195
100 4 100 210.00 3.57 235.9 66.0 291 100 4 100 193.33 192.63 17.74 3.45 3.38 0.23 203.2 213.33 19.58 58.9 63.07 3.71 260 278.33 16.26 100 4 100 174.55 3.13 200.9 64.3 284
100 5 100 160.00 4.17 282.3 67.8 299 100 5 100 162.00 160.06 1.91 3.70 3.77 0.37 220.1 254.40 31.59 59.4 67.60 8.10 262 298.33 36.00 100 5 100 158.18 3.45 260.8 75.6 334
80 3 100 136.00 2.94 67.6 23.0 101 80 3 100 140.00 137.45 2.21 3.57 3.50 0.53 73.2 77.00 11.77 20.5 22.00 1.32 90 96.67 5.86 80 3 100 136.36 4.00 90.2 22.5 99
80 4 100 175.38 2.63 74.1 28.2 124 80 4 100 174.55 174.64 0.69 3.13 3.07 0.41 88.5 91.83 19.61 28.3 29.73 2.57 125 131.00 11.27 80 4 100 174.00 3.45 112.9 32.7 144
80 5 100 128.00 3.13 112.3 35.9 159 80 5 100 140.00 135.49 6.53 3.57 3.34 0.22 126.7 113.70 12.36 35.5 34.00 2.95 156 150.00 13.08 80 5 100 138.46 3.33 102.1 30.6 135
40
Table S3: Field Data for Barshot
Press Turns Wt BT MFR A E P C EF1 EF2
PSI Lbs Min lbs/min sqft gm sqft/hr lb/sqft g/sqft g/lb lb/lb lb/kg lb/ton
120 3 100 10 10.00 36 3906.76 216.00 2.78 108.5 39.1 0.086 0.189912 172
120 4 100 8 12.50 34 4796.34 255.00 2.94 141.1 48.0 0.106 0.233155 212
120 5 100 9 11.11 32 5531.46 213.33 3.13 172.9 55.3 0.122 0.26889 244
120 3 100 12 8.33 38 3462.34 190.00 2.63 91.1 34.6 0.076 0.168308 153
120 4 100 9 11.11 38 5745.37 253.33 2.63 151.2 57.5 0.127 0.279289 253
120 5 100 11 9.09 38 5447.72 207.27 2.63 143.4 54.5 0.120 0.26482 240
120 3 100 11 9.09 34 5126.07 185.45 2.94 150.8 51.3 0.113 0.249184 226
120 4 100 8 12.50 34 5238.17 255.00 2.94 154.1 52.4 0.116 0.254633 231
120 5 100 10 10.00 37 5953.31 222.00 2.70 160.9 59.5 0.131 0.289397 263
100 3 100 10 10.00 26.5 3334.04 159.00 3.77 125.8 33.3 0.074 0.162071 147 100 4 100 11 9.09 36 4164.21 196.36 2.78 115.7 41.6 0.092 0.202427 184
100 5 100 12 8.33 28 5257.03 140.00 3.57 187.8 52.6 0.116 0.25555 232
100 3 100 11 9.09 26 3931.40 141.82 3.85 151.2 39.3 0.087 0.19111 173
100 4 100 9 11.11 30 4750.03 200.00 3.33 158.3 47.5 0.105 0.230904 209
100 5 100 11 9.09 28 4294.59 152.73 3.57 153.4 42.9 0.095 0.208765 189
100 3 100 13 7.69 34 2516.04 156.92 2.94 74.0 25.2 0.055 0.122308 111
100 4 100 10 10.00 36 4182.48 216.00 2.78 116.2 41.8 0.092 0.203315 184
100 5 100 13 7.69 30 5801.01 138.46 3.33 193.4 58.0 0.128 0.281993 256 80 3 100 14 7.14 29 3300.61 124.29 3.45 113.8 33.0 0.073 0.160446 146 80 4 100 10 10.00 36 3751.02 216.00 2.78 104.2 37.5 0.083 0.182341 165
80 5 100 9 11.11 28 4479.80 186.67 3.57 160.0 44.8 0.099 0.217768 198
80 3 100 12 8.33 28 3504.36 140.00 3.57 125.2 35.0 0.077 0.170351 155
80 4 100 11 9.09 38 3256.57 207.27 2.63 85.7 32.6 0.072 0.158306 144
80 5 100 12 8.33 36 5163.62 180.00 2.78 143.4 51.6 0.114 0.251009 228
80 3 100 12 8.33 28 3782.47 140.00 3.57 135.1 37.8 0.083 0.18387 167
80 4 100 11 9.09 38 4117.96 207.27 2.63 108.4 41.2 0.091 0.200179 182
41
Table S4: Productivity, Consumption and Emission Factors for Barshot
Press Turns Wt P C Emission Factors
PSI lbs sqft /
hr Mean SD lb/sqft Mean SD g/sqft Mean SD g/lb Mean SD lb/ton Mean SD
120 3 100 216.00 2.78 108.5 39.1 172 120 3 100 190.00 197.15 16.48 2.63 2.78 0.16 91.1 116.80 30.70 34.6 41.67 8.64 153 183.67 37.87 120 3 100 185.45 2.94 150.8 51.3 226
120 4 100 255.00 2.94 141.1 48.0 212 120 4 100 253.33 254.44 0.96 2.63 2.84 0.18 151.2 148.80 6.82 57.5 52.63 4.75 253 232.00 20.52 120 4 100 255.00 2.94 154.1 52.4 231
120 5 100 213.33 3.13 172.9 55.3 244 120 5 100 207.27 214.20 7.40 2.63 2.82 0.27 143.4 159.07 14.84 54.5 56.43 2.69 240 249.00 12.29 120 5 100 222.00 2.70 160.9 59.5 263 100 3 100 159.00 3.77 125.8 33.3 147 100 3 100 141.82 152.58 9.38 3.85 3.52 0.50 151.2 117.00 39.35 39.3 32.60 7.08 173 143.67 31.13 100 3 100 156.92 2.94 74.0 25.2 111
100 4 100 196.36 2.78 115.7 41.6 184 100 4 100 200.00 204.12 10.45 3.33 2.96 0.32 158.3 130.07 24.45 47.5 43.63 3.35 209 192.33 14.43 100 4 100 216.00 2.78 116.2 41.8 184
100 5 100 140.00 3.57 187.8 52.6 232 100 5 100 152.73 143.73 7.83 3.57 3.49 0.14 153.4 178.20 21.66 42.9 51.17 7.65 189 225.67 33.95 100 5 100 138.46 3.33 193.4 58.0 256
80 3 100 124.29 3.45 113.8 33.0 146 80 3 100 140.00 134.76 9.07 3.57 3.53 0.07 125.2 124.70 10.66 35.0 35.27 2.41 155 156.00 10.54 80 3 100 140.00 3.57 135.1 37.8 167
80 4 100 216.00 2.78 104.2 37.5 165 80 4 100 207.27 210.18 5.04 2.63 2.68 0.09 85.7 99.43 12.08 32.6 37.10 4.31 144 163.67 19.04 80 4 100 207.27 2.63 108.4 41.2 182
42
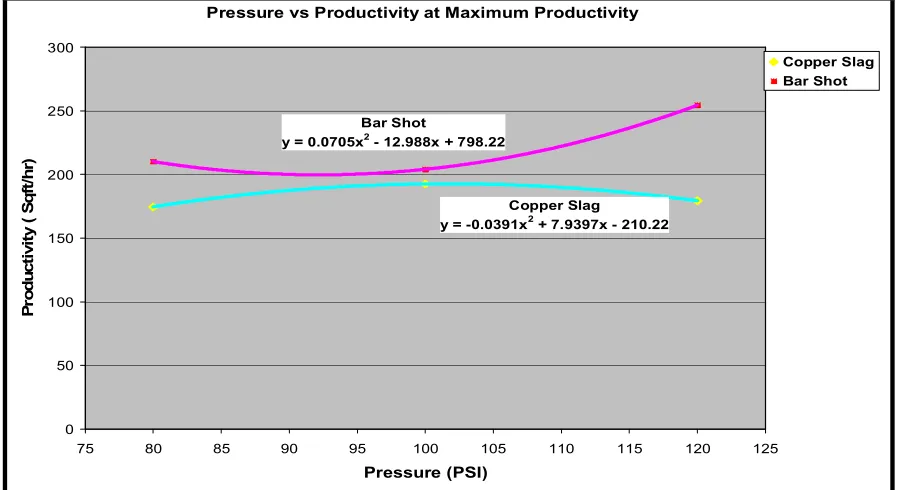
Environmental performance data presented in the tables above correspond to various blast pressures and various feed rates. As shipyards often use maximum productivity conditions by adjusting feed valve, it was felt vital to determine emission factors at the feed rate that gives maximum productivity. This was evaluated for each tested pressure condition. Table C5 shows minimum emissions at maximum productivity (at a feed rate that yields maximum productivity) for 80, 100, and 120 PSI.
Table S5: Minimum Emissions at Maximum Productivity
S No Pressure Feed rate Productivity Emission Maximum Factors
Consumption
(PSI) (No. of turns) (sqft/hr) g/sqft g/lb lb/ton lb/sqft
Copper
Slag 80 4 174.64 91.83 29.73 131.00 3.07
100 4 192.63 213.33 63.07 278.33 3.38
120 4 179.33 160.47 48.77 215 3.3
Barshot 80 4 210.18 99.43 37.1 163.67 2.68
100 4 204.12 130.07 43.63 192.33 2.96
120 4 254.44 148.8 52.63 232.00 2.78
Based on the study, it was observed that 80 PSI has resulted in lowest emissions
for Copper Slag and minimum consumption for Barshot
i.e. At 80 PSI Copper Slag Lowest Emissions
43
Table S6 shows the absolute minimum emissions without considering productivity.
Table S6: Absolute* Minimum Emissions
S No Pressure Feed rate Emission Factors
(PSI) (No. of turns) g/sqft g/lb lb/ton
Copper Slag 80 3 77 22 96.67
100 3 155.43 42.47 187.67
120 3 133.4 37.2 164.33
Barshot 80 4 99.43 37.1 163.67
100 3 117 32.6 143.67
120 3 116.8 41.67 183.67
* Minimum Emissions without considering Productivity
Copper Slag produced the lowest emissions (77 g/sqft) and the lowest consumption (5.19 lb/ft2) at 80 PSI. Similarly, Barshot produced the lowest emissions (99.43 g/sqft) and the lowest consumption (3.3 lb/ft2) at 80 PSI.
44
Copper Slag: Feed Rate vs Productivity at 80 PSI
y = -38.172x2 + 304.4x - 432.18 R2 = 0.9682
120.00 130.00 140.00 150.00 160.00 170.00 180.00
2 3 4 5 6
Feed Rate (number of turns)
Pr odu ct iv it y ( s qf t/ hr )
Figure D1: Copper Slag Productivity vs. Feed Rate at 80 PSI
Copper Slag: Feed Rate vs Productivity at 100 PSI
y = -44.152x2 + 364.8x - 560.15 R2 = 0.8747
130.00 150.00 170.00 190.00 210.00
2 3 4 5 6
Feed Rate (number of turns)
Pr oduct ivi ty ( sqf t/ hr )
45
Copper Slag: Feed Rate vs Productivity at 120 PSI
y = -26.261x2 + 194.84x - 179.84 R2 = 0.8215
120.00 130.00 140.00 150.00 160.00 170.00 180.00 190.00
2 3 4 5 6
Feed Rate (number of turns)
P roduc ti v it y ( s qf t/ h r)
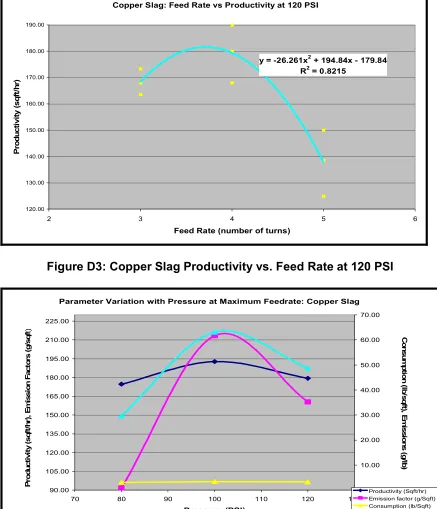
Figure D3: Copper Slag Productivity vs. Feed Rate at 120 PSI
Parameter Variation with Pressure at Maximum Feedrate: Copper Slag
90.00 105.00 120.00 135.00 150.00 165.00 180.00 195.00 210.00 225.00
70 80 90 100 110 120 130
Pressure (PSI) 0.00 10.00 20.00 30.00 40.00 50.00 60.00 70.00 Productivity (Sqft/hr) Emission factor (g/Sqft) Consumption (lb/Sqft) Emission (g/lb) Co ns um pt ion ( lb/ sqf t), Em is si ons ( g /lb ) Pr odu c ti vi ty ( s q ft /hr ), Em is s ion Fac to rs (g /s qft)
46
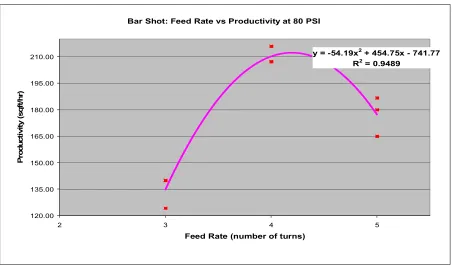
Figures D5, D6, and D7 show the productivity variation at pressures 80 PSI, 100 PSI, and 120 PSI, respectively, for Barshot. Figure D8 shows the parameter variation with pressure at maximum feed rate for Barshot.
Bar Shot: Feed Rate vs Productivity at 80 PSI
y = -54.19x2 + 454.75x - 741.77
R2 = 0.9489
120.00 135.00 150.00 165.00 180.00 195.00 210.00
2 3 4 5
Feed Rate (number of turns)
P
ro
d
u
cti
vi
ty
(s
q
ft/h
r)
47
Bar Shot: Feed Rate vs Productivity at 100 PSI
y = -55.966x2 + 443.3x - 673.64
R2 = 0.9251
125.00 145.00 165.00 185.00 205.00
2 3 4 5 6
Feed Rate (number of turns)
P ro d u ctiv ity (s q ft/h r)
Figure D6: Barshot Productivity vs. Feed Rate at 100PSI
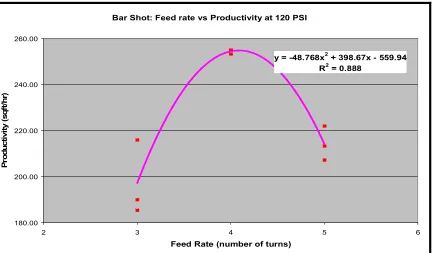
Bar Shot: Feed rate vs Productivity at 120 PSI
y = -48.768x2 + 398.67x - 559.94 R2 = 0.888
180.00 200.00 220.00 240.00 260.00
2 3 4 5 6
Feed Rate (number of turns)
Pr oduc ti v it y ( sqf t/ h r)
48
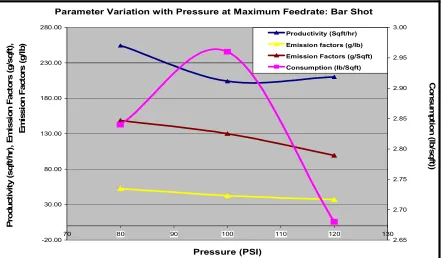
Parameter Variation with Pressure at Maximum Feedrate: Bar Shot
-20.00 30.00 80.00 130.00 180.00 230.00 280.00
70 80 90 100 110 120 130
Pressure (PSI) 2.65 2.70 2.75 2.80 2.85 2.90 2.95 3.00 Productivity (Sqft/hr)
Emission factors (g/lb)
Emission Factors (g/Sqft)
Consumption (lb/Sqft) C o n su m p tio n (l b /s q ft) ) P ro d u ct iv it y (s q ft/ h r) , E m is si o n F a ct o rs (g /s q ft) , E m is s io n F a ct o rs ( g /lb )
Figure D8: Parameter Variation with Pressure at Maximum Feed Rate for Barshot
49
Feed Rate vs Productivity at 80 PSI
Copper Slag y = -38.172x2 + 304.4x - 432.18
R2 = 0.9682
Bar Shot
y = -54.19x2 + 454.75x - 741.77
R2 = 0.9489
0.00 50.00 100.00 150.00 200.00
2 2.5 3 3.5 4 4.5 5 5.5
Feed Rate (number of turns)
P ro d u c tiv ity ( s q ft/h r) Copper Slag Bar Shot
Figure D9: Feed Rate vs. Productivity at 80 PSI for Copper Slag and Barshot
Feed Rate vs Productivity at 100 PSI
Bar Shot
y = -55.966x2 + 443.3x - 673.64
R2 = 0.9251
Copper Slag y = -44.152x2 + 364.8x - 560.15
R2 = 0.8747
50.00 80.00 110.00 140.00 170.00 200.00
2 2.5 3 3.5 4 4.5 5 5.5
Feed Rate (number of turns)
P ro d u ctiv ity (s q ft /h r) Copper Slag Bar Shot
50
Feed rate vs Productivity at 120 PSI
Copper Slag
y = -26.261x2 + 194.84x - 179.84 R2 = 0.8215
Bar Shot y = -48.768x2 + 398.67x - 559.94
R2 = 0.888
50.00 100.00 150.00 200.00 250.00 300.00
2 2.5 3 3.5 4 4.5 5 5.5
Feed Rate (number of turns)
Produ
cti
vity (sqft/h
r)
Copper Slag Bar Shot
Figure D11: Feed Rate vs. Productivity at 120 PSI for Copper Slag and Barshot