RESEARCH
Application of next-generation
sequencing to detect variants of drug-resistant
Mycobacterium tuberculosis
: genotype–
phenotype correlation
Dae‑Hyun Ko
1, Eun Jin Lee
2, Su‑Kyung Lee
2, Han‑Sung Kim
2, So Youn Shin
3, Jungwon Hyun
2, Jae‑Seok Kim
2,
Wonkeun Song
2and Hyun Soo Kim
2,4*Abstract
Background: Drug resistance in Mycobacterium tuberculosis (MTB) is a major health issue worldwide. Recently, next‑generation sequencing (NGS) technology has begun to be used to detect resistance genes of MTB. We aimed to assess the clinical usefulness of Ion S5 NGS TB research panel for detecting MTB resistance in Korean tuberculosis patients.
Methods: Mycobacterium tuberculosis with various drug resistance profiles including susceptible strains (N = 36) were isolated from clinical specimens. Nucleic acids were extracted from inactivated culture medium and underwent amplicon‑based NGS to detect resistance variants in eight genes (gyrA, rpoB, pncA, katG, eis, rpsL, embB, and inhA). Data from previous studies using the same panel were merged to yield pooled sensitivity and specificity values for detecting drug resistance compared to phenotype‑based methods.
Results: The sequencing reactions were successful for all samples. A total of 24 variants were considered to be related to resistance, and 6 of them were novel. Agreement between the phenotypic and genotypic results was excel‑ lent for isoniazid, rifampicin, and ethambutol, and was poor for streptomycin, amikacin, and kanamycin. The negative predictive values were greater than 97% for all drug classes, while the positive predictive values varied (44% to 100%). There was a possibility that common mutations could not be detected owing to the low coverage.
Conclusions: We successfully applied NGS for genetic analysis of drug resistances in MTB, as well as for susceptible strains. We obtained lists of polymorphisms and possible polymorphisms, which could be used as a guide for future tests applying NGS in mycobacteriology laboratories. When analyzing the results of NGS, coverage analysis of each samples for each gene and benign polymorphisms not related to drug resistance should be considered.
Keywords: Mycobacterium tuberculosis, Next‑generation sequencing, Drug resistance
© The Author(s) 2019. This article is distributed under the terms of the Creative Commons Attribution 4.0 International License (http://creat iveco mmons .org/licen ses/by/4.0/), which permits unrestricted use, distribution, and reproduction in any medium, provided you give appropriate credit to the original author(s) and the source, provide a link to the Creative Commons license, and indicate if changes were made. The Creative Commons Public Domain Dedication waiver (http://creat iveco mmons .org/ publi cdoma in/zero/1.0/) applies to the data made available in this article, unless otherwise stated.
Open Access
*Correspondence: [email protected]
4 Department of Laboratory Medicine, Hallym University Dongtan Sacred Heart Hospital, Hallym University College of Medicine, 7, Keunjaebong‑gil, Hwaseong‑Si, Gyeonggi‑Do 18450, South Korea
Background
Tuberculosis (Tb) is an infectious disease caused by
Mycobacterium tuberculosis (MTB), and is one of the most significant health issues problems worldwide. Approximately 10.4 million incident cases of Tb occurred in 2016; the majority of these were from the South-East Asian Region, followed by the African and Western Pacific Regions. Tb has caused more than 1.6 million deaths worldwide, and is the ninth leading cause of death [1]. Epidemiological control of Tb, especially drug-resist-ant strains, is one of the most challenging issues globally.
Various methods have been used to detect the suscep-tibility of MTB to various kinds of drugs, ranging from phenotyping assays to genotyping assays. For phenotyp-ing of drug resistance, proportional methods and abso-lute concentration methods can be used. Phenotypic methods usually require several weeks to several months to perform, as they require culturing MTB, which is a slow-growing microbe. To overcome this issue, geno-typic methods have been used to detect drug resistances in MTB. Line probe assays and the Xpert MTB/RIF assay (Cepheid, Sunnyvale, CA, USA) are representative geno-typing methods for detecting drug resistance [2].
There have been several reports using next-generation sequencing (NGS) technology to reveal drug resistance profiles in MTB [3–7]. Previous studies usually used only MTB that was resistant to one or more drugs, without including susceptible strains. In clinical practice, how-ever, it is highly unlikely to encounter such a situation. In other words, clinicians need to apply tests without prior information on the resistance status, and therefore need information on whether variants found in clinical speci-mens could be related or unrelated to resistance. In that sense, positive predictive value (PPV) and negative pre-dictive value (NPV), as well as sensitivity and specificity, are crucial performance parameters for application of NGS in clinical practice.
This study attempted to overcome these problems. The aim of this study was (1) to apply genetic analysis using NGS for susceptible MTB strains as well as for drug-resistant strains, and (2) to estimate the PPV and NPV of NGS for detection of drug resistance in clinical practice.
Methods Clinical specimens
This study was approved by the Institutional Review Board of Dongtan Sacred Heart hospital (approval num-ber: HDT NON2017-002). A total of 36 isolated tubercu-losis strains were collected at Hallym University Medical Center in 2017. All strains were isolated from clinical specimens. Drug susceptibility patterns were identified in the Korean Institute of Tuberculosis using the absolute
concentration method with Lowenstein–Jensen (LJ) medium. This method was performed using the M-kit (Multiplexing MTB drug susceptibility testing [DST] kit; Korean Institute of Tuberculosis, Osong, Korea), which can conduct DST on 16 drugs simultaneously [8, 9]. The critical concentrations for each drug were as fol-lows: isoniazid (INH) 0.2 μg/mL and 1.0 μg/mL, rifampin (RFP) 40 μg/mL, ethambutol (EMB) 2.0 μg/mL, strep-tomycin (SM) 10 μg/mL, amikacin (AMK) 30 μg/mL, kanamycin (KM) 30 μg/mL, ofloxacin (OFX) 4.0 μg/mL, moxifloxacin (MXF) 2.0 μg/mL, and levofloxacin (LEV) 2.0 μg/mL. The susceptibility for pyrazinamide (PZA) was determined using the pyrazinamidase activity test by Wayne’s method. Strain stock adjusted to McFarland No. 1 was tenfold diluted with phosphate buffered saline. Each 25 μL was inoculated for test wells using repeating pipette. The inoculated media was incubated at 37 °C. During the 1st week, culture conditions were evaluated once daily to identify any contamination. The final inter-pretation was made in the 4th week to determine the cul-ture status of the controls. Study strains were selected to represent various kinds of drug susceptibility patterns, from all-susceptible to extensively drug-resistant isolates.
Extraction of nucleic acids
Culture media containing the study strains were boiled at 100 °C for 30 min to inactivate the bacteria. After boil-ing, the culture media from the liquid culture bottle or colony scrape from the surface of Ogawa media were used for subsequent steps. Nucleic acids were extracted using QIAsymphony DSP Virus/Pathogen Mini kit (Qia-gen, Hilden, Germany) according to the manufacturer’s instructions.
PCR and sequencing
Target genes included in the study were as follows: katG
and inhA for INH resistance, rpoB for RFP resistance,
embB for EMB resistance, pncA for PZA resistance, rpsL
for SM resistance, eis for KM/AMK resistance, and gyrA
for fluoroquinolone (FQ) resistance. All coding regions of the eight target genes responsible for drug resistance were amplified and sequenced by the Ion AmpliSeq TB Research Panel using an IonS5 XL system (Thermo Fisher Scientific, Waltham, MA, USA) according to the manufacturer’s instructions for use [4, 7]. Information about the primers used can be obtained on the webpage provided by Thermo Fisher Scientific (https ://ampli seq. com/) or is available from the authors on request.
Scientific) and sequenced by an ion-semiconductor sequencer.
Bioinformatic analysis
Raw sequences from the instrument were aligned to the reference genome of MTB (Mycobacterium tuberculo-sis H37Rv, NC_000962.3) and variants were called using the Ion Report v.5.2 software (Thermo Fisher Scientific) and CLC Genomics Workbench 11 (Qiagen). Coverage was assessed using the coverage analysis plug-ins in the applications. Variants were selected for the final analysis if they were detected in both pipelines and suspected to cause non-synonymous changes (including nonsense, missense, and frame-shift mutations) in coding regions.
Estimated predictive values using pooled sensitivity and specificity
Data from two previous studies using the same panel that we used were merged with our data to calculate the pooled sensitivity and specificity [4, 7]. PPV and NPV were calculated using the prevalence of drug-resistant MTB [10].
Statistical analysis
Cohen’s kappa values were calculated to estimate the agreement between the phenotypic and genotypic results. Results with kappa values greater than 0.8 were considered to be almost perfect agreement. Variants were considered to be associated with a resistance phenotype if the P value was less than 0.05 in Fisher’s exact test (resistance) or if the variants were found only in resistant strains but not in susceptible strains (possible resistance). All statistical analyses were performed using MedCalc 18.6 (MedCalc Software, Ostend, Belgium).
Results
Phenotypic resistance patterns of specimens
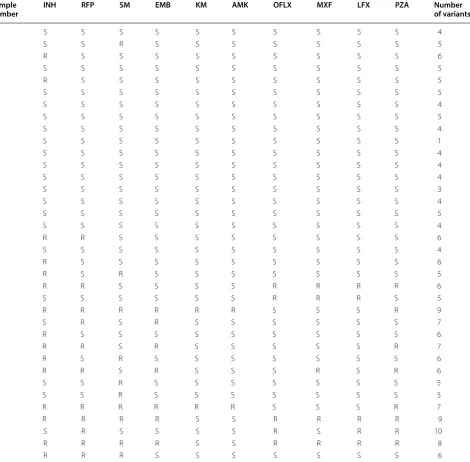
Drug resistance patterns determined by absolute concen-tration methods are displayed in Table 1. Half (n = 18) of the samples showed susceptibility to all drugs tested, while others showed resistance to one or more of the drugs.
Sequencing results
The sequencing experiments were successfully per-formed for all samples included in the study. Coverage at 1×, 20×, 100×, and 500× were 99.57% to 100%, 96.92%
to 100%, 85.71% to 100%, and 45.24% to 96.62%, respec-tively. Because all samples showed more than 96.92% for 20× coverage and 100% in 27 samples, our experiments
could be considered to cover virtually all target regions. Meanwhile, some samples showed low coverage for
specific regions in parts of target genes, which will be dis-cussed later.
Variant interpretation and genotype–phenotype correlation
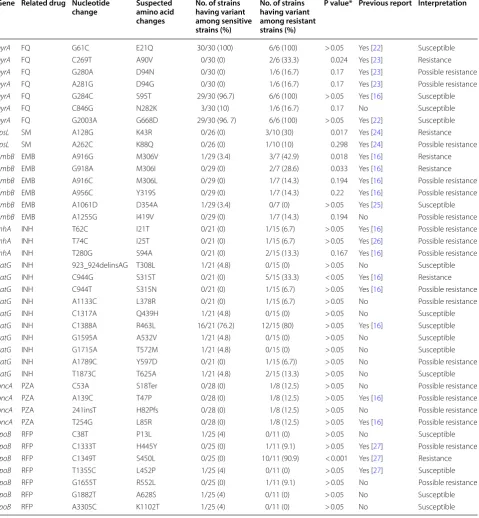
A total of 39 variants were found in the samples. The number of variants in each sample ranged from one to ten (Table 1). Table 2 shows the list of variants found in our study and their interpretations. In total, 24 variants were determined to be related to resistance to the cor-responding drugs (3 for gyrA, 2 for rpsL, 5 for embB, 3 for inhA, 3 for katG, 4 for pncA, and 3 for rpoB), and the remaining 15 variants were thought to be benign poly-morphisms. Among the variants associated with resist-ance phenotypes, six have not yet been reported (katG
L378R and Y597D; pncA S18Ter and H82Pfs; embB
I419V; and rpoB R552L).
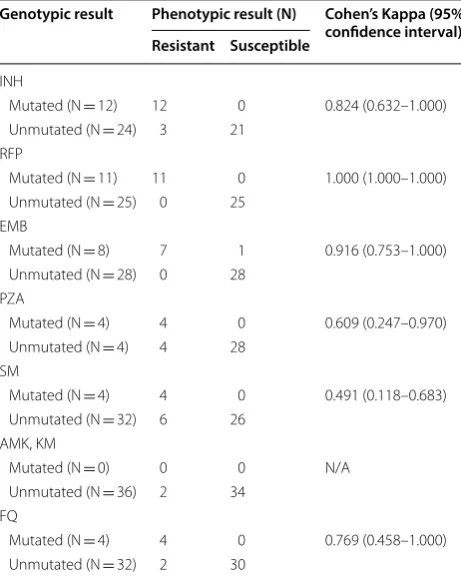
The overall agreements between genotypic and phe-notypic results are shown in Table 3. For INH, RFP, and EMB, the two tests showed almost perfect agreement (Cohen’s kappa of 0.824 to 1.000), while for SM, the agreement was poor (Cohen’s kappa of 0.491).
Estimated predictive values using pooled sensitivity and specificity
The calculated pooled sensitivity and specificity are dis-played in Table 4. Generally, NPVs were remarkably high (greater than 97%), while the PPVs were variable, ranging from 44% to 100%. The PPV for AMK/KM could not be estimated because the pooled sensitivity was 0%.
Discussion
One of the biggest issues with drug susceptibility tests for MTB is their turnaround time. Traditional methods such as absolute concentration or proportional methods usually take up to several weeks. This issue is inherent in phenotypic methods, and arises from the low growth rate of MTB. Genotypic methods have overcome this issue, with turnaround times of several days [2].
In this study, Cohen’s kappa values were calculated to assess the agreement between phenotypic and geno-typic test results. Resistance patterns for INH, RFP, and EMG showed almost perfect agreement between the two methods, although the agreements were poor for other drugs. In comparison to the results from previous studies, genotypic tests showed relatively poor perfor-mance for SM (0.491 versus 0.769, 0.746) [4, 7]. However, the 95% confidence interval was wide due to the small
number of specimens, and we therefore cannot conclude that our results were statistically different from those of other studies.
Fisher’s exact test was used for determine the clini-cal significance of each variant. Among 39 variants found in this study, six (gyrA c.C269T, rpsL c.A128G,
embB c.A916G and c.G918A, katG c.C944G and rpoB
c.C1349T) showed P values less than 0.05 and were des-ignated as ‘resistance’. ‘Possible resistance’ variants were Table 1 Drug resistance patterns and number of variants in the study samples
R resistance, S susceptible, INH isoniazid, RFP rifampin, SM streptomycin, EMB ethambutol, KM kanamycin, AMK amikacin, OFLX ofloxacin, MXL moxifloxacin, LFX
levofloxacin, PZA pyrazinamide Sample
number INH RFP SM EMB KM AMK OFLX MXF LFX PZA Number of variants
1 S S S S S S S S S S 4
2 S S R S S S S S S S 5
3 R S S S S S S S S S 6
5 S S S S S S S S S S 5
6 R S S S S S S S S S 5
7 S S S S S S S S S S 5
8 S S S S S S S S S S 4
9 S S S S S S S S S S 5
10 S S S S S S S S S S 4
12 S S S S S S S S S S 1
13 S S S S S S S S S S 4
14 S S S S S S S S S S 4
15 S S S S S S S S S S 4
16 S S S S S S S S S S 3
18 S S S S S S S S S S 4
19 S S S S S S S S S S 5
20 S S S S S S S S S S 4
21 R R S S S S S S S S 6
22 S S S S S S S S S S 4
23 R S S S S S S S S S 6
24 R S R S S S S S S S 5
25 R R S S S S R R R R 6
26 S S S S S S R R R S 5
27 R R R R R R S S S R 9
28 S R S R S S S S S S 7
29 R S S S S S S S S S 6
30 R R S R S S S S S R 7
31 R S R S S S S S S S 6
32 R R S R S S S R S R 6
33 S S R S S S S S S S 5
34 S S R S S S S S S S 5
35 R R R R R R S S S R 7
36 R R R R S S R R R R 9
37 S R S S S S R S R R 10
38 R R R R S S R R R R 8
determined as those found only in resistance strains and having P values greater than 0.05. Based on our find-ings, 18 variants (gyrA c.G180A and c.A281G, rpsL
c.A262C, embB c.A916C, c.A956C, and c.A1255G, inhA
c.T62C, c.T74C, and c.T280G, katG c.C944T, c.A1133C,
and c.A1789C, pncA c.C53A, c.A139C, c.241insT, and c.T254G, and rpoB c.C1333T and c.G1655T) were allo-cated in this category.
Most instances of RFP resistance come from muta-tions in the “rifampicin resistance-determining region” Table 2 List of variants found in study strains and their clinical significance
FQ fluoroquinolones, SM streptomycin, EMB ethambutol, INH isoniazid, PZA pyrazinamide, RFP rifampin * P value resulting from Fisher’s exact test
Gene Related drug Nucleotide
change Suspected amino acid changes
No. of strains having variant among sensitive strains (%)
No. of strains having variant among resistant strains (%)
P value* Previous report Interpretation
gyrA FQ G61C E21Q 30/30 (100) 6/6 (100) > 0.05 Yes [22] Susceptible
gyrA FQ C269T A90V 0/30 (0) 2/6 (33.3) 0.024 Yes [23] Resistance
gyrA FQ G280A D94N 0/30 (0) 1/6 (16.7) 0.17 Yes [23] Possible resistance
gyrA FQ A281G D94G 0/30 (0) 1/6 (16.7) 0.17 Yes [23] Possible resistance
gyrA FQ G284C S95T 29/30 (96.7) 6/6 (100) > 0.05 Yes [16] Susceptible
gyrA FQ C846G N282K 3/30 (10) 1/6 (16.7) 0.17 No Susceptible
gyrA FQ G2003A G668D 29/30 (96. 7) 6/6 (100) > 0.05 Yes [22] Susceptible
rpsL SM A128G K43R 0/26 (0) 3/10 (30) 0.017 Yes [24] Resistance
rpsL SM A262C K88Q 0/26 (0) 1/10 (10) 0.298 Yes [24] Possible resistance
embB EMB A916G M306V 1/29 (3.4) 3/7 (42.9) 0.018 Yes [16] Resistance
embB EMB G918A M306I 0/29 (0) 2/7 (28.6) 0.033 Yes [16] Resistance
embB EMB A916C M306L 0/29 (0) 1/7 (14.3) 0.194 Yes [16] Possible resistance
embB EMB A956C Y319S 0/29 (0) 1/7 (14.3) 0.22 Yes [16] Possible resistance
embB EMB A1061D D354A 1/29 (3.4) 0/7 (0) > 0.05 Yes [25] Susceptible
embB EMB A1255G I419V 0/29 (0) 1/7 (14.3) 0.194 No Possible resistance
inhA INH T62C I21T 0/21 (0) 1/15 (6.7) > 0.05 Yes [16] Possible resistance
inhA INH T74C I25T 0/21 (0) 1/15 (6.7) > 0.05 Yes [26] Possible resistance
inhA INH T280G S94A 0/21 (0) 2/15 (13.3) 0.167 Yes [16] Possible resistance
katG INH 923_924delinsAG T308L 1/21 (4.8) 0/15 (0) > 0.05 No Susceptible
katG INH C944G S315T 0/21 (0) 5/15 (33.3) < 0.05 Yes [16] Resistance
katG INH C944T S315N 0/21 (0) 1/15 (6.7) > 0.05 Yes [16] Possible resistance
katG INH A1133C L378R 0/21 (0) 1/15 (6.7) > 0.05 No Possible resistance
katG INH C1317A Q439H 1/21 (4.8) 0/15 (0) > 0.05 No Susceptible
katG INH C1388A R463L 16/21 (76.2) 12/15 (80) > 0.05 Yes [16] Susceptible
katG INH G1595A A532V 1/21 (4.8) 0/15 (0) > 0.05 No Susceptible
katG INH G1715A T572M 1/21 (4.8) 0/15 (0) > 0.05 No Susceptible
katG INH A1789C Y597D 0/21 (0) 1/15 (6.7)) > 0.05 No Possible resistance
katG INH T1873C T625A 1/21 (4.8) 2/15 (13.3) > 0.05 No Susceptible
pncA PZA C53A S18Ter 0/28 (0) 1/8 (12.5) > 0.05 No Possible resistance
pncA PZA A139C T47P 0/28 (0) 1/8 (12.5) > 0.05 Yes [16] Possible resistance
pncA PZA 241insT H82Pfs 0/28 (0) 1/8 (12.5) > 0.05 No Possible resistance
pncA PZA T254G L85R 0/28 (0) 1/8 (12.5) > 0.05 Yes [16] Possible resistance
rpoB RFP C38T P13L 1/25 (4) 0/11 (0) > 0.05 No Susceptible
rpoB RFP C1333T H445Y 0/25 (0) 1/11 (9.1) > 0.05 Yes [27] Possible resistance
rpoB RFP C1349T S450L 0/25 (0) 10/11 (90.9) < 0.001 Yes [27] Resistance
rpoB RFP T1355C L452P 1/25 (4) 0/11 (0) > 0.05 Yes [27] Susceptible
rpoB RFP G1655T R552L 0/25 (0) 1/11 (9.1) > 0.05 No Possible resistance
rpoB RFP G1882T A628S 1/25 (4) 0/11 (0) > 0.05 No Susceptible
of rpoB, spanning codons 507–533 [11, 12]. In contrast, the most frequent variant found in rpoB in our study was S450L (10 strains), and no variants were found in codons 507–533. This discrepancy was probably due to the rela-tively low coverage at these regions (< 100×) in many samples.
Two main causative genes for INH resistance are
katG and inhA. The most prevalent variant in this study was katG R463L, which was determined to be a benign
polymorphism. Among variants associated with the resistance phenotype, the katG S315T mutation was most frequently found, which is consistent with previous reports [11, 13]. However, the most prevalent mutation in the promoter region of inhA c.− 15C>T could not found because the Ion AmpliSeq panel did not cover the area [4, 7, 11]. This missing coverage and other genes responsi-ble for INH resistance, such as ahpC, might be the reason that no mutations were found in three strains with resist-ance phenotypes.
Codon 306 in embB is the most important area for EMB resistance [14, 15]. This study showed similar results: six out of seven resistant strains showed variants in codon 306. Interestingly, one strain with the M306V variant was determined to be susceptible to EMB in phe-notypic assays. This discrepancy might be due to a failure in the phenotypic assay or the presence of other mecha-nisms interacting with the embB mutations. We could not further investigate this issue, which should be the subject of subsequent studies.
We have found two novel loss-of-function mutations in pncA that are responsible for PZA resistance. There have already been many frame-shift mutations reported in the pncA gene [16]. Pyrazinamidase, the product of the pncA gene, is required to convert PZA to its active form, pyrazinoic acid [17]. Therefore, it is reasonable to consider that frame-shift mutations or nonsense muta-tions in the pncA gene cause drug resistance. No causa-tive mutations were detected in four out of eight resistant strains. This result is comparable to those of previous studies, suggesting the presence of mutations in pro-moter and/or other regulatory genes [17, 18].
Only four mutations could be found in rpsL, and none in eis. For rpsL, the most common mutation is K43R [11], which was also found in this study. Meanwhile, the agree-ments between phenotypic and genotypic results were regrettably poor for these drugs, which researchers and/ or doctors should be alert to when using this panel. There Table 3 Agreement between phenotypic and genotypic
test results
INH isoniazid, RFP rifampin, EMB ethambutol, PZA pyrazinamide, SM
streptomycin, AMK amikacin, KM kanamycin, FQ fluoroquinolones
Genotypic result Phenotypic result (N) Cohen’s Kappa (95% confidence interval) Resistant Susceptible
INH
Mutated (N = 12) 12 0 0.824 (0.632–1.000) Unmutated (N = 24) 3 21
RFP
Mutated (N = 11) 11 0 1.000 (1.000–1.000) Unmutated (N = 25) 0 25
EMB
Mutated (N = 8) 7 1 0.916 (0.753–1.000) Unmutated (N = 28) 0 28
PZA
Mutated (N = 4) 4 0 0.609 (0.247–0.970) Unmutated (N = 4) 4 28
SM
Mutated (N = 4) 4 0 0.491 (0.118–0.683) Unmutated (N = 32) 6 26
AMK, KM
Mutated (N = 0) 0 0 N/A Unmutated (N = 36) 2 34
FQ
Mutated (N = 4) 4 0 0.769 (0.458–1.000) Unmutated (N = 32) 2 30
Table 4 Pooled analytical performances of the Ion AmpliSeq TB Research Panel for detecting of drug resistances
CI confidence interval, PPV positive predictive value, NPV negative predictive value, INH isoniazid, RFP rifampin, EMB ethambutol, PZA pyrazinamide, SM streptomycin,
AMK amikacin, KM kanamycin, FQ fluoroquinolones, N/A not applicable Drug Pooled sensitivity (%)
(95% CI) Pooled specificity (%) (95% CI) Prevalence of drug resistance [10] (%) PPV (%) (95% CI) NPV (%) (95% CI)
are many other genes responsible for resistance to these drugs, such as rrs, which might explain the poor perfor-mances [19].
FQ resistance arises from mutations in gyrA and/or
gyrB, with codons 90 and 94 in gyrA most frequently involved [20, 21]. Our data showed similar results, and all variants other than those in codons 90 and 94 were deter-mined to be benign polymorphisms. Specifically, three variants, E21Q, S95T, and G668D, were found in almost every strain, suggesting the existence of common poly-morphisms in MTB in Korea.
We estimated pooled sensitivity and specificity using combined data from this study and previous studies [4, 7]. The NPVs ranged from 97.8 to 99.8%, while the PPVs were variable, from 43.8 to 100%. These data suggested that NGS can be used as a tool to rule out drug resistance before phenotypic results are available.
Conclusions
In conclusion, we successfully applied NGS to the genetic analysis of drug resistance in MTB, as well as in suscepti-ble strains. The Ion AmpliSeq Tb Panel showed satisfac-tory specificity and NPV and can therefore be used for early exclusion of resistance in MTB. The panel need to be enhanced to increase the sensitivity and PPV. A useful result of this study was a list of variants with their clini-cal significance: six variants with confirmed resistance, 18 with possible resistance, and 15 that were susceptible. This list could be used as a guide in future applications of NGS in mycobacteriology laboratories. When analyz-ing NGS results, the coverage analysis of each sample for each gene, as well as benign polymorphisms not related to drug resistance, should be considered.
Abbreviations
Tb: tuberculosis; MTB: Mycobacterium tuberculosis; NGS: next‑generation sequencing; INH: isoniazid; RFP: rifampin; EMB: ethambutol; SM: streptomy‑ cin; AMK: amikacin; KM: kanamycin; OFX: ofloxacin; MXF: moxifloxacin; LEV: levofloxacin; PZA: pyrazinamide; FQ: fluoroquinolone; PPV: positive predictive value; NPV: negative predictive value.
Authors’ contributions
HSK and DHK designed the experiments; SKL performed the experiments; EJL, HSK, SYS, JH, JSK, WS wrote or helped to draft the manuscript. All authors read and approved the final manuscript.
Author details
1 Department of Laboratory Medicine, University of Ulsan College of Medicine and Asan Medical Center, Seoul, South Korea. 2 Department of Laboratory Medicine, Hallym University College of Medicine, Chuncheon, South Korea. 3 Korean Institute of Tuberculosis, Cheongju, South Korea. 4 Department of Laboratory Medicine, Hallym University Dongtan Sacred Heart Hospital, Hallym University College of Medicine, 7, Keunjaebong‑gil, Hwaseong‑Si, Gyeonggi‑Do 18450, South Korea.
Acknowledgements
We thank Tae‑Young Kang and Mi‑Young Lee for technical assistance.
Competing interests
The authors declare that they have no competing interests.
Availability of data and materials
The datasets used and/or analyzed during the current study are available from the corresponding author on reasonable request.
Consent for publication
Not applicable.
Ethics approval and consent to participate
This study was approved by the Institutional Review Board of Dongtan Sacred Heart hospital [approval number: HDT NON2017‑002).].
Funding
Not applicable.
Publisher’s Note
Springer Nature remains neutral with regard to jurisdictional claims in pub‑ lished maps and institutional affiliations.
Received: 7 August 2018 Accepted: 26 December 2018
References
1. Williamson LM. Correcting haemostasis. Vox Sang. 2004;87(Suppl 1):51–7. 2. Schon T, Miotto P, Koser CU, Viveiros M, Bottger E, Cambau E.
Mycobac-terium tuberculosis drug‑resistance testing: challenges, recent develop‑ ments and perspectives. Clin Microbiol Infect. 2017;23(3):154–60. 3. Papaventsis D, Casali N, Kontsevaya I, Drobniewski F, Cirillo DM,
Nikolayevskyy V. Whole genome sequencing of Mycobacterium tubercu-losis for detection of drug resistance: a systematic review. Clin Microbiol Infect. 2017;23(2):61–8.
4. Park J, Shin SY, Kim K, Park K, Shin S, Ihm C. Determining genotypic drug resistance by ion semiconductor sequencing with the ion AmpliSeq TB panel in multidrug‑resistant Mycobacterium tuberculosis isolates. Ann Lab Med. 2018;38(4):316–23.
5. Maningi NE, Daum LT, Rodriguez JD, Mphahlele M, Peters RP, Fischer GW, et al. Improved detection by next‑generation sequencing of pyrazina‑ mide resistance in Mycobacterium tuberculosis isolates. J Clin Microbiol. 2015;53(12):3779–83.
6. Colman RE, Anderson J, Lemmer D, Lehmkuhl E, Georghiou SB, Heaton H, et al. Rapid drug susceptibility testing of drug‑resistant Mycobac-terium tuberculosis isolates directly from clinical samples by use of amplicon sequencing: a proof‑of‑concept study. J Clin Microbiol. 2016;54(8):2058–67.
7. Park J, Jang W, Kim M, Kim Y, Shin SY, Park K, et al. Molecular drug resist‑ ance profiles of Mycobacterium tuberculosis from sputum specimens using ion semiconductor sequencing. J Microbiol Methods. 2018;145:1–6. 8. Kim CK, Joo YT, Lee EP, Park YK, Kim HJ, Kim SJ. Simple, direct drug suscep‑
tibility testing technique for diagnosis of drug‑resistant tuberculosis in resource‑poor settings. Int J Tuberc Lung Dis. 2013;17(9):1212–6. 9. Kim CK, Shin SY, Kim HJ, Lee K. Drug resistance patterns of multidrug‑ and
extensively drug‑resistant tuberculosis in Korea: amplification of resist‑ ance to oral second‑line drugs. Ann Lab Med. 2017;37(4):323–6. 10. Lee HY, Lee J, Lee YS, Kim MY, Lee HK, Lee YM, et al. Drug‑resistance pat‑
tern of Mycobacterium tuberculosis strains from patients with pulmonary and extrapulmonary tuberculosis during 2006 to 2013 in a Korean tertiary medical center. Korean J Intern Med. 2015;30(3):325–34.
11. Palomino JC, Martin A. Drug resistance mechanisms in Mycobacterium tuberculosis. Antibiotics (Basel). 2014;3(3):317–40.
12. Ramaswamy S, Musser JM. Molecular genetic basis of antimicrobial agent resistance in Mycobacterium tuberculosis: 1998 update. Tuber Lung Dis. 1998;79(1):3–29.
13. Vilcheze C, Jacobs WR Jr. The mechanism of isoniazid killing: clarity through the scope of genetics. Annu Rev Microbiol. 2007;61:35–50. 14. Sreevatsan S, Stockbauer KE, Pan X, Kreiswirth BN, Moghazeh SL, Jacobs
•fast, convenient online submission
•
thorough peer review by experienced researchers in your field
• rapid publication on acceptance
• support for research data, including large and complex data types
•
gold Open Access which fosters wider collaboration and increased citations maximum visibility for your research: over 100M website views per year
•
At BMC, research is always in progress.
Learn more biomedcentral.com/submissions
Ready to submit your research? Choose BMC and benefit from:
critical role of embB mutations. Antimicrob Agents Chemother. 1997;41(8):1677–81.
15. Telenti A, Philipp WJ, Sreevatsan S, Bernasconi C, Stockbauer KE, Wieles B, et al. The emb operon, a gene cluster of Mycobacterium tuberculosis involved in resistance to ethambutol. Nat Med. 1997;3(5):567–70. 16. Sandgren A, Strong M, Muthukrishnan P, Weiner BK, Church GM, Mur‑
ray MB. Tuberculosis drug resistance mutation database. PLoS Med. 2009;6(2):e2.
17. Jureen P, Werngren J, Toro JC, Hoffner S. Pyrazinamide resistance and pncA gene mutations in Mycobacterium tuberculosis. Antimicrob Agents Chemother. 2008;52(5):1852–4.
18. Cheng SJ, Thibert L, Sanchez T, Heifets L, Zhang Y. pncA mutations as a major mechanism of pyrazinamide resistance in Mycobacterium tuber-culosis: spread of a monoresistant strain in Quebec. Canada. Antimicrob Agents Chemother. 2000;44(3):528–32.
19. Gillespie SH. Evolution of drug resistance in Mycobacterium tuberculosis: clinical and molecular perspective. Antimicrob Agents Chemother. 2002;46(2):267–74.
20. Sun Z, Zhang J, Zhang X, Wang S, Zhang Y, Li C. Comparison of gyrA gene mutations between laboratory‑selected ofloxacin‑resistant Mycobac-terium tuberculosis strains and clinical isolates. Int J Antimicrob Agents. 2008;31(2):115–21.
21. Cheng AF, Yew WW, Chan EW, Chin ML, Hui MM, Chan RC. Multiplex PCR amplimer conformation analysis for rapid detection of gyrA mutations
in fluoroquinolone‑resistant Mycobacterium tuberculosis clinical isolates. Antimicrob Agents Chemother. 2004;48(2):596–601.
22. Lau RW, Ho PL, Kao RY, Yew WW, Lau TC, Cheng VC, et al. Molecular char‑ acterization of fluoroquinolone resistance in Mycobacterium tuberculosis: functional analysis of gyrA mutation at position 74. Antimicrob Agents Chemother. 2011;55(2):608–14.
23. Chien JY, Chiu WY, Chien ST, Chiang CJ, Yu CJ, Hsueh PR. Mutations in gyrA and gyrB among fluoroquinolone‑ and multidrug‑resistant Mycobacterium tuberculosis isolates. Antimicrob Agents Chemother. 2016;60(4):2090–6.
24. Ballif M, Harino P, Ley S, Coscolla M, Niemann S, Carter R, et al. Drug resistance‑conferring mutations in Mycobacterium tuberculosis from Madang, Papua New Guinea. BMC Microbiol. 2012;12:191.
25. Brossier F, Sougakoff W, Bernard C, Petrou M, Adeyema K, Pham A, et al. Molecular analysis of the embCAB locus and embR gene involved in ethambutol resistance in clinical isolates of Mycobacterium tuberculosis in France. Antimicrob Agents Chemother. 2015;59(8):4800–8.
26. Luo T, Zhao M, Li X, Xu P, Gui X, Pickerill S, et al. Selection of mutations to detect multidrug‑resistant Mycobacterium tuberculosis strains in Shang‑ hai. China. Antimicrob Agents Chemother. 2010;54(3):1075–81. 27. Caws M, Duy PM, Tho DQ, Lan NT, Hoa DV, Farrar J. Mutations prevalent