DEMOGRAPHIC RESEARCH
VOLUME 35, ARTICLE 16, PAGES 455
−
470
PUBLISHED 24 AUGUST 2016
http://www.demographic-research.org/Volumes/Vol35/16/ DOI: 10.4054/DemRes.2016.35.16
Descriptive Finding
Fifty years of change updated: Cross-national
gender convergence in housework
Evrim Altintas
Oriel Sullivan
©2016 Evrim Altintas & Oriel Sullivan.
This open-access work is published under the terms of the Creative Commons Attribution NonCommercial License 2.0 Germany, which permits use, reproduction & distribution in any medium for non-commercial purposes, provided the original author(s) and source are given credit.
1 Introduction 456
2 Data 456
3 Methods 459
4 Results 460
5 Conclusion 466
Fifty years of change updated:
Cross-national gender convergence in housework
Evrim Altintas1Oriel Sullivan2
Abstract
BACKGROUND
Gendered trends in housework provide an important insight into changing gender inequality. In particular, they shed light on the debate over the stalling of the ‘gender revolution’. Additionally, the gender division of housework is significantly related to couple well-being; disagreements over housework are among the major sources of marital conflict.
OBJECTIVE
The objective is to bring the evidence on gendered trends in time spent on core housework up to date, and to investigate cross-national variation in those trends. METHODS
Using 66 time use surveys from 19 countries, we apply a intercept, random-slope model to investigate half a century of change in gender differences in housework (1961–2011).
RESULTS
There is a general movement in the direction of greater gender equality, but with significant country differences in both the level and the pace of convergence. Specifically, there was a slowing of gender convergence from the late 1980s in those countries where men and women’s time in housework was already more equal, with steeper gender convergence continuing in those countries where the gender division of housework was less equal.
CONCLUSIONS
Our findings support the view that despite short-term stalls, slow-downs, and even reverses, as well as important differences in national policy contexts, the overall cross-national picture shows a continuing trend towards greater gender equality in the performance of housework.
1. Introduction
In this paper we update previous cross-national evidence on the gender division of housework. Due to the usual gap that occurs between the collection of survey data and their public launch, most research on this topic published up to the end of the first decade of the 21st century ‒ including some influential decade reviews (Bianchi and
Milkie 2010; Lachance-Grzela and Bouchard 2010) – relied on research based on data on housework time from the years up to 2005–2006 at the latest (although Bianchi et al. 2012 updated the US time use data to 2010).
Using the Multinational Time Use Study (Fisher and Gershuny 2013), we bring the cross-national evidence up to date by including data from 10 additional surveys from 9 countries for the period 2005–2011 (Australia, Canada, Finland, France, Italy, Netherlands, Spain, U.K., and U.S.A.).
The study of housework is interesting for three main reasons. Firstly, it is a routine, repetitive and disliked activity, which means that the relative time spouses spend on housework has long been recognized as an important indicator of marital power (Davies and Greenstein 2013). We use core housework (cleaning, cooking, and clothes care) as our measure in these analyses because these are both the most disliked domestic labour activities and the most traditionally feminine. They have, therefore, been the ones that have been most resistant to change. Since the burden of responsibility for these activities traditionally falls on women, this can have negative consequences for their work-life balance and their sense of time pressure. Secondly, the division of housework is significantly related to couples’ well-being. Disagreement over housework is one of the main sources of marital conflict (Ruppaner 2010; van der Lippe, Voorpostel, and Hewitt 2014). Between 36% (Portugal) and 90% (Finland) of married/cohabiting couples across Europe report having disagreements over housework (van der Lippe, Voorpostel, and Hewitt 2014). Thirdly, housework has been an important measure in the debate over the stalling or not of the ‘gender revolution’ (e.g., England 2010). The inclusion of more recent surveys in our analyses allows us to bring the cross-national evidence underpinning the ‘convergence versus stall’ debate in the gender division of housework up to the end of the first decade of the current century.
2. Data
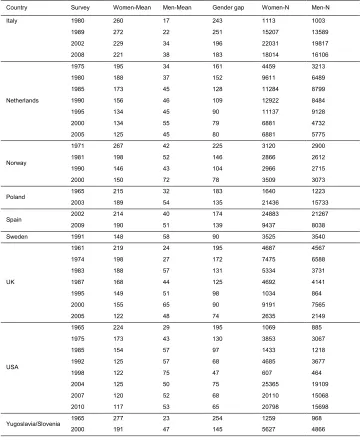
from the 1960s to the current day. We use data from 19 countries between 1961 and 2011, chosen on the basis of their data series and quality. The sample is limited to adults aged 19 or older. Table 1 shows the full list of surveys included in the data, sample sizes, and average minutes spent on core housework by men and women.
Table 1: Minutes in core housework: Women and men by country and year
Country Survey Women-Mean Men-Mean Gender gap Women-N Men-N
Australia
1974 214 20 194 807 628
1987 175 42 132 1489 1337
1992 165 49 116 6583 5944
1997 165 56 109 6834 6252
2006 157 64 93 6618 5861
Belgium 1965 254 17 237 979 959
Canada
1971 194 34 160 1166 869
1986 147 37 110 4933 3978
1992 149 43 106 4584 3628
1998 137 51 86 5557 4499
2005 118 51 67 10335 8015
2010 119 55 64 8325 6304
Czechoslovakia 1965 239 37 202 894 774
Denmark 1987 129 38 90 1643 1637
2001 122 59 63 3286 3020
Finland
1979 155 29 126 4820 4438
1987 145 40 105 6421 5855
1999 128 48 80 4462 3860
2009 125 57 68 3393 2987
France
1966 242 26 216 1533 1553
1974 216 44 171 3542 2865
1998 176 40 136 7496 6615
2009 147 52 95 14445 12342
Germany
1965 242 17 225 2117 1570
1991 200 55 145 11510 10234
2001 150 49 100 15153 12866
Hungary 1965 271 23 248 1038 951
1977 210 38 172 2563 2100
Table 1: (Continued)
Country Survey Women-Mean Men-Mean Gender gap Women-N Men-N
Italy 1980 260 17 243 1113 1003
1989 272 22 251 15207 13589
2002 229 34 196 22031 19817
2008 221 38 183 18014 16106
Netherlands
1975 195 34 161 4459 3213
1980 188 37 152 9611 6489
1985 173 45 128 11284 8799
1990 156 46 109 12922 8484
1995 134 45 90 11137 9128
2000 134 55 79 6881 4732
2005 125 45 80 6881 5775
Norway
1971 267 42 225 3120 2900
1981 198 52 146 2866 2612
1990 146 43 104 2966 2715
2000 150 72 78 3509 3073
Poland 1965 215 32 183 1640 1223
2003 189 54 135 21436 15733
Spain 2002 214 40 174 24883 21267
2009 190 51 139 9437 8038
Sweden 1991 148 58 90 3525 3540
UK
1961 219 24 195 4687 4567
1974 198 27 172 7475 6588
1983 188 57 131 5334 3731
1987 168 44 125 4692 4141
1995 149 51 98 1034 864
2000 155 65 90 9191 7565
2005 122 48 74 2635 2149
USA
1965 224 29 195 1069 885
1975 173 43 130 3853 3067
1985 154 57 97 1433 1218
1992 125 57 68 4685 3677
1998 122 75 47 607 464
2004 125 50 75 25365 19109
2007 120 52 68 20110 15068
2010 117 53 65 20798 15698
Yugoslavia/Slovenia 1965 277 23 254 1259 968
2000 191 47 145 5627 4866
Notes: N-refers to number of diaries. Weights are applied to account for sampling design and day distribution.
In the analyses that follow, housework refers to the most disliked, routine, and traditionally feminine-defined housework activities of laundry and cleaning, food preparation, and cooking. Household chores that are traditionally masculine or gender-neutral, such as home maintenance, car repairs, or shopping, are excluded.
3. Methods
We first calculated average minutes spent on core housework by men and women across countries (see Table 1). We then applied multilevel models estimating the effect of gender, controlling for relevant socio-demographic factors. The baseline model is a random intercept model, where individuals are nested in surveys (country‒year), showing the effect of being a woman on the time spent on core housework with no socio-demographic controls:
𝑌𝑖0=𝛽𝑗0[𝑖]+𝛽1𝑑𝑖𝑎𝑟𝑦𝑑𝑎𝑦𝑖+𝛽2𝑔𝑒𝑛𝑑𝑒𝑟𝑖+𝜀𝑖, where
𝜀𝑖 ~ 𝑁(0,𝜎)
𝛽𝑗0=𝛾00+𝜉0,𝑗, where
𝜉𝑗 ~ 𝑁(0,𝜐)
In a second model we add controls for demographic and socio-economic variables, namely age, educational attainment, employment and marital status, number of children under age 18 in the household, and the presence of a child under age 5 in the household. The third model is a random-intercept, random-slope model in which we allow the slope of being woman to vary across surveys (country‒year). The model shows the extent to which the effect of gender on minutes spent on core housework varies across surveys:
𝑌𝑖0=𝛽𝑗0[𝑖] +𝛽1𝑑𝑖𝑎𝑟𝑦𝑑𝑎𝑦𝑖+𝛽𝑗2[𝑖]𝑔𝑒𝑛𝑑𝑒𝑟𝑖+𝛽3𝑎𝑔𝑒𝑖+ 𝛽4𝑒𝑑𝑢𝑐𝑎𝑡𝑖𝑜𝑛𝑖+ 𝛽5𝑒𝑚𝑝𝑙𝑜𝑦𝑚𝑒𝑛𝑡𝑖+
𝛽6𝑐𝑖𝑣𝑖𝑐𝑠𝑡𝑎𝑡𝑢𝑠𝑖+𝛽7𝑛𝑢𝑚𝑏𝑒𝑟𝑜𝑓𝑐ℎ𝑖𝑙𝑑𝑟𝑒𝑛𝑖+𝛽8𝑐ℎ𝑖𝑙𝑑𝑢𝑛𝑑𝑒𝑟5𝑖+𝜀𝑖, where
𝜀𝑖 ~ 𝑁(0,𝜎 )
𝛽𝑗2=𝛾20+𝜉2,𝑗, where
�𝜉0𝜉,𝑗
2,𝑗�~𝑁(0,Є)
We performed three main robustness checks on our modelling procedures to take account of variation across countries and time in survey design. As stated above, for our multilevel models we nested individuals within surveys (country‒year). However, since some surveys collected more than one diary per respondent and more than one respondent per household, a five-level structure of diaries nested within individuals, nested within households, nested within years, nested within countries would more accurately reflect the hierarchical structure of the data. But five-level models create substantial estimation problems. We therefore replicated the analysis by randomly choosing one diary per individual in all countries. There were no noticeable changes to the results (a slight increase in the standard errors was not sufficiently large to affect levels of statistical significance for any of the coefficients).
Secondly, there were inevitably some surveys for which certain variables were missing (1.6% of cases were missing on one or more of the variables). These cases were list-wise deleted. We replicated the analysis by including them and coding them as missing. However, we did not find that this resulted in any substantive change in our findings (not shown but available on request).
Thirdly, there are some surveys for which certain variables did not exist. These surveys are included and coded as ‘not available’ for those variables. Limiting the sample to those surveys where we have full information does not change the results (refer to the supplied code for further details; results not shown but available upon request).
4. Results
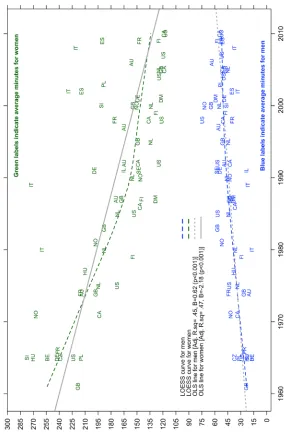
Firstly, women’s core housework continues to decrease, and men’s to increase – although less steeply than the decrease for women. Secondly, the gap between women and men in the performance of housework persists at the end of the first decade of the 21st century, although it is narrowing. Thirdly, there is substantial cross-national
variation evident in the data for women, but much less so in those for men. This variation among women is interpretable in relation to existing public policy regime typologies, reflecting differences in gender ideologies and practice (e.g., Esping-Andersen 2009). For instance, it is clear that, right up until the end of the first decade of the 21st century, women from the Mediterranean countries (Italy and Spain) continued
to do far more housework than women in other countries. Although the cross-national variation is much less for men, Italian men also stand out below the regression lines as consistently doing less housework than men from other countries.
There is little difference between the two fitted regression lines for men. By contrast, for women the LOESS curve dips in the middle of the period, then straightens out somewhat towards the end. Through not constraining the regression line to a linear form, it is possible to see that cross-nationally there was a period of steeper decline in women’s housework time, lasting up to about 1990, followed by a flattening out of the curve. At the overall level this flattening lends support to the idea of a stalling in the process of gender convergence, a stalling that is primarily created by a levelling-off of women’s housework time.
While there are features of interest in the regression lines shown in Figure 1, they do not take into account the possible effects of other demographic trends that may be related to overall-level changes in housework time, such as declining family size and increased variation in family structures, or of socio-economic variables such as educational level and employment status. For this reason we next present multilevel models taking into account the effect of various demographic and socio-economic variables.
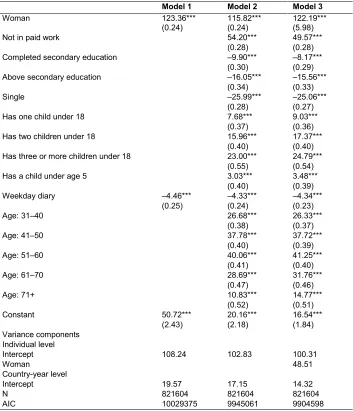
Table 2: Multilevel models of minutes spent on core housework
Model 1 Model 2 Model 3
Woman 123.36*** 115.82*** 122.19*** (0.24) (0.24) (5.98) Not in paid work 54.20*** 49.57***
(0.28) (0.28) Completed secondary education –9.90*** –8.17***
(0.30) (0.29) Above secondary education –16.05*** –15.56***
(0.34) (0.33)
Single –25.99*** –25.06***
(0.28) (0.27) Has one child under 18 7.68*** 9.03***
(0.37) (0.36) Has two children under 18 15.96*** 17.37***
(0.40) (0.40) Has three or more children under 18 23.00*** 24.79***
(0.55) (0.54) Has a child under age 5 3.03*** 3.48***
(0.40) (0.39) Weekday diary –4.46*** –4.33*** –4.34***
(0.25) (0.24) (0.23)
Age: 31‒40 26.68*** 26.33***
(0.38) (0.37)
Age: 41‒50 37.78*** 37.72***
(0.40) (0.39)
Age: 51‒60 40.06*** 41.25***
(0.41) (0.40)
Age: 61‒70 28.69*** 31.76***
(0.47) (0.46)
Age: 71+ 10.83*** 14.77***
(0.52) (0.51) Constant 50.72*** 20.16*** 16.54***
(2.43) (2.18) (1.84)
Variance components Individual level
Intercept 108.24 102.83 100.31
Woman 48.51
Country-year level
Intercept 19.57 17.15 14.32
N 821604 821604 821604
AIC 10029375 9945061 9904598
Notes: *** p<.01; ** p<0.05; * p<.10
the slope of gender to vary by survey (country-year). As expected, the gender gap in housework varies substantially across both countries and time. In order to more clearly interpret the findings of this final model, in Figure 2 we plot the coefficient of gender for each survey (country-year). This graphical presentation of the pattern of gender convergence in housework on a country-by-country basis allows us to discern some important cross-national variation, net of other socio-demographic factors. This variation can be observed both in the level and in the pace of change over time. Most obviously, in relation to level, it is clear that in the countries of Southern Europe (Italy and Spain), the ex-Soviet bloc (Poland and Yugoslavia/Slovenia), and continental Europe (France and Germany) women did a relatively high share of the housework across most or all of the 50-year period. An interesting distinction is also evident in the different pace of change between these countries and others in which the gender division of housework has been more equal across the period. This distinction is in line with the findings of Geist and Cohen (2011), whose analysis of International Social Survey Program data between 1994 and 2002 showed that more traditional countries move faster towards egalitarianism in routine housework over time.
While the trends for the countries referred to above (where the gender division of housework is more unequal) show steep declines in that inequality in the later part of the period covered, most of the lines for those countries that cluster in the lower part of the graph (where the gender division of housework is more equal) tend to be more curvilinear in shape: steeper in the earlier part of the period, and flattening off gradually towards the later part. This slowing in trajectory occurs approximately from the late 1980s – well before the mid-point of the observed period. This shape of curve is characteristic of the Anglophone countries (Canada, Australia, United States) and some Northern European countries such as Finland and the Netherlands (the lines for the United Kingdom and Norway maintain a more consistent trajectory, but their final levels are more in line with this second group of countries than with the first.) The slowing in convergence is particularly clear in the case of the U.S.A., where the predicted line representing the relative effect of being a woman dips to a low in the late 1990s before increasing again in the direction of greater inequality. (While this recent movement in the US in the direction of greater inequality has been referred to as evidence for a stall in gender convergence, we would note that several sources over the past decade have questioned the results of the US data from the 1980s and 1990s – see, for example, Allard et al. 2007; Bianchi et al. 2012; Egerton et al. 2005).
5. Conclusion
References
Allard, M.D., Bianchi, S.M., Stewart, J., and Wight, V.R. (2007). Comparing childcare measures in the ATUS and earlier time-diary studies. Monthly Labor Review 130: 27–36.
Bianchi, S.M. and Milkie, M.A. (2010). Work and family research in the first decade of the 21st century. Journal of Marriage and Family 72: 705–725. doi:10.1111/j.1
741-3737.2010.00726.x.
Bianchi, S.M., Robinson, J.P., and Milkie, M.A. (2006). Changing rhythms of American family life. New York: Russell Sage Foundation.
Bianchi, S.M., Sayer, L.C., Milkie, M.A., and Robinson, J.P. (2012). Housework: Who did, does or will do it, and how much does it matter? Social Forces 91(1): 55– 63. doi:10.1093/sf/sos120.
Bianchi, S.M., Nazio, T., Lesnard, L., and Raley, S. (2014). Gender and time allocation of cohabiting and married women and men in France, Italy, and the United States. Demographic Research 31(8): 183–216. doi:10.4054/DemRes.2014.31.8. Braun, M. and Scott, J. (2009). Changing public views of gender roles in seven nations,
1988–2002. In: Haller, M., Jowell, R., and Smith, T.W. (eds.) The international social survey programme 1984–2009: Charting the globe. Oxford: Routledge: 358–377.
Davis, S.N. and Greenstein, T.N. (2013). Why study housework? Cleaning as a window into power in couples. Journal of Family Theory & Review 5: 63–71. doi:10.111 1/jftr.12004.
Egerton, M., Fisher K., and Gershuny, J. (2005). American time use 1965–2003: The construction of a historical comparative file and consideration of its usefulness in the construction of extended national accounts for the USA. ISER Working Paper 2005-28.
England, P. (2010). The gender revolution: Uneven and stalled. Gender & Society 24(2): 24–149. doi:10.1177/0891243210361475.
Esping-Andersen, G. (2009). The incomplete revolution: Adapting to women’s new roles. Cambridge: Polity Press.
Fisher, K. and Gershuny, J. (2013). Multinational time use study user’s guide and documentation. Oxford: Centre for Time Use Research.
Geist, C. and Cohen, P. (2011). Headed toward equality? Housework change in comparative perspective. Journal of Marriage and Family 73(4): 832–844.
doi:10.1111/j.1741-3737.2011.00850.x.
Kan, M.Y., Sullivan, O., and Gershuny J. (2011). Gender convergence in domestic work: Discerning the effect of interactional and institutional barriers from large-scale data. Sociology 45(2): 234–251. doi:10.1177/0038038510394014.
Lachance-Grzela, M. and Bouchard, G. (2010). Why do women do the lion’s share of housework; a decade of research. Sex Roles 63: 767–780. doi:10.1007/s11199-010-9797-z.
Neilsson, J. and Stanfors, M. (2014). It’s about time! Gender, parenthood, and household divisions of labor under different welfare regimes. Journal of Family Issues 35(8): 1066–1088. doi:10.1177/0192513X14522240.
Pampel, F. (2011). Cohort change, diffusion, and support for gender egalitarianism in cross-national perspective. Demographic Research 25(21): 667–694. doi:10.40 54/DemRes.2011.25.21.
Robinson, J.P. and Godbey, G. (1997). Time for life: The surprising ways Americans use their time. University Park: Pennsylvania State University Press.
Ruppaner, L. (2010) Conflict and housework: Does country context status matter? European Sociological Review 26(5): 557–570. doi:10.1093/esr/jcp038.
Stanfors, M. and Goldscheider, F. (2015). The forest and the trees: Industrialization, demographic change, and the ongoing gender revolution in Sweden and the United States, 1870–2010. Stockholm research reports in demography 2015: 18. University of Stockholm.
Sullivan, O., Billari F., and Altintas, E. (2015). Fathers’ changing contributions to child care and domestic work in very low-fertility countries: The effect of education. Journal of Family Issues 35(8): 1048–1065. doi:10.1177/0192513X14522241. van der Lippe, T., Voorpostel, M., and Hewitt, B. (2014) Disagreements among
R packages used
R Core Team (2015). R: A language and environment for statistical computing.R Foundation for Statistical Computing, Vienna, Austria.
_________________________________________________
Dowle M., Srinivasan A., Short T., and Lianoglou S. with contributions from Saporta R. and Antonyan E.(2015). data.table: Extension of Data.frame. R package version 1.9.6.
Gelman A. and Su Y. (2015). arm: Data Analysis Using Regression and Multilevel/Hierarchical Models. R package version 1.8‒6.
Hlavac, M. (2015). stargazer: Well-Formatted Regression and Summary Statistics Tables.R package version 5.2.
Sarkar, D. (2008) lattice: Lattice: Multivariate Data Visualization with R. Springer, New York.
Neuwirth, E. (2014). RColorBrewer: ColorBrewer Palettes. R package version 1.1‒2. Wickham, H. and Francois R. (2015). dplyr: A Grammar of Data Manipulation. R