© 2016 M. Srinidhi et al. This is an open access article distributed under the terms of the Creative Commons Attribution License -NonCommercial-ShareAlikeUnported License (http://creativecommons.org/licenses/by-nc-sa/3.0/).
Journal of Applied Pharmaceutical Science Vol. 6 (06), pp. 020-025, June, 2016 Available online at http://www.japsonline.com
DOI: 10.7324/JAPS.2016.60604 ISSN 2231-3354
Stability Indicating RP-HPLC Method Development and Validation
for the Estimation of Sumatriptan in Bulk and Pharmaceutical
Dosage Form
M. Srinidhi
1, 2, Md. Mushabbar Basha
2, V. Raj Kumar
1, J. Rajendra Kumar
1*1
Chaitanya College of Pharmacy Education and Research, Kishanpura, Hanamkonda, Warangal – 506 001, Telangana, India.
2
Nirmala College of Pharmacy, Acharya Nagarjuna University, Guntur-522503, Andhra Pradesh, India.
ARTICLE INFO ABSTRACT
Article history:
Received on: 31/01/2016 Revised on: 16/03/2016 Accepted on: 14/04/2016 Available online: 28/06/2016
A simple, highly sensitive stability indicating reverse phase high-performance liquid chromatographic (RP-HPLC) method was developed and validated for the determination of sumatriptan succinate in bulk and tablet dosage form. The analysis was performed on reverse phase C18 ODS Inertsil (250×4.6mm, 5µm) column, with a
mobile phase containing buffer: aetonitrile: methanol (80:10:10 v/v/v), pH was adjusted to 2.5 with orthophosphoric acid (OPA) at 221nm, by an isocratic elution mode with 1ml/min flow rate using photo diode array (PDA) detector at ambient temperature. The injection volume and retention time was found 20 μl and 4.4 minutes respectively. The method produced linear responses in the concentration range of 5 -150 µg/ml, with a correlation coefficient of 0.999. The limit of detection (LOD) and limit of quantification (LOQ) values for HPLC method were found to be 1.967 and 5.961 μg/ml respectively. The recovery of the method was 98% of the labelled value. This method was validated for accuracy, precision, linearity and robustness. Sumatriptan subjected to different ICH prescribed stress conditions of acid, alkali, peroxide, reduction, thermal, photolytic and humidity degradation. This method can easily and conveniently take up for routine quantitative analysis of sumatriptan in bulk and pharmaceutical dosage form by easily available materials with low cost.
Keywords:
Sumatriptan, reverse phase high-performance liquid chromatographic method, stability indicating assay, method development and validation.
INTRODUCTION
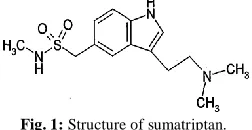
Sumatriptan succinate was the first triptan drug used as anti-migraine, launched by Glaxo in the Netherlands in 1991. Sumatriptan (Fig. 1) is used mainly for the treatment of migraine
attacks with or without aura. The 5-HT1B and 5-HT1D receptors
function as auto receptors, which inhibit the firing of serotonin neurons and a reduction in the synthesis and release of serotonin upon activation. After sumatriptan binds to these receptors, adenylate cyclase (AC) activity is inhibited via regulatory G proteins, intracellular calcium levels increase and other intracellular events are affects. This results in vasoconstriction and inhibition of sensory nociceptive (trigeminal) nerve firing
and vasoactive neuropeptide release (Öztürk et al., 2013).
Few derivative UV methods were reported for sumatriptan in
* Corresponding Author
Email: [email protected]
combination (Rajesh Kumar et al., 2011; Gondalia and Dharamsi,
2010; Sagar et al., 2011; Trinath et al., 2010), visible
(Kalyanaramu and Raghubabu, 2011, Kalyanaramu and
Raghubabu, 2010; Lokesh et al., 2011) spectrophotometric
methods were also reported for sumatriptan succinate in bulk and pharmaceutical dosage forms.
Fig. 1: Structure of sumatriptan.
HPLC methods for quantitative determination of sumatriptan succinate in combination were reported in literature
(Majithiya et al., 2006; Ravi et al., 2012; Shirsat et al., 2008;
HPTLC and UPLCmethods were also reported for the estimation of sumatriptan succinate in single and combination
dosage form (Badwe et al., 1997; Shah et al., 2006; Amruta et al.,
2013). The reported methods were not rapid, used expensive solvents and high solvent consumption. There was no stability indicating method available. In this regard, we felt it necessary to develop and validate a new rapid, economic and stability indicating RP-HPLC method for estimating sumatriptan in bulk
and tablet dosage forms (Ramakoti et al., 2011; Sagar et al., 2010;
Swapna et al., 2013; Handrakant and Sadhana, 2012; Gondalia and
Abhay, 2013).
MATERIALS AND METHODS
Materials and reagents
Sumatriptan succinate was kindly provided as a gift sample by NATCO Pharma limited, Hyderabad, India. Other reagents such as tri ethyl amine (TEA), acetonitrile (ACN), methanol and orthophosphoric acid [HPLC grade] were purchased from the Merck [INDIA]. All other reagents used for the analysis were analytical grade. Distilled water was used throughout the investigation.
Instrumentation
The HPLC system consisted of Waters Alliance (Waters Corporation, MA, USA) equipped with a Waters 2695 solvent delivery module in a quaternary gradient mode and a waters 2669 PDA detector. Data acquisition was performed by the Empower 2 software. Analysis was carried out at 221 nm with reversed phase
C18 ODS Inertsil (250×4.6mm, 5m) column using buffer (tri ethyl
amine): acetonitrile: methanol in 80:10:10 v/v/v ratios as the mobile phase by an isocratic elution mode with flow rate at 1ml/min. The mobile phase was degassed and filtered through 0.45 μm membrane filter before pumping into HPLC system.
Preparation of Solutions Preparation of Buffer Solution
Accurately measured a 1000 ml of HPLC grade Water, 1 ml of tri ethyl amine was dissolved in it and adjust the pH 2.5 ± 0.5 with orthophosphoric acid (OPA).
Preparation of mobile phase
A mobile phase containing buffer: acetonitrile: methanol 80:10:10 v/v/v was prepared, filtered and degassed. It was selected as an appropriate mobile phase which gave good resolution and acceptable peak parameters for sumatriptan.
Preparation of standard solution
Accurately weighed 25 mg of the pure drug, transferred into a 100 ml volumetric flask and dissolved in 70 ml diluent (mobile phase) and sonicated to dissolve it completely, the volume was made up to mark with the diluent to get standard (primary stock) solution (250 μg/ml). From this 5 ml of solution was pipette out and transferred into separate 50 ml volumetric flask and made
up the volume up to the mark with mobile phase to get the concentration of secondary stock solution (25μg/ml). This solution was filtered through 0.45μm pore size nylon syringe filter.
Preparation of sample solution
20 tablets were accurately weighed and crushed. The powder equivalent to one tablet (50 mg) was taken into a 100 ml volumetric flask. 70 ml of diluents was added, sonicated and the volume was made up to mark with the diluent to get standard (primary stock) solution (500μg/ml). From this 5 ml of solution was pipette out and transferred into separate 50 ml volumetric flask and make up the volume up to the mark with diluent to get the concentration of secondary stock solution (50μg/ml). Further dilution was carried out to get the concentration of 25μg/ml then filtered through the 0.45 μm nylon syringe filter.
Chromatographic parameters
Equipment : HPLC equipped with Auto Sampler
Column : C18 ODS Inertsil (250×4.6mm, 5m)
Flow rate : 1ml/min.
Detector : PDA
Wavelength : 221 nm
Injection volume : 20 μl
Column oven : Ambient
Run time : 10 min.
Method Development
Many trials have been performed by various mobile phase, flow rate and stationary phase. After observing the theoretical plates, stability factor the above chromatography parameter were chosen.
System suitability
Secondary Stock solution (25 μg/ml) of sumatriptan standard (20 μl) was injected six times into HPLC system as per test procedure. The system suitability parameters were evaluated from standard chromatograms obtained, by calculating the percentage of related standard deviation (%RSD) of retention times, tailing factor, theoretical plates and peak areas from six replicate injections.
Assay
Linearity
Preparation of stock solution
The linearity of the method was demonstrated over the concentration range of 5-150 μg/ml. Aliquots of 5, 10, 25, 50, 75, 100, 125, 150 μg/ml were prepared from secondary stock solution and labelled as solution 1, 2, 3, 4, 5, 6, 7 and 8 respectively. Volume of 20 μl of sample was injected for each concentration level and calibration curve was constructed by plotting the peak area versus the drug concentration.
Accuracy
Accuracy was performed in triplicate for various concentrations of Sample solutions, prepared by spiking at about 50%, 100% and 150% of specification limit to Placebo and analyzed by the proposed HPLC method.
a. System Precision
Precision is the measure of how close the data values are to each other for a number of measurements under the same analytical conditions.
b. Method precision
Six sample solutions were prepared and injected into the HPLC system as per test procedure.
c. Intermediate precision
25 µg/ml of Standard solution was prepared and injected 6 times into HPLC system on the next day as per test procedure.
Robustness
The robustness was determined by analysis of aliquots from homogenous lots by differing physical parameters like flow rate, wavelength and mobile phase composition which may differ but the responses were still within the specified limits of the assay.
Forced Degradation Acid degradation (5% HCl)
From the sample stock solution 5 ml of sample was transferred into 20 ml volumetric flask and add 2 ml of 5% HCl, A little amount of diluent were added and heated at 80°C for 20 min. Cooled the solution and neutralize the solution by adding 2 ml of 5% NaOH and made up to the volume with diluent.
Alkali degradation (5% NaOH)
From the sample stock solution 5 ml of sample was transferred into 20 ml volumetric flask and added 2 ml of 5%
NaOH, A little amount of diluent were added and heated at 80 0C
for 20 min. Cooled the solution and neutralize the solution by adding 2 ml of 5% HCl and made up to the volume with diluents.
Peroxide degradation
From the sample stock solution 5 ml of sample was
transferred into 20 ml volumetric flask and added 2 ml of H2O2. A
little amount of diluent were added & heated at 80 °C for 20 min. Cooled and made up to the volume with diluent.
Reduction degradation
From the sample stock solution 5 ml of sample was transferred into 20 ml volumetric flask and added 2 ml of Sodium bisulphate, little amount of diluents were added and heated at 80 °C for 20 min. Cooled and made up to the volume with diluent
Thermal degradation
From the sample stock solution 5 ml of sample was transferred into 20 ml volumetric flask, add diluents and heated at
105oC for 24 hrs.
Photolytic degradation
From the sample stock solutions 5 ml of sample was transferred into 20 ml volumetric flask and added diluent, subjected to sun light for 24 hrs.
Humidity degradation
From the sample stock solution 5 ml of sample was transferred into 20 ml volumetric flask and added little amount of
diluent, subjected to 90% relative humidity at 25 0C for 24 hrs.
Then the volume was made up with diluent.
All above prepared solutions used for forced degradation studies, filter the solution through 0.45 μm nylon syringe filter by discarding little amount of solution. And prepare the blank in the same way without sample.
Solution stability
The solution stability of sumatriptan in diluents was determined by leaving 25 µg/ml sample solution in a tightly capped volumetric flask at room temperature for 24 hrs and measuring the amount at 0, 4, 8, 12, 24 hrs and compared the results with those obtained from freshly prepared solution. The mobile phase was prepared at the beginning of the study period and not changed during the experiment.
Limit of Detection (LOD) and Limit of Quantification (LOQ)
Calibration curve was repeated for 3 times and the standard deviation (SD) of the intercepts was calculated. The LOD and LOQ were determined by the following formulas:
LOD = 3.3 σ/S LOQ = 10 σ/S
Where σ = Standard deviation of Intercepts of calibration curves; S = Mean of slopes of the calibration curves.
The slope ‘S’ may be estimated from the calibration curve of the analyte.
RESULTS AND DISCUSSION
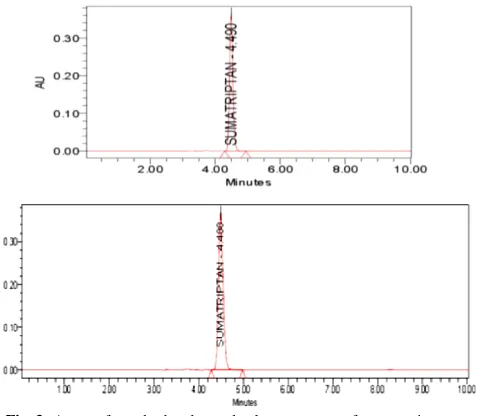
buffer and solvents were evaluated in order to obtain suitable composition of the mobile phase. Various experiments were performed by changing the concentration and pH of mobile phase, stationary phase selection etc., to optimize the chromatographic conditions to achieve better efficiency of the chromatographic system. The composition of mobile phase buffer: acetonitrile: methanol (80:10:10 v/v/v) of pH 2.5 with flow rate of 1ml/min. and runtime of 4.4 min. at 221nm perfect chromatogram was eluted. Peaks were eluted properly and retention time of peak is less than 10 min.; Fig. 2
Fig. 2: Standard chromatogram for system suitability
All individual assays of should be 98% - 102%. Relative standard deviation (RSD) of % assay results should not be more than 2.0%. Assay of standard and sample chromatograms for sumatriptan shown in Fig. 3.
Fig. 3: Assay of standard and sample chromatograms for sumatriptan.
Fig. 4: Calibration curve of sumatriptan.
The procedure for the determination of linearity and range was same as mentioned in the selection of analytical concentration range and preparation of calibration curve for sumatripatan. The calibration curve and chromatograms of linearity results were shown in Fig. 4 and Table 1 respectively. The average % recovery of sumatriptan was calculated and the accuracy results were given in Table 2. The mean % recovery at each spike level should be not less than 98.0% and not more than 102.0%
Table 1: Linearity results. Sl.
No.
Concentration (µg/ml)
Rt (min.)
Avg. Area USP
tailing
1 5 4.481 223644 1.144
2 10 4.487 549968 1.076
3 25 4.492 1080045 1.155
4 50 4.498 1601982 1.159
5 75 4.499 2150780 1.173
6 100 4.508 2678422 1.174
7 125 4.508 3232317 1.178
8 150 4.468 4149922 1.170
Rt: retention time.
Table 2: Accuracy results of sumatriptan.
% Accuracy Mean SD %RSD
50 100.5 0.68 0.670
100 100.3 0.40 0.390
150 100.5 0.26 0.260
SD: standard deviation, RSD: relative standard deviation
Changing with the flow rate and column over temperature and % RSD calculated. The robustness results were found within the limits shown in Table 3.
Table 3: Robustness values of sumatriptan.
Proposed variations USP Plate
Count
USP tailing
Variation in mobile phase composition
2% less 6231 1.194
*Actual 8563 1.156
2% more 8346 1.143
Variation in flow rate
0.8 ml/min 9642 1.175
*1 ml/min 8563 1.156
1.2 ml/min 7899 1.127
Variation in wavelength
216 nm 8463 1.152
*221 nm 8563 1.156
226 nm 8477 1.152
During the study it was observed that upon treatment of sumatriptan with acid (HCL), base (NaOH), hydrogen peroxide
(H2O2), thermal, reduction, photolytic and humidity degradation
was observed. And it was found to be the purity angle is less than purity threshold and peak purity test was passed. The forced degradation study values were shown in Table 4.
Table 4: Forced degradation study values of sumatriptan. Stress
type
% Degradation
Purity angle
Purity
threshold Pass/Fail
Acid 9.9 0.081 1.032 Pass
Alkali 17.5 0.097 1.043 Pass
Peroxide 25.7 0.08 1.027 Pass
Reduction 17 0.078 1.035 Pass
Thermal 9.3 0.09 1.031 Pass
Photolytic 6.2 0.078 1.033 Pass
The % assay result should not differ from the initial value by more than ±2.0. The mobile phase was prepared at beginning, measured the amount at initial, 4, 8, 12 and 24 hrs, compared the results with those obtained from freshly prepared solution and system stability shown in Table 5.
Table 5: Stability of sumatiptan.
Solution stability (hr’s) % Label claim % Deviation
Initial 99.5 -
4 hrs 100.3 0.80
8hrs 101.2 1.71
12 hrs 102.3 2.81
24 hrs 101.8 2.31
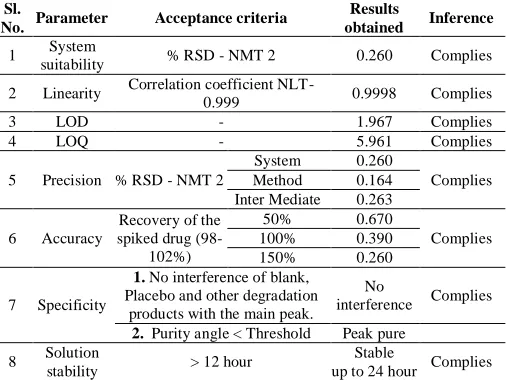
The limit of Detection (LOD) and limit of Quantification (LOQ) were determined according to the ICH guidelines, and found to be 1.967 and 5.967 respectively. The above motioned results was performed based on ICH guidelines, the method was validated with regard specificity, system suitability, linearity, accuracy, precision, forced degradation, LOD and LOQ. All the results were summarized in the Table 6.
Table 6: Results obtained by RP-HPLC method. Sl.
No. Parameter Acceptance criteria
Results
obtained Inference
1 System
suitability % RSD - NMT 2 0.260 Complies
2 Linearity Correlation coefficient NLT-0.999 0.9998 Complies
3 LOD - 1.967 Complies
4 LOQ - 5.961 Complies
5 Precision % RSD - NMT 2
System 0.260
Complies Method 0.164
Inter Mediate 0.263
6 Accuracy
Recovery of the spiked drug
(98-102%)
50% 0.670
Complies
100% 0.390
150% 0.260
7 Specificity
1. No interference of blank, Placebo and other degradation
products with the main peak.
No
interference Complies
2. Purity angle < Threshold Peak pure
8 Solution
stability > 12 hour
Stable
up to 24 hour Complies
CONCLUSION
A sensitive, specific and validated stability indicating assay was described for estimation of sumatriptan, used in anti-migraine therapy. The short retention times allows the analysis of a large number of samples in a short period of time with effective cost. Hence, this method is used for the routine analysis in the pharmaceutical industries. The method was accurately determined the amounts of API in the presence of impurities and excipients.
The method can be used to determine the purity of the drug obtained from different sources by detecting related impurities. Because the method separates the drug from its degradation products, it can be used as stability indicating. It was an accurate, precise, liner, robust, highly sensitive, stability indicating method. As per my knowledge this method was rapid,
very simple method for determination of sumatriptan succinate in both bulk and pharmaceutical dosage form.
ACKNOWLEDGEMENT
The authors are grateful to Nirmala College of Pharmacy for providing the facilities to carry out the experiment and for providing the gratis samples of sumatiptan.
REFERENCES
Amruta B.K, Upendra C.G, Shrikant W, Santhakumari B. Development and validation of a sensitive bio-analytical method for the determination of sumatriptan in rat plasma by UPLC-MS. International journal of pharmacy and pharmaceutical sciences, 2013; 5: 78-82.
Badwe N, Sharma N, Agarwal N. HPLC determination of sumatriptan succinate in pharmaceutical dosage forms. Eastern Pharmacist, 1997; 40: 121–122.
Gondalia R, Abhay D. Simultaneous Estimation of Sumatrirtan succinate and Naproxen Sodium in bulk drug and Pharmaceutical dosage form by RP-HPLC Method. Journal of drug delivery and therapeutics, 2013; 3: 93-97.
Gondalia RP, Dharamsi AP. Spectrophotometric simultaneous estimation of naproxen sodium and sumatriptan succinate in tablet dosage forms. International Journal of Pharmaceutical and Biomedical Sciences, 2010; 1: 24-26.
Handrakant S, Sadhana R. Development and Validation of RP -HPLC Methods for Simultaneous Estimation of naproxen and esomeprazole magnesium trihydrate in combined Pharmaceutical formulation. International journal of pharmacy and pharmaceutical sciences, 2012; 4: 533-537.
International Conference on Harmonization, Validation of analytical procedures: Text and methodology ICH Q2 (R1), International
conference on harmonization. Geneva 2005; 1-13.
Kalyana Ramu B, Raghubabu K. Visible spectrophotometric determination of sumatriptan succinate in tablet dosage forms using folin reagent. International journal of pharmaceutical and biomedical sciences, 2010; 1: 49-52.
Kalyanaramu B, Raghubabu K. A simple visible spectro-photometric determination of Sumatriptan Succinate from pharmaceutical formulations. Der pharma chemical, 2011; 3: 223-228.
Kalyanaramu B, Raghubabu K. Ion association method for the determination of sumatriptan succinate from tablet dosage forms using Tropaeolin. International journal of pharmacy and pharmaceutical sciences, 2011; 3: 175-178.
Lokesh Singh, Sanju Nanda, Rajiv Chomwal. A validated sensitive liquid chromatographic method for the estimation of sumatriptan succinate in bulk drug and tablet dosage form, 2011; 2: 37-41.
Majithiya RJ, Majithiya JB, Umrethia ML. HPLC method for the determination of sumatriptan in plasma and brain tissue.Ars Pharm, 2006; 47: 199-210.
Öztürk V. Migren Akut Tedavisi. Nöro Psikiyatr Arşivi. Acute treatment of migraine. Archives of neuropsychiatry, 2013; 50: 26–29.
Rajesh Kumar N, Sunil Kumar S, Susanta Kumar P. Method
development and validation of Sumatriptan in bulk and pharmaceutical dosage forms by UV spectrophotometric method.
International journal of pharmaceutical and biological archives, 2011; 2: 1100-1105.
Ramakoti Reddy Y, Kishore Kumar K, Reddy MRP. Mukkanti K. Rapid simultaneous determination of sumatriptan succinate and naproxen sodium in combined tablets by validated UPLC Method. Journal of analytical and bioanalytical techniques, 2011; 2: 2-6.
Sagar D, Patel U, Bhanubhai N. Development and validation of spectrophotometric method for simultaneous estimation of sumatriptan succinate and naproxen sodium in pharmaceutical dosage form. Journal of pharmaceutical science and bioscientific research, 2011; 1: 50-53.
Sagar SD, Paresh P, Bhanubhai N. Development and validation of RP-HPLC method for estimation of sumatriptan succinate in pharmaceutical dosage form. International journal of drug development and research, 2010; 3: 266-269.
Shah C.R., Suhagia B.N, Shah N.J. Development and validation of a HPTLC method for the estimation of sumatriptan in tablet dosage forms. Indian journal of pharmceutical sciences, 2006; 70: 831– 834.
Shirsat V. A, Gabhe S.Y, Deshpande S.G. High performance liquid chromatographic determination of Sumatriptan succinate from pharmaceutical preparation. Indian drugs, 2008; 35: 404–407.
Singh S, Jain R. Stability indicating HPLC method for the determination of sumatriptan succinate in pharmaceutical preparations and its application in dissolution rate studies. Indian drugs, 1997; 34: 527–531. Swapna Y, Nagarjun Reddy G, Chandra Sekhar K. A new RP – HPLC method for simultaneous estimation of naproxen and sumatriptan in tablet dosage form. International journal of pharmaceutical and biomedical sciences, 2013; 3: 179-185.
Trinath M, Saurabh K, Banerjee, Hari Hara Teja, Bonde C. G. Development and validation of spectrophotometric method for simultaneous estimation of sumatriptan and naproxen sodium in tablet dosage form. Der pharmacia sinica, 2010; 1: 36-41.
How to cite this article: