Environmental Resources Research Vol. 7, No. 1, 2019
GUASNR
An integrated method to valuate the function of green roofs in
absorbing air pollutants; Case study: Tehran
E. Mohammadi1, S.H. Mirkarimi2, M. Mohammadzadeh3*
1
M.Sc. in Environmental Sciences, College of Fisheries and Environmental Sciences, Gorgan University of Agricultural Sciences and Natural Resources, Iran 2
Associate Professor, College of Fisheries and Environmental Sciences, Gorgan University of Agricultural Sciences and Natural Resources, Iran 3
Assistant Professor, College of Fisheries and Environmental Sciences, Gorgan University of Agricultural Sciences and Natural Resources, Iran
Received: February 2018 ; Accepted: December 2018
Abstract
Tehran is the capital city of Iran and its inhabitants are suffering from air pollution. Green roofs can be one of the choices to deal with this problem. In this paper, ability of green roofs in absorbing four air pollutants (PM10, SO2, NO2, and CO2) in Tehran was
valuated. First, the potential of 1 m2 of a hypothetical green roof in Tehran in absorbing PM10 and SO2 during 1 year was estimated using a dry deposition model. Absorbing
potential of green roof for NO2 and CO2 was taken from other studies. Next, the reduction
of each air pollutant was valuated using replacement cost method. Then, results were generalized to the total roof areas of the residential buildings in Tehran for the green roofs life span. Estimations showed that value of green roofs covering an area of 94,093,625 m2 in reducing PM10, SO2, NO2, and CO2 during 50 years in Tehran will be 506,361,775 $.
Keywords: Extensive green roof, Air pollution, Valuating ecosystem services, Replacement cost method, Dry deposition.1
Introduction
Green roof is a suitable choice to increase urban green spaces. It contains living vegetation, and can have the same ecosystem services that other green spaces offer, including improvement of storm water management (Carter and Jackson, 2007; Mentens et al., 2006), reduction of urban heat island effect (Takebayashi and Moriyama, 2007; Arabi et al., 2015), conservation of energy (Saiz et al., 2006; Carter and Keeler, 2008), and reduction of air pollutants (Li et al., 2010; Currie and Bass, 2008; yang et al., 2008; Clark et al., 2008; Getter et al., 2009). In Iran, the original idea of increasing urban green spaces by installing green roof was welcomed, but its relatively high price has made the idea infeasible. Valuating the environmental benefits of this technology along with other efforts can be a step to rationalize and encourage their use. In this paper, the focus was on air pollutant reduction ability of green roofs and the economic value of this service. The study area was Tehran, capital city of Iran. The most important environmental problem of Tehran is air pollution that costs its citizens a lot of hygienic, social, and economic impacts (annual report of Tehran’s air quality in 2011). The reduction of four air pollutant levels (PM10, SO2, NO2, and CO2)
by hypothetical extensive green roofs in Tehran and their economic value were estimated in this paper. To measure the amount of pollutants absorbed by green roof plants, different methods have been introduced. For instance, Li et al. (2010) used field measurements, a small model, and computer simulation to calculate the role of green roof in decreasing CO2. Currie
and Bass (2008) used module-D (Dry Deposition Model) of UFORE1 model to compare the reduction amount of four air pollutants (NO2, SO2, O3, and PM10) by
different compositions of plants (including trees, shrubs, and green roofs and walls). UFORE is a computer model that uses field data (such as land use, percentage of tree
1
Urban Forest Effect
cover, and building information) along with hourly weather and pollution concentration data to quantify the effect of urban vegetation on air pollution and its economic value (Currie and Bass, 2008). Yang et al. (2008) used a dry deposition model to estimate the reduction of four pollutants (NO2, SO2, O3, and PM10) by green roofs in
Chicago. They used some algorithms to calculate the dry deposition velocity of each air pollutant. Clark et al. (2008) translated the amount of NOX reduction in 217 species
(Morikawa et al., 1998) to NO2 reduction
by sedums on green roof. Getter et al. (2009) measured the potential of green roof in carbon sequestration in several plots with four species of sedums (S. spurium, S. acre, S. album, and S. kamtshaticum), different substrate depths, and alternative plant ages. In this paper, the average absorption levels of NO2 and CO2 were respectively taken
from Clark et al. (2008) and Getter et al. (2009), and reduction of PM10 and SO2
were measured using a dry deposition model.
In the next step, the pollution removals were valuated. There are few published papers focusing on valuating pollution abatement or other ecosystem services of green roofs. Clark et al. (2008) applied two estimation methods used by EPA2 to valuate the reduction of NO2 by green
roofs. These methods were developed by EPA as part of a regulatory impact analysis of NOX reduction in 1998, in which
economic value of reducing premature deaths and cases of chronic bronchitis were calculated (Clark et al., (2008) from U.S. EPA, (1998)). Currie and Bass (2008) calculated the value of urban vegetation in reducing air pollutants using UFORE database, which is based on the cost of the air pollution to health and the environment. In the present study, alternative cost method was used to valuate the reduction of each pollutant. Finally, results were generalized to the total roof areas of residential buildings in Tehran and during green roof’s life.
2
Materials and methods
This research had 3 steps: 1. Calculating absorption levels of PM10 and SO2, 2.
Estimating the value of green roof for pollutant absorption function, and 3. Generalizing the value of green roof in air pollution reduction. In steps 1 and 2, all measurements were for 1 square meter of a hypothetical extensive green roof in Tehran and for a one-year time period. In step 3, economic value of green roof in reducing 4 air pollutants (PM10, SO2, NO2, and CO2) in
the whole life span of these roofs and in a hypothetical condition in which most of Tehran’s roofs are covered with it, was estimated. Calculations were based on the characterizations of sedum plants because sedums are the most commonly used plants on green roofs (Lucket, 2009; Dunnett et al., 2011).
In this section first the formula for calculating the amounts of reduction in PM10 and SO2 and its elements, and then the
ways to valuate the reduction of each pollutant are described. Then, the method to generalize the results is explained.
Calculating absorption levels of PM10 and
SO2
In order to calculate the potential of green roof in absorbing PM10 and SO2, a dry
deposition model (equation 1) was used. Powe and Willis (2004) used this equation to survey the amounts of absorption of PM10 and SO2 by forest ecosystems.
ABSORPTION = FLUX × SURFACE × PERIOD (1)
Where:
FLUX = deposition velocity (m s-1) × pollutant concentration (µ/m3)
SURFACE = area of land considered (m2) × surface area index (m2 per m2 of ground area)
PERIOD = period of analysis (s) × proportion of dry days × proportion of in leaf days
Deposition velocity of PM10 and SO2 were
considered 0.001 and 0.0002 respectively (Powe and Willis, 2004). Average annual pollutants’ concentration was derived from annual report on air quality of Tehran in the year 2012. Surface Area Index (SAI) of green roof was considered as 3 (Currie and
Bass (2008) from Kenny (2001)). Period of analysis was 1 year, and proportion of dry days was calculated by discounting the average number of rainy days during 5 years. By assuming sedum plants as ever-green, proportion of in leaf days was considered as 1.
Estimating the value of green roof for pollutant absorption function
There are various ways for valuating ecosystem services. In this study Replacement Cost Method or Alternative Cost Method (used by Shabman and Batie in 1978) was applied. As their name suggests, the methods estimate the cost of replacing environmental recourses with a manmade product. There can be different alternatives for an environmental service, and the selected alternative should have the least cost in comparison with other options (Shabman and Batie, 1978). Here, replacing technology for reducing each pollutant is explained separately.
PM10: Scrubbers, bag houses and electrostatic precipitators are some tools to remove particles. These technologies are being used in industries like cement, and steel production. Jafari et al. (2011) surveyed cost and energy consumption of a venturi scrubber and an electrostatic precipitator attached to a blast furnace, in 3 different furnace capacities of 3, 6, and 12 tons, in a steel industry over 20 years. To estimate the total investment cost, they calculated the costs related to buying, installing and commissioning, depreciation and annual interest in purchase and installation cost (using the discount rate and bank interest in 2011), as well as the annual energy cost with regard to the amount of
power consumption, the annual
thousand dollars. Production of one ton of steel in a furnace with low capacity generates about 10 to 40 (average 25) kilograms of particulate matter (The World Bank Group, 1999), 60% of which has a diameter less than 10 microns (Emission Inventory Guidebook, 2006). Also, efficiency of the precipitator was 99% (Jafari et al., 2011), so 14.85 kilogram of PM10 is infiltrated per ton of produced steel.
By considering annual working hours of the precipitator (Jafari et al., 2011) and precipitator’s capacity, each year 130,086 kilograms of PM10 is trapped by the
described precipitator, so the cost for each kilogram of it is about 180 rials (164×10-4 $).
SO2: Nik Eghbali et al. (2014) simulated the absorption processes of SO2, NO2, and
CO2 in a new Fluid Catalytic Cracking Unit
(FCCU) of Abadan refinery using caustic phosphate buffer method in HYSYS Refinery software. They calculated that reducing each ton of SO2 costs 703 dollars
(Nik Eghbali et al., 2014).
NO2: The shadow price of NOX in Iran’s
power houses was estimated at 14990.9 rials per kilogram of this pollutant (equivalent to 1.45 dollars), using economic and statistical models (Esmaeili and Mohsen Poor, 2010). Also Nik Eghbali et al. (2014) estimated the cost of reducing each kilogram of NO2 by scrubbers in
FCCU to 0.292 dollars. Since the estimated cost in Nik Eghbali et al. (2014) was less than that in Esmaeili and Mohsen Poor, (2010), 0.292 dollars was used in this paper.
CO2: Nik Eghbali et al. (2014) estimated that reduction of carbon dioxide costs 0.153 dollar per kilogram.
Generalizing the results
For better understanding the role of green roof in air pollution reduction in Tehran, the value of reducing aforesaid pollutants was estimated for green roofs life span and in a hypothetical situation in which almost all the residential roofs in Tehran are covered with extensive green roof. The approximate life of a green roof can be 40 (Bianchini and Hewage, 2012 and Clark et al., 2008) to 60 (Luckett, 2009) years. In
this paper, the average life of a green roof was assumed 50 years. The total roof areas of residential buildings in Tehran were estimated using information of the number of ordinary residential units and their area. Using this report’s information, the approximate area of all residential units in Tehran in 2006 was calculated about 207 square kilometers (statistical center of Iran, 2009); In this report, the number of floors in each building was not mentioned, so for example, in a 4 story building, the area of substructure is counted 4 times. Since the average number of floors in residential buildings in Tehran is 2.2 (the latest details
of detailed plan of Tehran,
www.consbank.com), so we estimated the approximate area of roofs for residential buildings in Tehran to be about 94,093,625 square meters in 2006. By considering the total area of Tehran (594 square kilometers (statistical center of Iran, 2009)) at least 15% of the city is covered with roofs. It should be mentioned that nonresidential buildings were not considered in this estimation; besides, growth of city’s total area and the number of buildings in it from 2006 to present are not deniable. On the other hand, some roofs are not strong enough to bear green roof’s weight; also, only parts of a roof can be covered with green plants. Therefore, by accepting the errors and because of the lack of exact information, the 94,093,625 square meters of the area in Tehran were assumed to have the potential to be covered with green roofs.
Results and Discussion
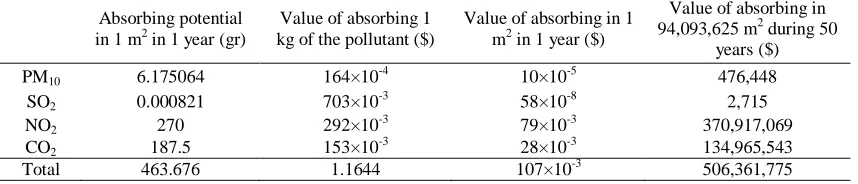
Summary of results are shown in Table 1. It can be seen that, the calculated absorbing potential of PM10 and SO2 were less than
NO2 and CO2, because of the difference in
estimating methods. For the first 2 pollutants, just the amounts of absorption by depositing on plant’s leaves were estimated, but the amounts of nitrogen dioxide and carbon dioxide were estimated by drying all parts of the plants and studying their biomass in laboratory (Morikawa et al., 1998; Getter et al., 2009). The total pollution removal amount of green roofs was 6.175875 gr/m2 for PM10
and SO2 and 457.5 gr/m 2
Since the methods of estimating the absorbing potential of these pollutants were not the same, we cannot compare the absorption amounts of 4 pollutants with each other. The method for calculating absorption amounts of pollutants was not the same in this study. We preferred to use the findings of Clark et al. (2008) and Getter et al. (2009) for NO2 and CO2
absorptions because they took data from real plants and seemed more accurate than estimations by models. We recommend further studies to calculate the amounts of other air pollutants in green roof plants biomass. It should be noted that such studies still contain errors. Because plants mitigate the air pollution not just by absorbing the pollutants, but also through reducing air temperature. In latter case, less energy will be needed for chilling the indoor air, which consequently reduces the energy requirement, leading to fewer emissions from power plants (Rowe, 2011). The sum of absorption for two air pollutants (PM10 and SO2) in our study was
relatively higher than the absorption amounts of 4 air pollutants in other studies; Yang et al. (2008) using a dry deposition model, estimated that green roofs in Chicago can reduce 8.5 grams of O3, NO2,
PM10, and SO2 per square meter during 1
year. Results of Currie and Bass (2008) showed that in a scenario in which 20% of roofs in a 1216 ha area in midtown of Toronto are covered with grass, 3.05 mg of air pollutants (including NO2, SO2, O3, and
PM10) will be reduced. This number
changed to 7.52 mg in a different scenario when all available roof surfaces in that area were covered with grass (Currie and Bass, 2008). The main reason for the difference in absorption in these studies and ours is the method of modeling and calculation; in fact, the dry deposition model that we used in this study was similar to the ones used in Yang et al. (2008) and Currie and Bass (2008) but the appointed numbers for deposition velocity and SAI are not the same. Also, pollutant concentration and meteorological conditions of the study area influences the results.
The value of absorbing each pollutant is shown in Table 1. In this study we used the Alternative Cost Method to valuate the pollution absorbing ability of green roofs, while there are other methods for valuating ecosystem services. For example, Clark et al. (2008) translated annual uptake of NO2
(0.27 kg) by 1 m2 of green roof to health benefits, about 0.45 $ (in their low benefit scenario) and 1.72 $ (in their high benefit scenario). Pollution removal value of green roofs in a scenario in which 20% of roofs in a 1216 ha area in midtown of Toronto are covered with grass and in a different scenario when all available roof surfaces in that area are covered with grass were calculated to 17481 $ and 43106 $ respectively by Currie and Bass (2008). Monetary values differ among countries in terms of their priorities for funding health care (Currie and Bass, 2008).
Table 1. Summary of results
Absorbing potential in 1 m2 in 1 year (gr)
Value of absorbing 1 kg of the pollutant ($)
Value of absorbing in 1 m2 in 1 year ($)
Value of absorbing in 94,093,625 m2 during 50
years ($)
PM10 6.175064 164×10-4 10×10-5 476,448
SO2 0.000821 703×10
-3
58×10-8 2,715
NO2 270 292×10-3 79×10-3 370,917,069
CO2 187.5 153×10
-3
28×10-3 134,965,543
Total 463.676 1.1644 107×10-3 506,361,775
According to our results, the total value of green roofs in reducing the amounts of PM10, SO2, NO2, and CO2,during 50 years
and in a condition in which 94,093,625 m2 of roofs in Tehran are covered with these green plants will be 506,361,775 $. The
cost of air pollution in Tehran for 4 pollutants (PM, NOX, SO2, and CO) was
of the costs of air pollution will be reduced by these green areas. Although this is a low percentage, green roofs are still a good opportunity to change a roof to a place where plants can grow because mitigating air pollution is just one of green roof’s benefits.
Conclusion
Green roof has been recognized as a green technology all over the world, but in the countries where the idea is still new, its relatively high price is the initial and the most important obstacle in its propagation. Getting policy makers and city residents
aware of the ecosystem services of the plants on green roof and valuating these services can help to show the importance of using this technology in contemporary cities. This research was the first to survey ecosystem services of green roofs in Iran. In this paper, we focused on the value of green roofs in reducing 4 air pollutants, and our results indicated that value of absorbing these pollutants in 1 m2 in 1 year is 107×10
-3
$. Valuating absorption amounts of other air pollutants along with other ecosystem services of green roofs in further studies will shed more lights on our results.
References
Annual report of Tehran’s air quality in 2011. 2012. Technical report of air quality control Corporation. Number of report: QM91/02/06(U)/01 (In Persian).
Annual report of Tehran’s air quality in 2012. 2013. Technical report of air quality control Corporation. Number of report: QM92/03/03/(U)/01 (In Persian).
Arabi, R., Shahidan, M.F., Kamal, M.M., Jaafar, M.F. Z B., and Rakhshandehroo, M. 2015. Mitigating Urban Heat Island Through Green Roofs. Current World Environment, 10(Special Issue 1 (2015)): 918-927.
Bianchini, F., and Hewage, K. 2012. How “green” are the green roofs? Lifecycle analysis of green roof materials. Building and Environment, 48: 57-65.
Carter, T., and Jackson, C.R. 2007. Vegetated roofs for storm water management at multiple spatial scales. Landscape and Urban Planning, 80(1): 84-94.
Carter, T., and Keeler, A. 2008. Life-cycle cost-benefit analysis of extensive vegetated roof systems. Journal of Environmental Management, 87(3): 350-363.
Clark, C., Adriaens, P., and Talbot, F.B. 2008. Green roof valuation: a probabilistic economic analysis of environmental benefits. Environmental science and technology, 42(6): 2155-2161.
Currie, B.A., and Bass, B. 2008. Estimation of air pollution mitigation with green plants and green roofs using the UFORE model. Urban Ecosystems, 11(4): 409- 422.
Dunnett, N., Gedge, D., Little, J., and Snodgrass, E.C. 2011. Small green roofs, Low-Tech options for greener living. Portland, London. Timber Press.
Emission Inventory Guidebook. 2006. Processes in Iron & Steel Industries & Collieries, Electric Furnace Steel Plant.
Esfahanian, V., Momeni, M., Mahoutchisaeid, K., Ashrafi, K., and Badiei, A. 2014. Estimation of External Costs Due to the Air Pollution in Tehran City. Journal of Environmental Sciences, 12 (3): 85-92 (In Persian with English abstract).
Esmaeili, A., and Mohsen Poor, R. 2010. Measuring the Shadow Price of Pollutants in the Iranian Electric Industry. The Economic Research, 10(4): 69-86 (In Persian with English abstract).
Getter, K.L., Rowe, D.B., Robertson, G.P., Cregg, B.M., and Andresen, J.A. 2009. Carbon Sequestration Potential of Extensive Green Roofs. Environmental Science and Technology, 43(19): 7565-7570.
Kenney, W.A. 2001. The environmental role of Toronto’s urban forest, University of Toronto Department of Forestry, Toronto, Ontario.
Li, J.F., Wai, O.W., Li, Y.S., Zhan, J.M., Ho, Y.A., Li, J., and Lam, E. 2010. Effect of green roof on ambient CO2 concentration. Building and Environment, 45(12): 2644-2651.
Luckett, K. 2009. Green roof construction and maintenance. McGraw-Hill.
Mentens, J., Raes, D., and Hermy, M. 2006. Green roofs as a tool for solving the rainwater runoff problem in the urbanized 21st century? Landscape and urban planning, 77(3): 217-226.
Morikawa, H., A. Higaki, M., Nohno, M., Takahashi, M., Kamada, M., Nakata, G., Toyohara, Y., Okamura, K., Matsui, S., Kitani, K., Fujita, K.I., and Goshima, N. 1998. More than a 600-fold variation in nitrogen dioxide assimilation among 217 plant taxa. Plant, Cell and Environment, 21(2): 180-190.
Murray F.J., Marsh L., and Bradford P.A. 1994. New York State energy plan, Vol II issue reports. New York State Energy Office, Albany NY.
Nickeghbali, N., Sekhavatjoo, M., Ruzbahani, B., and Dadollahi, A. 2014. Minimization of Air Pollutants Emission from FCCU by Scrubber in Abadan Oil Refinery. Farayandno, 46: 79-95 (In Persian with English abstract).
Powe, N.A., and Willis, K.G. 2004. Mortality and morbidity benefits of pollution (SO2 and
PM10) attributable to woodland in Britain. Journal of Environmental Management, 70:
119-128.
Rowe, D.B. 2011. Green roofs as a means of pollution abatement. Environmental Pollution, 159(8): 2100-2110.
Saiz, S., Kennedy, C., Bass, B., and Pressnail, K. 2006. Comparative Life Cycle Assessment of Standard and Green Roofs. Environmental Science and Technology, 40(13):4312-4316. Shabman, L.A., and Batie, S.S. 1978. Economic value of natural coastal wetlands: a critique.
Coastal Management, 4(3): 231-247. doi: 10.1080/08920757809361777 Statistical Center of Iran. 2009. Generic results of Tehran city (In Persian).
Takebayashi, H., and Moriyama, M. 2007. Surface budget on green roof and high reflection roof for mitigation of urban heat island. Building and Environment, 42(8):2971-2979
The latest details of detailed plan of Tehran. 2012. Code of the report: 11696. Available at: http://www.consbank.com. Accessed May 2015 (In Persian).
The World Bank Group in collaboration with the United Nations Environment Programme and the United Nations Industrial Development Organization. 1999. Pollution Prevention and Abatement Handbook 1998, Toward Cleaner Production. The World Bank. Washington, D.C.
U.S. EPA. 1998. Office of Air and Radiation. Regulatory Impact Analysis for the NOX SIP Call,
FIP, and Section 126 Petitions; EPA-452/R-98–003A; U.S. Environmental Protection Agency: Washington, DC.