The International Journal of Environmental Resources Research
Vol. 1, No. 1, January 2013
GUASNR
The Relationships between the Number of Sunspots and
Fluctuation in the Trend of Climatic Components in Iran
during Recent Decades
Gh.R. Roshan*
Department of Geography, Golestan University, Gorgan, Iran.
Received: August 2012 Accepted: December 2012
Abstract1
The statistical period from 1951 to 2005 was chosen in this research for determining the extent of influence on precipitation and annual temperature from sunspots. This analysis was conducted on 31 synoptic stations in Iran. Initially, the Mann-Kendall test was administered in order to analyze the trend of alterations of these two components over time and the results suggest that 16% of the stations show significant relationship with annual precipitation (positive and negative). More stations showed significant relationships between sunspots and minimum annual temperature (74.19%), maximum annual temperature (48.38%) and mean annual temperature (67.8%). The amounts of the above correlations include all of the significant trends, whether those that show inverse significant trends or those that demonstrate direct significant trends. For further investigating the relationship between variations in the number of sunspots and temperature, 5 temporal ranges were used. This analysis was conducted on raw data (without a moving average) and also on data with a moving average of 5, 8, 11 and 22 years. The general conclusion drawn from different temporal ranges of precipitation data was that a significant amplification for Iran’s stations with a frequency coefficient of 25.16% was observed. However, when this relationship is reversed, the frequency the coefficient turned out to be 12.92. Likewise, for different components of temperature, the inverse relationship between the number of sunspots and alterations of temperature possesses a higher frequency position among the stations. This value is 15.46 % for the minimum temperature, 16.12% for the maximum and 12.89% for the annual average temperature.
Keywords: Climate change; Sunspots; Mann-Kendall test; Moving average;
Iran.
*
1. Introduction
Global climate is constantly changing (Christensen and Sevensmark, 2007). Many hypotheses have been proposed as the main factors responsible for this, some controversial and not universally accepted by the scientific community. Greenhouse gases, aerosol loading and solar factors are among the main causes suggested to explain the changes in observed temperatures in recent decades (Santer et al., 1996). Although most of the Sun-climate mechanisms are not well understood yet, a host of empirical evidence suggests that solar energy changes alter the Earth’s climate significantly (Eddy, 1976; Haigh, 1996; Shindell et al., 1999; Marsh and Svensmark, 2003; Lambert et al., 2004; Georgieva et al., 2005; Zanchettin et al., 2008) and that climate sensitivity to solar variations obeys a frequency-dependent transfer function of solar energy, so that the damping effect of the oceanic and atmospheric thermal inertia makes the climate more sensitive to slower solar variations (Wigley, 1988; Foukal et al., 2004; Scafetta and West, 2006; Zanchettin et al.,2008). One of the most strongly advocated theories involves temporal changes in solar activity (Azizi, 2004). Since solar input to the climate system is the main driver of climate, this hypothesis suggests fluctuations in solar income may be influential in causing climate fluctuations (Baldwin and Dunkerton; Landscheidt, 2007).
the climate system and is influential in every major climatic change. Results of the study by Almeida and his colleagues on some regions in Brazil (2004), in the field of analysis of cyclic fluctuations of precipitations regarding 11 and 22 year cycles of sunspots indicated a counter relationship between the sunspots and precipitation. They found that the maximum number of sunspots occur simultaneously with the minimum amounts of precipitation. In another research on Peking, China, results indicated a straight and positive correlation between solar activities and annual precipitation. For the study, Le and colleagues (2003), based their research on continuous wavelet analysis method and took into consideration the 11 year solar cycle. Hiremath (2006) surveyed the effects of solar activities on the trend of seasonal precipitation in India and their cyclic alterations. Using the correlation analysis method for data gathered during 130 years, he revealed a high connection and correlation between seasonal precipitations and solar activities. Among the important points revealed in the course of aforementioned studies and generally in surveying the role of solar activities, is the alteration of effect of solar activities on climatic parameters in different geographical zones. Consequently, the reactions may be positive in some regions, negative and even neutral in others. In a country like Iran with geographical and climatic diversity, different results could be seen.
It goes without saying that identifying the precipitation variations and the conditions of droughts and wet years in Iran regarding solar activities and the trend of these variations will be very useful in providing readiness for adapting to the new environmental and climatic conditions and planning suitable programs ahead involving such sectors as agriculture, agricultural products and nutritional security.
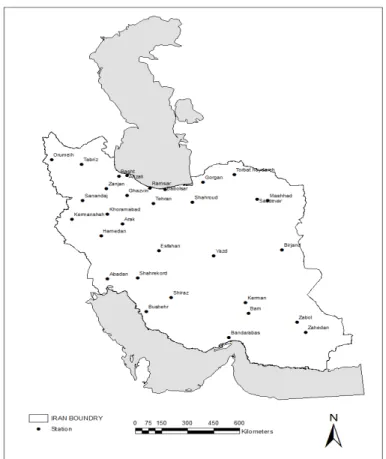
2. Materials and methods 2.1. Climate data and sunspots
Figure 1. The studied stations according to their distribution in Iran
Table 1. Geographical situation and the length of the statistical period of the chosen stations
Station Latitude Longitude Elevation in meter
Time
series Station Latitude Longitude
Elevation
in meter Time series Babolsar 36 43 N 52 39 E -21.0 1951-2005 Abadan 30 22 N 48 15 E 6.6 1951-2005 Bandarabas 27 13 N 56 22 E 10.0 1957-2003 Anzali 37 28 N 49 28 E -26.2 1952-2005
Bushehr 28 59 N 50 50 E 19.6 1951-2005 Arak 34 6 N 49 46 E 1708.0 1955-2005
Esfahan 32 37 N 51 40 E 1550.4 1951-2005 Bam 29 6 N 58 21 E 1066.9 1956-2005 Ghazvin 36 15 N 50 3 E 1279.2 1959-2005 Birjand 32 52 N 59 12 E 1491.0 1955-2005 Gorgan 1279.2M 54 16 E 13.3 1952-2005 Hamedan 35 12 N 48 43 E 1679.7 1951-2005 Kerman 30 15 N 56 58 E 1753.8 1951-2005 Khoramabad 33 26 N 48 17 E 1147.8 1951-2005 Kermanshah 34 21 N 47 9 E 1318.6 1951-2003 Orumeih 37 32 N 45 5 E 1315.9 1953-2005 Mashhad 36 16 N 59 38 E 999.2 1951-2005 Ramsar 36 54 N 50 40 E -20.0 1955-2005 Rasht 37 15 N 49 36 E -6.9 1956-2005 Sabzevar 36 12 N 57 43 E 977.6 1955-2005 Shahrekord 32 17 N 50 51 E 2048.9 1955-2003 Sanandaj 35 20 N 47 0 E 1373.4 1963-2005 Shiraz 29 32 N 52 36 E 1484.0 1951-2005 Shahroud 36 25 N 54 57 E 1345.3 1951-2005 Tabriz 38 5 N 46 17 E 1361.0 1951-2005 Torbate 35 16 N 59 13 E 1450.8 1959-2005 Tehran 35 41 N 51 19 E 1190.8 1951-2005 Zabol 31 2 N 61 29 E 489.2 1963-2005 Yazd 31 54 N 54 17 E 1237.2 1952-2005 Zanjan 36 41 N 48 29 E 1663.0 1955-2005
Zahedan 29 28 N 60 53 E 1370.0 1951-2005 - - - - -
2.2. Statistical tests for trend analysis 2.2.1. Mann-Kendall test
Initially, for demonstrating the significance of the fluctuations trend of temperature and precipitation in the course of time, the trend test was carried out. In statistical tests, the zero hypothesis trend or H0 means that the studied series has
no trend, whereas H1 indicates that the series have a trend. For surveying and identifying the trend, parametrical and non-parametrical methods are used. However, non-parametrical methods have higher accuracy and are more reliable. Among the non-parametrical methods, the Mann-Kendall test is considered as the best method for identifying steady trends (Rahimzadeh et al., 2009; Tabari and Talaee, 2011).
Therefore, for identifying trends which are steady and have a distinct direction in the temporal series of precipitation and annual temperature (minimum, maximum and daily), the Mann-Kendall test was used. This method is summarized briefly below (Rahimzadeh et al., 2009; Tabari and Talaee, 2011):
The Mann-Kendall test is a non-parametric test and does not need the data to be distributed normally (Tabari and Hosseinzade Talaee 2011). Another benefit of the test is that it has a low sensitivity to sudden breaks because of time series that are non homogeneous. According to the test, the null hypothesis H0 indicates that the
data that has been rejected (x1, ..., xn) is an example of n independent variables that
have been normally distributed. The alternative hypothesis H1 of a two-sided test
implies that the dispersions of xk and xj are not the same for all
The test statistic S, which has zero average and a variance that has been calculated using Equation 3, is calculated by Equations 1 and 2 and is asymptotically normal (Tabari and Talaee, 2011):
1 1 1)
sgn(
n k n k j k jx
x
s
(1)
0
1
0
0
0
1
)
sgn(
k j k j k j k jx
x
if
x
x
if
x
x
if
x
x
(2)18
)]
5
2
)(
1
(
)
5
2
)(
1
(
[
)
(
s
n
n
n
t
t
t
Var
t (3)The notation t is the extent of any tie that is given and ∑t means the sum over all
0
)
var(
1
0
0
0
)
var(
1
s
if
s
s
s
if
s
if
s
s
) 4 (Positive values of Z show increasing trends whereas negative values of Z demonstrate decreasing trends. When one tests either the increasing or decreasing
monotonic trends at the significance level α, the null hypothesis is repudiated for an absolute value of Z that is greater than Z1-α/2 obtained from the standard normal
cumulative dispersion tables (Partal and Kahya 2006; Modarres and Silva 2007; Tabari and Talaee,2011). In the present research, significance levels of α = 0.01 and 0.05 were applied.
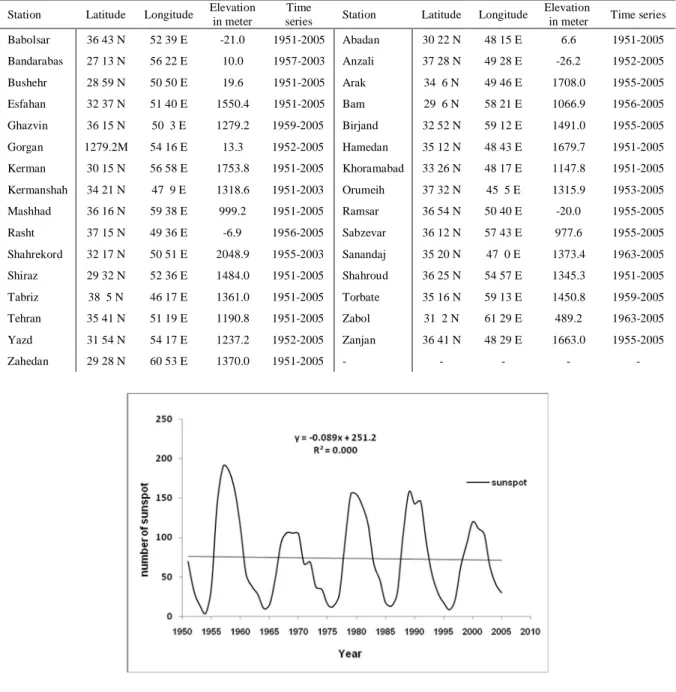
2.2.2. Linear regression method
Data from sun spots consisted of two manifest cycles of 11 and 12 years that overtly change with time. Additional to these two manifest cycles, two other small and weak cycles which are 5 and 8 years are identifiable. The 11-year cycle has the maximum fluctuations and is stronger than the 22-year one (Jahanbash and Edalatdoust, 2008).
investigation is obtained by multiplying the slope with the number of years (Tabari and Maroofi 2011a; Tabari et al., 20011b).
3. Results
3.1. The trend fluctuations of the annual temperature and precipitation for recent decades
As it can be seen in Figure 5a, generally speaking, the precipitation of most of the observational stations follows an accidental annual trend. However, among the studied stations, there appears two significant and increasing trends; first the station of Babolsar with the Mann-Kendall coefficient by the amount of Man-Kendall Test (MT); 2.505 and the decadal fluctuations of precipitation by the amount of (+32mm/decade), indicates significance in the range of 1 percent and second, the station of Abadan with the Man-Kendall coefficient of (MT=2.011; +7.28mm/decade) indicates the significance of fluctuations of precipitation in the range of 5 percent (Figure 3a,b). Despite this increasing trend for the above stations, the results of Mann-Kendall for the station of Tabriz (MT=-2.621;-11.88mm/decade), the stations of Zahedan (MT= -3.245; -16.71mm/decade), and Orumeih (MT=-2.737; -27.31mm/decade), indicate a decreasing and significant trend of the fluctuations of precipitation in the range of 1 percent (Figure 3c, d, e).
b
a
d
c
e
Figure 3. The significant increasing fluctuations of precipitation in the stations of [Babolsar (a) and Abadan (b)] and decreasing annual precipitation in the stations of [Zahedan (c), Tabriz (d) and Orumeih (e)] in the study period 1951-2005
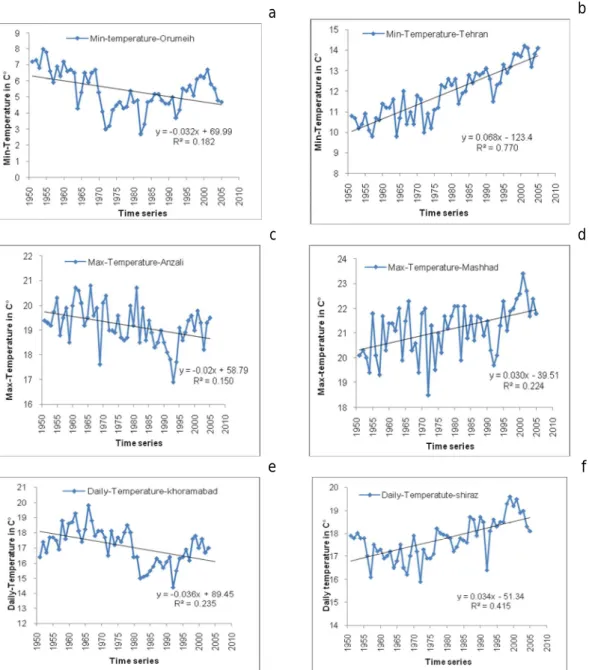
increasing temperature trends. Therefore, the station of Anzali with the decadal decrease of temperature by the amount of -0.11 and the Mann-Kendall significance coefficient with the value of -2.45 and the significant area of 5 percent, the station of Khoramabad with the decadal decrease of temperature by the amount of -0.17 and the significant area of 5 percent, and finally the station of Torbat Heydarie with the decadal decrease of temperature by the amount of -0.17 and the statistical value of the Mann-Kendall coefficient of -2.72, are significant in the range of 1 percent. It is worth noting that apart from the decreasing trend of temperature for the coordinate of minimum temperature in the station of Khoramabad, this decreasing trend of temperature is observed in maximum temperature as well.
The significant trend of the increase in the maximum annual temperature in the order of the magnitude of significance is observed in the stations of Mashhad (Mt=3.85), Yazd (Mt=3.76), Babolsar (Mt=3.58), Bam (Mt=3.56), Sabzevar (Mt=3.40), Sanandaj (Mt=3.27), Shiraz (Mt=3.23), Kermanshah (Mt=3.07), Tabriz (Mt=3), Hamedan (Mt=2.85), Abadan (Mt=2.61), and Tehran (Mt=2.11) (Figure 5c). All in all, the average of the decadal increase in temperature for the stations with a significant trend is 0.31 degrees of centigrade, with fluctuations from its maximum in the station of Bam (0.43 degrees of centigrade) and the minimum decadal increase in temperature in the station of Tehran (0.21 degrees of centigrade).
b
a
d
c
f
e
Figure 5. The fluctuations of the annual trend of the coordinates of precipitation (a), minimum temperature (b), maximum temperature(c) and average temperature (d) using the method of Mann-Kendall for the studied stations
a b
3.2. Evaluating the role of sun spots in fluctuations of the coordinates of temperature and precipitation of Iran
Table 2. The correlation coefficient between the amounts of annual precipitation and the fluctuations of the number of sun spots with the 5, 8, 11, and 22-year moving averages
Precipitation Normal series Moving average 5
Moving average 8
Moving average 11
Moving average 22
Statical value
Station
R P R P R P R P R P
Babolsar 0.14 0.302 0.26 0.061* 0.08 0.600 -0.08 0.609 0.24 0.171
Bandarabas 0.18 0.235 0.16 0.303 0.27 0.094* 0.48 0.003*** 0.87 0.000***
Bushehr 0.16 0.237 0.21 0.142 0.29 0.044** 0.19 0.209 0.34 0.046**
Esfahan -0.10 0.472 -0.03 0.824 0.14 0.336 -0.07 0.625 0.32 0.066*
Ghazvin -0.05 0.746 0.22 0.155 0.46 0.003*** 0.65 0.000*** 0.57 0.002***
Gorgan 0.38 0.005*** 0.37
0.008*** 0.20 0.178 0.06 0.703 -0.40 0.022**
Kerman -0.05 0.440 -0.02 0.863 0.39 0.007*** 0.63 0.000*** 0.44 0.009***
Kermanshah 0.009 0.952 -0.09 0.509 -0.31 0.034** -0.70 0.000*** -0.57 0.001***
Mashhad -0.02 0.884 0.07 0.638 0.22 0.134 0.36 0.015** 0.40 0.020**
Rasht 0.004 0.976 -0.008 0.957 0.05 0.748 -0.05 0.776 0.24 0.217
Shahrekord -0.27 0.069* -0.39
0.008*** -0.12 0.443 -0.13 0.453 0.17 0.398
Shiraz -0.04 0.771 0.03 0.810 0.35 0.016** 0.30 0.043** 0.49 0.003***
Tabriz -0.17 0.216 -0.25 0.073* -0.21 0.148 -0.25 0.100* -0.45 0.008***
Tehran -0.06 0.685 -0.07 0.648 -0.02 0.893 -0.11 0.477 0.22 0.222
Yazd 0.10 0.475 0.26 0.070* 0.29 0.053* 0.24 0.114 0.20 0.270
Zahedan 0.14 0.308 0.18 0.200 0.35 0.016** 0.36 0.014** -0.02 0.898
Abadan -0.25 0.068* -0.30 0.030** -0.25 0.090* -0.29 0.057* 0.23 0.196
Anzali 0.23 0.092* 0.33 0.017** 0.52 0.000*** 0.62 0.000*** -0.02 0.926
Arak -0.01 0.950 0.02 0.896 -0.09 0.579 -0.51 0.001*** -0.51
0.005***
Bam 0.015 0.921 -0.22 0.145 -0.11 0.487 -0.06 0.739 0.13 0.494
Birjand 0.07 0.615 0.05 0.719 0.26 0.096* 0.67 0.000*** 0.67 0.000***
Hamedan 0.059 0.676 0.22 0.131 0.48 0.001*** 0.44 0.003*** 0.63 0.000***
Khoramabad -0.13 0.348 -0.19 0.195 -0.12 0.418 -0.63 0.000*** -0.41 0.019**
Orumeih -0.09 0.509 -0.11 0.451 0.04 0.774 -0.16 0.299 -0.24 0.173
Ramsar 0.00 0.987 0.12 0.442 0.17 0.279 -0.03 0.846 -0.39 0.035**
Sabzevar 0.05 0.704 0.03 0.838 0.09 0.583 0.17 0.291 0.52 0.003***
Sanandaj -0.04 0.786 0.04 0.800 0.28 0.082* 0.47
0.004*** -0.05 0.828
Shahrud 0.20 0.137 0.15 0.305 -0.14 0.345 -0.28 0.066* 0.17 0.331
Torbate Heydarie 0.12 0.443 0.19 0.233 0.24 0.155 0.43 0.010*** 0.64 0.001***
Zabol -0.06 0.681 -0.12 0.463 -0.11 0.508 0.09 0.606 0.53 0.012**
Zanjan -0.04 0.780 -0.26 0.075* -0.15 0.323 -0.26 0.099* -0.47 0.011**
For the trend fluctuations of the maximum coordinate of temperature, evidences do not agree with this. First of all, for temporal series of normal data and the 5-year moving average, only the increase (decrease) in the occurrence of sun spots has a direct and significant relationship with the increase (decrease) of the maximum coordinate of temperature.
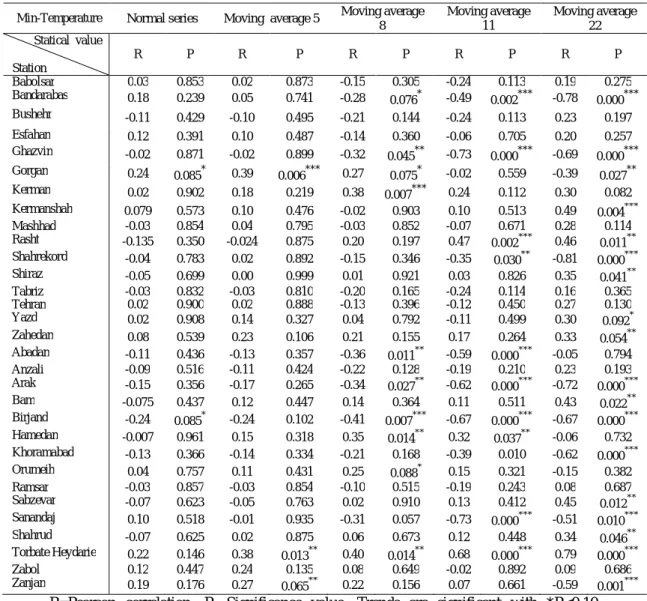
Table 3. The correlation coefficient between minimum temperature and the fluctuations of the number of sun spots with the 5, 8, 11, and 22-year moving averages
Min-Temperature Normal series Moving average 5 Moving average 8
Moving average 11
Moving average 22
Statical value Station
R P R P R P R P R P
Babolsar 0.03 0.853 0.02 0.873 -0.15 0.305 -0.24 0.113 0.19 0.275
Bandarabas 0.18 0.239 0.05 0.741 -0.28 0.076* -0.49 0.002*** -0.78 0.000***
Bushehr -0.11 0.429 -0.10 0.495 -0.21 0.144 -0.24 0.113 0.23 0.197
Esfahan 0.12 0.391 0.10 0.487 -0.14 0.360 -0.06 0.705 0.20 0.257
Ghazvin -0.02 0.871 -0.02 0.899 -0.32 0.045** -0.73 0.000*** -0.69 0.000***
Gorgan 0.24 0.085* 0.39
0.006*** 0.27 0.075* -0.02 0.559 -0.39 0.027**
Kerman 0.02 0.902 0.18 0.219 0.38 0.007*** 0.24 0.112 0.30 0.082
Kermanshah 0.079 0.573 0.10 0.476 -0.02 0.903 0.10 0.513 0.49 0.004***
Mashhad -0.03 0.854 0.04 0.795 -0.03 0.852 -0.07 0.671 0.28 0.114
Rasht -0.135 0.350 -0.024 0.875 0.20 0.197 0.47 0.002*** 0.46 0.011**
Shahrekord -0.04 0.783 0.02 0.892 -0.15 0.346 -0.35 0.030** -0.81 0.000***
Shiraz -0.05 0.699 0.00 0.999 0.01 0.921 0.03 0.826 0.35 0.041**
Tabriz -0.03 0.832 -0.03 0.810 -0.20 0.165 -0.24 0.114 0.16 0.365
Tehran 0.02 0.900 0.02 0.888 -0.13 0.396 -0.12 0.450 0.27 0.130
Yazd 0.02 0.908 0.14 0.327 0.04 0.792 -0.11 0.499 0.30 0.092*
Zahedan 0.08 0.539 0.23 0.106 0.21 0.155 0.17 0.264 0.33 0.054**
Abadan -0.11 0.436 -0.13 0.357 -0.36 0.011** -0.59 0.000*** -0.05 0.794
Anzali -0.09 0.516 -0.11 0.424 -0.22 0.128 -0.19 0.210 0.23 0.193
Arak -0.15 0.356 -0.17 0.265 -0.34 0.027** -0.62 0.000*** -0.72 0.000***
Bam -0.075 0.437 0.12 0.447 0.14 0.364 0.11 0.511 0.43 0.022**
Birjand -0.24 0.085* -0.24 0.102 -0.41 0.007*** -0.67 0.000*** -0.67 0.000***
Hamedan -0.007 0.961 0.15 0.318 0.35 0.014** 0.32 0.037** -0.06 0.732
Khoramabad -0.13 0.366 -0.14 0.334 -0.21 0.168 -0.39 0.010 -0.62 0.000***
Orumeih 0.04 0.757 0.11 0.431 0.25 0.088* 0.15 0.321 -0.15 0.382
Ramsar -0.03 0.857 -0.03 0.854 -0.10 0.515 -0.19 0.243 0.08 0.687
Sabzevar -0.07 0.623 -0.05 0.763 0.02 0.910 0.13 0.412 0.45 0.012**
Sanandaj 0.10 0.518 -0.01 0.935 -0.31 0.057 -0.73 0.000*** -0.51 0.010***
Shahrud -0.07 0.625 0.02 0.875 0.06 0.673 0.12 0.448 0.34 0.046**
Torbate Heydarie 0.22 0.146 0.38 0.013** 0.40 0.014** 0.68 0.000*** 0.79 0.000***
Zabol 0.12 0.447 0.24 0.135 0.08 0.649 -0.02 0.892 0.09 0.686
Zanjan 0.19 0.176 0.27 0.065** 0.22 0.156 0.07 0.661 -0.59 0.001***
For this purpose, the distribution frequency of the stations with regards to normal data (without moving average), is 3.22 percent and for the 5-year moving average is 6.45 percent. For the 8-year to 22-year moving averages, the results show that the percentage of the distribution frequency of the stations increase with a significant trend and the share of influence of the increase (decrease) in the number of spots upon the decrease (increase) in the maximum temperature is greater. This share indicates the distribution frequency of 6.45 percent for the 8-year moving average, 29 percent for the 11-8-year moving average, and 45.16% for the 22-year moving average. The correlation coefficients show that there are fewer stations in which the increase (decrease) in the number of sun spots has a direct and significant effect on the increase (decrease) of their temperature. Therefore, these distribution frequencies for the temporal series of data with 8 and 11-year moving averages show 3.22 percent and for the 22-year period show 6.45 percent. However, the sum of the average of distribution frequencies for all the temporal series show that the states in which the increase (decrease) in the number of spots has had a significant effect on the decrease (increase) of the temperature, are about 16.22 percent of the distribution frequency of the stations. This situation is more noticeable in stations like Ghazvin, Bandarabas, Arak, Birjand, Ramsar, and Babol. On the other hand, the sum average of the significance distribution frequency of stations in which the increase (decrease) in the occurrence of spots is accompanied by the increase (decrease) in temperature is just 4.51. The most suitable station that has probably been affected by this process is Bushehr (Table 4).
averages, indicate that the inverse relationship between the occurrence of the number of sun spots and the average annual temperature of Iran has a large share and significance.
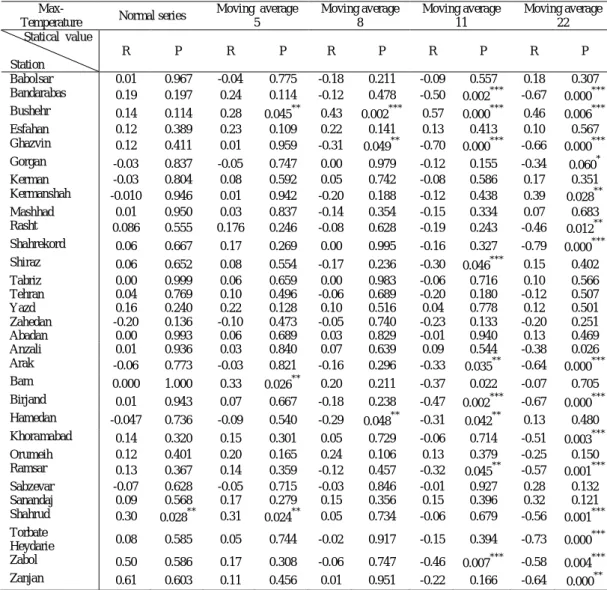
Table 4. The correlation coefficient between the amounts of maximum temperature and the fluctuations of the number of sun spots with the 5-, 8-, 11-, and 22-year moving averages
Max-Temperature Normal series
Moving average 5
Moving average 8
Moving average 11
Moving average 22 Statical value
Station
R P R P R P R P R P
Babolsar 0.01 0.967 -0.04 0.775 -0.18 0.211 -0.09 0.557 0.18 0.307
Bandarabas 0.19 0.197 0.24 0.114 -0.12 0.478 -0.50 0.002*** -0.67 0.000***
Bushehr 0.14 0.114 0.28 0.045** 0.43 0.002*** 0.57 0.000*** 0.46 0.006***
Esfahan 0.12 0.389 0.23 0.109 0.22 0.141 0.13 0.413 0.10 0.567
Ghazvin 0.12 0.411 0.01 0.959 -0.31 0.049** -0.70 0.000*** -0.66 0.000***
Gorgan -0.03 0.837 -0.05 0.747 0.00 0.979 -0.12 0.155 -0.34 0.060*
Kerman -0.03 0.804 0.08 0.592 0.05 0.742 -0.08 0.586 0.17 0.351
Kermanshah -0.010 0.946 0.01 0.942 -0.20 0.188 -0.12 0.438 0.39 0.028**
Mashhad 0.01 0.950 0.03 0.837 -0.14 0.354 -0.15 0.334 0.07 0.683
Rasht 0.086 0.555 0.176 0.246 -0.08 0.628 -0.19 0.243 -0.46 0.012**
Shahrekord 0.06 0.667 0.17 0.269 0.00 0.995 -0.16 0.327 -0.79 0.000***
Shiraz 0.06 0.652 0.08 0.554 -0.17 0.236 -0.30 0.046*** 0.15 0.402
Tabriz 0.00 0.999 0.06 0.659 0.00 0.983 -0.06 0.716 0.10 0.566
Tehran 0.04 0.769 0.10 0.496 -0.06 0.689 -0.20 0.180 -0.12 0.507
Yazd 0.16 0.240 0.22 0.128 0.10 0.516 0.04 0.778 0.12 0.501
Zahedan -0.20 0.136 -0.10 0.473 -0.05 0.740 -0.23 0.133 -0.20 0.251
Abadan 0.00 0.993 0.06 0.689 0.03 0.829 -0.01 0.940 0.13 0.469
Anzali 0.01 0.936 0.03 0.840 0.07 0.639 0.09 0.544 -0.38 0.026
Arak -0.06 0.773 -0.03 0.821 -0.16 0.296 -0.33 0.035** -0.64 0.000***
Bam 0.000 1.000 0.33 0.026** 0.20 0.211 -0.37 0.022 -0.07 0.705
Birjand 0.01 0.943 0.07 0.667 -0.18 0.238 -0.47 0.002*** -0.67 0.000***
Hamedan -0.047 0.736 -0.09 0.540 -0.29 0.048** -0.31 0.042** 0.13 0.480
Khoramabad 0.14 0.320 0.15 0.301 0.05 0.729 -0.06 0.714 -0.51 0.003***
Orumeih 0.12 0.401 0.20 0.165 0.24 0.106 0.13 0.379 -0.25 0.150
Ramsar 0.13 0.367 0.14 0.359 -0.12 0.457 -0.32 0.045** -0.57 0.001***
Sabzevar -0.07 0.628 -0.05 0.715 -0.03 0.846 -0.01 0.927 0.28 0.132
Sanandaj 0.09 0.568 0.17 0.279 0.15 0.356 0.15 0.396 0.32 0.121
Shahrud 0.30 0.028** 0.31 0.024** 0.05 0.734 -0.06 0.679 -0.56 0.001***
Torbate
Heydarie 0.08 0.585 0.05 0.744 -0.02 0.917 -0.15 0.394 -0.73 0.000
***
Zabol 0.50 0.586 0.17 0.308 -0.06 0.747 -0.46 0.007*** -0.58 0.004***
Zanjan 0.61 0.603 0.11 0.456 0.01 0.951 -0.22 0.166 -0.64 0.000**
In any case, this distribution frequency on average covers 13 percent of the temperature fluctuations of the stations. Some of the stations which are most affected by this are Bandarabas, Arak, Ghazvin, Birjand, and Khoramabad. However, the average of distribution frequencies for direct and significant relationship between the number of spots and temperature fluctuations is 7.7 percent. This trend has more stability in the stations of Rasht and Hamedan (Table 5).
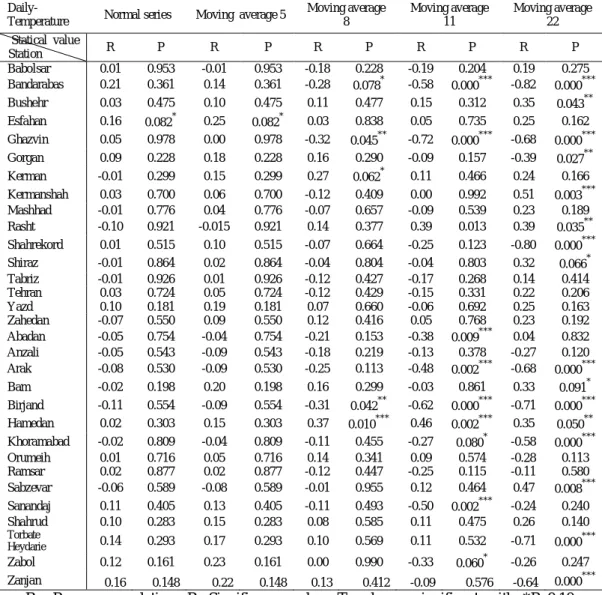
Table 5. The correlation coefficient between the amounts of daily temperature and the fluctuations of the number of sun spots with the 5-, 8-, 11-, and 22-year moving averages
Daily-Temperature Normal series Moving average 5
Moving average 8
Moving average 11
Moving average 22 Statical value
Station R P R P R P R P R P
Babolsar 0.01 0.953 -0.01 0.953 -0.18 0.228 -0.19 0.204 0.19 0.275
Bandarabas 0.21 0.361 0.14 0.361 -0.28 0.078* -0.58 0.000*** -0.82 0.000***
Bushehr 0.03 0.475 0.10 0.475 0.11 0.477 0.15 0.312 0.35 0.043**
Esfahan 0.16 0.082* 0.25 0.082* 0.03 0.838 0.05 0.735 0.25 0.162
Ghazvin 0.05 0.978 0.00 0.978 -0.32 0.045** -0.72 0.000*** -0.68 0.000***
Gorgan 0.09 0.228 0.18 0.228 0.16 0.290 -0.09 0.157 -0.39 0.027**
Kerman -0.01 0.299 0.15 0.299 0.27 0.062* 0.11 0.466 0.24 0.166
Kermanshah 0.03 0.700 0.06 0.700 -0.12 0.409 0.00 0.992 0.51 0.003***
Mashhad -0.01 0.776 0.04 0.776 -0.07 0.657 -0.09 0.539 0.23 0.189
Rasht -0.10 0.921 -0.015 0.921 0.14 0.377 0.39 0.013 0.39 0.035**
Shahrekord 0.01 0.515 0.10 0.515 -0.07 0.664 -0.25 0.123 -0.80 0.000***
Shiraz -0.01 0.864 0.02 0.864 -0.04 0.804 -0.04 0.803 0.32 0.066*
Tabriz -0.01 0.926 0.01 0.926 -0.12 0.427 -0.17 0.268 0.14 0.414
Tehran 0.03 0.724 0.05 0.724 -0.12 0.429 -0.15 0.331 0.22 0.206
Yazd 0.10 0.181 0.19 0.181 0.07 0.660 -0.06 0.692 0.25 0.163
Zahedan -0.07 0.550 0.09 0.550 0.12 0.416 0.05 0.768 0.23 0.192
Abadan -0.05 0.754 -0.04 0.754 -0.21 0.153 -0.38 0.009*** 0.04 0.832
Anzali -0.05 0.543 -0.09 0.543 -0.18 0.219 -0.13 0.378 -0.27 0.120
Arak -0.08 0.530 -0.09 0.530 -0.25 0.113 -0.48 0.002*** -0.68 0.000***
Bam -0.02 0.198 0.20 0.198 0.16 0.299 -0.03 0.861 0.33 0.091*
Birjand -0.11 0.554 -0.09 0.554 -0.31 0.042** -0.62 0.000*** -0.71 0.000***
Hamedan 0.02 0.303 0.15 0.303 0.37 0.010*** 0.46 0.002*** 0.35 0.050**
Khoramabad -0.02 0.809 -0.04 0.809 -0.11 0.455 -0.27 0.080* -0.58 0.000***
Orumeih 0.01 0.716 0.05 0.716 0.14 0.341 0.09 0.574 -0.28 0.113
Ramsar 0.02 0.877 0.02 0.877 -0.12 0.447 -0.25 0.115 -0.11 0.580
Sabzevar -0.06 0.589 -0.08 0.589 -0.01 0.955 0.12 0.464 0.47 0.008***
Sanandaj 0.11 0.405 0.13 0.405 -0.11 0.493 -0.50 0.002*** -0.24 0.240
Shahrud 0.10 0.283 0.15 0.283 0.08 0.585 0.11 0.475 0.26 0.140
Torbate
Heydarie 0.14 0.293 0.17 0.293 0.10 0.569 0.11 0.532 -0.71 0.000
***
Zabol 0.12 0.161 0.23 0.161 0.00 0.990 -0.33 0.060* -0.26 0.247
Zanjan 0.16 0.148 0.22 0.148 0.13 0.412 -0.09 0.576 -0.64 0.000***
4. Conclusion
The earth's climate constantly changes and numerous theories have been proposed to explain these changes. One of the most reliable theories among these is the dependence of the fluctuations of climate on the changes of the sun. In this research, first Mann-Kendall's method was used for identifying any significant trend in average annual temperature and precipitation data in Iran for 31 synoptic stations. The results indicate that because of the high fluctuation coefficient of precipitation, only 5 stations have significant fluctuations between 1951 and 2005. Among these, two stations, namely Abadan and Babolsar have an increasing trend and three stations, namely Orumeih, Zahedan, and Tabriz, demonstrate a decreasing and significant trend of precipitation. In any case, this significant trend for the coordinates of temperature has had greater distribution frequency in the stations; among the different coordinates of temperature (minimum, maximum and daily temperature), the greatest share of significance by the amount of 74.19 percent of the stations is observed for the minimum coordinate of temperature. It is interesting that among these, 64.52 percent of the stations indicate a significant trend in temperature increase. For identifying the relationship between the fluctuations of precipitation and the temperature of Iran and the occurrence of the number of sun spots, the Pearson's correlation was used for these two coordinates. To do that, we did not consider the temporal series of normal data (without moving average) to be sufficient and the moving averages of 5, 8, 11, and 22-year periods were taken into account. Finally the results for Iran's precipitation show that there is evidence of the concordance of the fluctuations of the number of sun spots and the fluctuations of precipitation, whether direct or inverse. The share that most of the distribution frequencies show is 25.16 percent, which has been calculated from comparing the number of sun spots and the precipitation fluctuations in Iran with the overall average of distribution frequencies. This result has more stability for the stations of Bandarabas, Ghazvin, Kerman, Shiraz, Anzali, Birjand, and Hamedan. The results of the research of Jahanbakhsh and Edalatdoust (2008), like our study, indicates the diverse relationship (direct and inverse relationship) between precipitation fluctuations of Iran's stations and sun spots in different regions. The other similarity is that the precipitation of seashore stations like Anzali, Bandarabas, and Bushehr demonstrate a direct relationship with the increase in the number of sun spots.
simultaneous with the occurrence of the maximum (decrease) in the number of spots is 13.5 percent of the distribution frequencies. For this process, we may perhaps refer to stations like Torbate Heydarie, Rasht, Hamedan, and Kerman. The results for the annual average of maximum temperature indicate that the increase (decrease) in the number of spots has had more significant effect on the decrease (increase) of temperature; this share is approximately 16.22 percent of the distribution frequency of the stations. This situation is more noticeable for the stations of Ghazvin, Bandarabas, Arak, Birjand, Ramsar, and Zabol. But on the other hand, the sum average of the significance distribution frequency of stations that the increase (decrease) of the occurrence of spots is simultaneous with the increase (decrease) of temperature is only 4.51 percent. In this situation, the most stable station is Bushehr. Lastly, we may refer to the average annual temperature. This result for the average annual temperature is similar to the other coordinates of temperature; which means that the distribution frequency of the stations that the increase (decrease) in their temperature is simultaneous with the decrease (increase) of the number of spots has the greater share. This amount is approximately 13 percent, but in the case of the direct relationship of the fluctuations of temperature and the number of sun spots, this share is approximately 7.7 percent of the distribution frequencies. To summarize briefly, the increase (decrease) in the number of spots has been simultaneous with the increase (decrease) in the amounts of annual precipitation in Iran and in the case of temperature, the decrease (increase) of the various coordinates of temperature is simultaneous with the increase (decrease) in the number of spots. However, we have to keep in mind that the fluctuations in the trend of the climatic coordinates (temperature and precipitation) are dependent on numerous variables and factors and the fluctuations of the number of sun spots is just one of these factors. As climate change is affected by various human and natural phenomena, it is more advisable to analyze the fluctuations of temperature and precipitation with different components, so that the effect of each factor in the fluctuations may be more clearly evaluated. In any case, by assessing the validity of the results of this research, we can simulate the occurrence of droughts and wet years that are likely to be brought about by the solar activities for future decades and based on that, take necessary steps in risk management in the field of nutritional security and agricultural products.
References
Azizi, G.H., 2004. Climate change, Ghumes Press, Tehran, Iran. 258 Pp.
Beer, J., Mender, W., Stellmacher, R., 2000. The role of the sun in climate forcing, (QSR) Quaternary Sci Rev 19, 403-415.
Baldwin, M.P., Dunkerton, T.J., 2004. The solar cycle and stratosphere-troposphere dynamical coupling, J Atmos Sol-Terr Phy. 68, 358-380.
Christensen, E.F., Sevensmark, H., 2007. Solar- Terrestrial physical division, Danish Meteorological Institute. 156 Pp.
Eddy, J.A., 1976. The Maunder Minimum, Science. 192: 4245, 1189-1202.
Foukal, P., North, G., Wigley, T., 2004. A stellar view on solar variations and climate. Science. 306, 68– 69.
Jahanbakhsh, S., Edalatdoust, M., 2008. The Effect of Solar Activity on the Variation of Annual Precipitation in Iran , Geographical Res.88, 14765-14786 (In Persian).
Hiremath, K,M., 2006. The influence of solar activity on the rainfall over India: cycle-to-cycle variations. J Astrophys Astron.27, 367-372.
Haigh, J. D., 1996. The impact of solar variability on climate. SCIENCE. 272, 981–984. Georgieva, K., Kirov, B., Bianchi, C., 2005. Long-term variations in the correlation
between solar activity and climate. Mem. Soc. Astron. Ital. 76, 965–968.
Khorshid doost, A.M., Ghavidel Rahimi, Y., 2004. The study of the precipitation fluctuations, predicting and determining the wet and dry seasons of Zemestane in Eastern Azerbaijan province, the agricultural. researches. quarterly. 19, 45-56 (In Persian).
Landscheidt, T., 2007. Solar Activity: a dominant factor in climate dynamics, Nova Scotia, Canada.
Le, G.M., Wang, J.L., 2003. Wavelet analysis of several important periodic properties in the relative sunspot numbers. Chin. J. Astron. Astrophys. l3, 391-394.
Lambert, F. H., Stott, P.A., Allen, M.R., Palmer, M.A., 2004. Detection and attribution of changes in 20th century land precipitation. Geophys. Res. Lett.Geophys. Res. Lett. 31, L10203.
Marsh, N., Svensmark, H., 2003. Solar influence on Earth’s climate. Space Sci Rev.107, 317–325.
Modarres, R., Silva, V.P.R., 2007. Rainfall trends in arid and semi-arid regions of Iran. J Arid Environ. 70, 344–355.
Partal, T., Kahya, E., 2006. Trend analysis in Turkish precipitation data. Hydro Process. 20, 2011–2026.
Rahimzadeh, F., Asgari, A., Fattahi, E., 2009. Variability of extreme temperature and precipitation in Iran during recent decades. Int. J. Climate. 29, 329–343.
Santer, B.D., Taylor, K.E., Wigley, T.M., 1996. A search for human influences on the thermal structure of the atmosphere. Nature. 382, 39-46.
Shindell, D., Rind, D., Balabhandran, N., Lean, J., Lonergan, P., 1999. Solar cycle variability, ozone, and climate. Science. 284, 305–308
Scafetta, N., West, B. J., 2006. Phenomenological solar contribution to the 1900-2000 global surface warming. Geo. Res. Let. 33, L05708
Tabari, H., Marofi, S., 2011a. Changes of pan evaporation in the west of Iran. Water Resour Manage. 25, 97–111.
Tsiropoula, G., 2003. Signatures of Solar Activity variability in meteorological parameters. J. Atoms Sol. Terr. Phy, 65, 469-482.
Tabari, H., Hosseinzadeh Talaee, P., 2011. Recent trends of mean maximum and minimum air temperatures in the western half of Iran. Mete. Atmos. Phys. 111, 121–131.
Wigley, T. M. L., 1988. The climate of the past 10,000 years and the role of the Sun, in Secular Solar and Geomagnetic Variations in the Last 10,000 Years, edited by F.R. Stephenson and A. W. Wolfendale, Springer, New York. pp. 209– 224
Zanchettin, D., Rubino, A., Traverso, P., Tomasino, M., 2008. Impact of variations in solar activity on hydrological decadal patterns in northern Italy. J. Geo. Res. 113, doi:10.1029/2007JD009157.
![Figure 3. The significant increasing fluctuations of precipitation in the stations of [Babolsar (a) and Abadan (b)] and decreasing annual precipitation in the stations of [Zahedan (c), Tabriz (d) and Orumeih (e)] in the study period 1951-200](https://thumb-us.123doks.com/thumbv2/123dok_us/8955568.1864936/9.892.177.719.242.883/significant-increasing-fluctuations-precipitation-babolsar-decreasing-precipitation-stations.webp)