Yadav et al. World Journal of Pharmaceutical and Life Sciences
FORMULATION AND EVALUATION OF ETHOSOME (MEFENAMIC ACID) USING
HOT METHOD
Kamlesh Kumar Yadav*1 and Navneet Kumar Verma2
1
Department of Pharmaceutics, R. K. Pharmacy College, Azamgarh, UP, India.
2Department of Pharmaceutics, Kailash Institute of Pharmacy and Management, Gorakhpur, UP, India.
Article Received on 12/04/2018 Article Revised on 03/05/2018 Article Accepted on 24/05/2018
INTRODUCTION
Ethosomal drug delivery system is non-invasive and delivers the drug to the deep skin layers to systemic circulation. Ethosomes are soft, malleable vesicles composed mainly of phospholipids, ethanol and water having a size range from tens of nanometres to microns. Size of ethosomes depends upon the method of preparation and application of techniques like sonication. These “soft vesicles” represents novel vesicular carrier for enhanced delivery through skin. The soft, malleable vesicles tailored for enhanced delivery of active agents.[1,2] High concentration of alcohol (20-45%) in the formulation provides soft, flexible characteristics and stability to the vesicles and it also disrupts lipid bilayer structure of the skin results in an increase in the membrane permeability.[3] Ethosomes causes disturbance of skin lipid bilayer organization when they incorporate in to a vesicle membrane and it enhances the vesicles ability to penetrate the stratum corneum. The synergistic effects of combination of phospholipids and high concentration of ethanol in vesicular formulation have been suggested to be responsible for deeper distribution and penetration in the skin lipid bilayer.[4] These vesicular systems were found to be highly ancient carriers for the delivery of molecules with various lipophilicities into and through the skin, in in- vitro and in-vivo, in animal and clinical studies The use of lipid
vesicles, such as liposomes, as safe vehicles for topical drug-delivery systems has attracted increasing attention due to their effectiveness in entrapping drugs and delivering them to the skin.[5] Transdermal route is the most successful innovative research area in drug delivery. Ethanol in the ethosomes increases the cell membrane lipid fluidity, which results in increased skin Penetrability of ethosomes.[6]
MATERIALS AND METHODS
Mefenamic acid was gift sample from Hellios pharmaceuticals Baddi (H.P.), Soya phosphatidyl choline was purchaged from Sigma Aldrich (Mumbai). Propylene Glycol, Ethanol from Nice chemicals. All other materials used in the study were of analytical grade.
Preparation of Ethosome by Hot Method
According to this method, phospholipid was dispersed in water by heating in a water bath at 40⁰C until a colloidal solution is obtained. Ethanol, propylene glycol and drug was mixed in a separate vessel and heated upto 40⁰C. Organic phase was added to aqueous phase and stirred for 5 min. The vesicle size of ethosomal formulation was decreased to desire extent using sonication. Finally, the formulation was properly stored.[7]
World Journal of Pharmaceutical and Life Sciences
WJPLS
www.wjpls.org
SJIF Impact Factor: 5.088*Corresponding Author:Kamlesh Kumar Yadav
Department of Pharmaceutics, R. K. Pharmacy College, Azamgarh, UP, India.
ABSTRACT
Ethosomes are amphiphilic novel lipid vesicular systems that have shown their potential in improving the bioavailability of poorly water soluble as well as poorly lipophilic drugs. Mefenamic acid is anthranilic acid
derivative agent and belongs to Biopharmaceutical classification system class II drugs that show poor water
solubility as well as poor lipophilic character. Oral use of Mefenamic acid contraindicated resulting from sever side effect, thus topical administration is recommended. The present research work Ethosomal vesicles were successfully developed through hot method under stirring and sonicated and evaluated DSC thermograms, Particle
size distribution, Vesicles shape, In-vitro Permeation study and Stability study. The present study demonstrates that
the ethosome vesicle found to be Particle size distribution was found good. Stability study was found 97.85%,
98.69% and 98.43% as respectively. In vitro drug release 94.509%, 95.957% and 88.068% respectively as per
formulation (MET1, MET2, and MET3).The entrapment of drug in vesicles found to be 57.98%, 67.26% and 33.19
% respectively, solubility and availability of drug at the site.
Table 1: Preparation formula of Mefenamic ethosomes.
Formulation code Phospholipid (%w/w) Ethanol (%v/v) Propylene Glycol(%v/v) Drug(%w/w)
MET1 1 20 10 1
MET2 2 30 10 1
MET3 3 40 10 1
EVALUATION OF ETHOSOMES
Vesicle size and zeta potential
Particle size of vesicle can be determined by dynamic light scattering. The charge of the ethosomal vesicle is an important parameter than can influence both vesicular properties such as stability as well as skin- vesicle interactions and it’s zeta potential can also be determined using a computerized inspection system. The size of the vesicles can be characterized by light microscopy with an eye piece micrometer which is calibrated with a stage micrometer.[7]
Optical microscopy observation and Vesicle Shape The ethosomal dispersion was spread on the glass slide using a glass rod. Formation of multilamellar vesicles was confirmed by examining the ethosomal suspension under an optical microscope with the magnification power of 100 x. The vesicle shape of best formulation was determined by using scanning electron microscopy.[8]
Differential scanning Colorimetry (DSC)
Differential scanning calorimetry (DSC) is used to determine the transition temperature of vesicular lipid system. Lipid bilayer exhibit various phase transitions that are studied for their roles in triggered drug release. Lipid bilayer can exists in a low-temperature solid ordered phase and above a certain temperature in a fluid-disordered phase. The temperature of this phase transition can be tailored by selecting the proper lipids.[9]
Entrapment efficiency
Entrapment efficiencies of ethosomes formulations were carried out by centrifugation method. The ethosome was centrifuged at 8000 rpm for 10min at 4ºC. Then the solid mass was separated from the supernatant and the suitable dilutions were prepared with PBS (pH 7.4). The drug concentration was assayed by U.V spectrophotometer method at 279 nm. The percentage of drug entrapment was calculated by the following equation.[10]
Entrapment efficiency = (T - C) x 100/T
Where: T is total amount of drug that is detected both in the supernatant layer and resident layer.
C is the amount of drug detected only in the supernatant.
In-vitro Drug Permeation Study
The in vitro permeation study was carried out by using modified Franz diffusion cell with egg membrane. The study was performed with phosphate buffer saline (pH 7.4). The formulation was placed (equivalent to 2.5 mg of drug) on the upper side of skin in donor compartment.
The temperature of the assembly was maintained at 37±2º. Samples were withdrawn after every hour from the receptor media through the sampling tube and at the same time, same amount of fresh receptor media was added to make sink condition. Withdrawn samples were analyzed for aceclofenac constant using UV spectrophotometer.[11]
Stability study
Stability study was carried out for Mefenamic ethosomal preparation at two different temperature i.e. refrigeration temperature (4 ± 2°C) & at room temperature (27 ± 2°C) for 8 weeks. The formulation subjected for stability study was stored in borosilicate container to avoid any soil of interaction between the ethosomal preparation and glass of container, which may affect the observations.12
RESULTS AND DISCUSSION
Zeta Potential
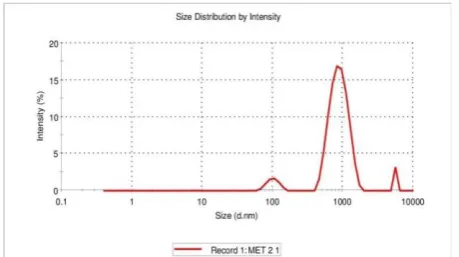
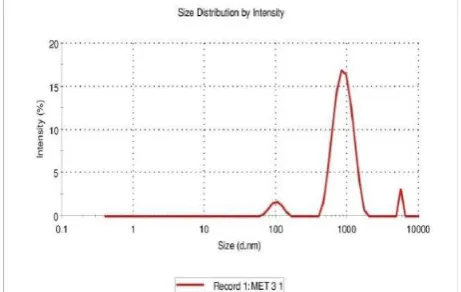
Microscopic analysis was performed under defferent magnification to visualize the vesicular structure lamellarity and to determine the size of ethosome preparation. The effect of phospholipids concentration on the size and distribution of ethoosomes vesicles was investigated by using Malvern Zetasizer.
Fig 1: Zeta potential distribution plot of MET1
formulation.
Fig 2: Zeta potential distribution plot of MET2
Fig 3: Zeta potential distribution plot of MET3 formulation.
VISUALIZATION OF VESICALS BY PHASE CONTRAST MICROSCOPY AND SCANNIND ELECTRON MICROSCOPY (SEM)
The vesicles were uniform in size and appeared to be multilayered. Visual observation of Ethosomes confirmed the multi-lamellar vesicular structurs. Photomicrographs were taken using video camera connected to microscope with the help of computer installed with special software proved the multi-lamellar vesicular structure and spherical shape of Ethosomes of Mefenamic acid. Phospholipid vesicle can be confirmed by further analysis by scanning electron microscopy (SEM).
Fig 4: Photomicroscopy of Ethosome formulation. Fig 5: SEM of Ethosome formulation.
SIZE AND SHAPE ANALYSIS
The Ethosomal dispersion was spread on glass slide. Formation of multilamellar vesicles was confirmed by examining the Ethosomal dispersion under an optical microscope with magnification power of 100X. The examination of prepared formulations revealed the predominance of spherical shaped vesicles. The vesicles were uniform in size and appeared to be multilayered. Visual observation of Ethosomes confirmed the multi-lamellar vesicular structures. Photomicrographs were taken using video camera connected to microscope with
the help of computer installed with special software proved the multi-lamellar vesicular structure and spherical shape of Ethosomes of Mefenamic acid. The ethosomal formulation (MET1) prepared with 20% (w/v)
ethanol and 1% (w/v) phospholipids show an average vesicle size of 1.9625μm. When concentration of ethanol was increased the size of the vesicles decreased, the smallest vesicles were observed in preparation containing 30% ethanol which was 1.73125 μm (MET2)
and largest in preparation containing 40% ethanol 1.98125μm (MET3) were observed during study.
Table 2: Size distribution of Mefenamic Ethosome formulation.
Size range Formulations
MET1 MET2 MET3
Eye piece micrometer
division
Calibrated stage Micrometer(µm)
Average size (d)
No.of vesicles
(n)*
% Vesicles
No.of vesicles
(n)*
% vesicles
No.of vesicles
(n)
% vesicles
0-1 0 - 1.25 0.625 80 40 92 46 78 39
1-2 1.25 - 2.5 1.875 60 30 60 30 58 29
2-3 2.5 - 3.75 3.125 40 20 32 16 44 22
3-4 3.75 – 5 4.375 10 5 12 6 12 6
4-5 5 - 6.25 5.625 6 3 3 1.5 5 2.5
Table 3: Average size Distribution of Mefenamic Ethosomes Formulation.
S. No. Formulation Average size (µm)
1. MET1 1.9625
2. MET2 1.73125
3. MET3 1.98125
Fig 6: Size Distribution of Ethosomes Formulation. Fig 7: Average Size distribution Ethosomeformulation.
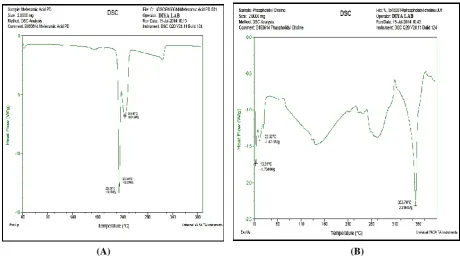
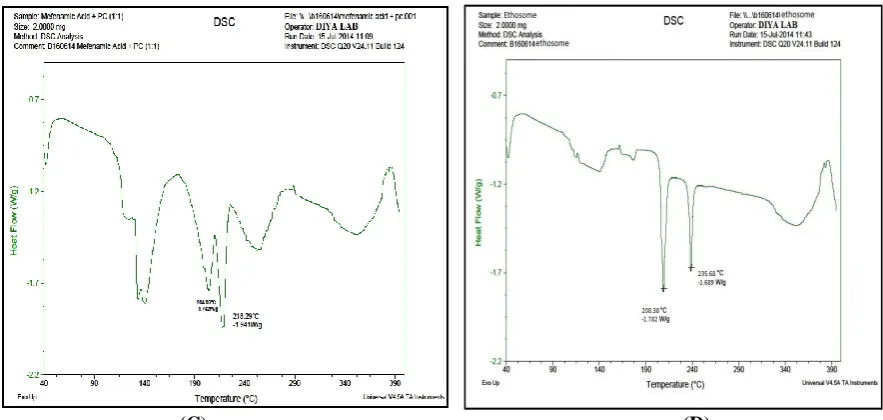
INCOMPATIBILITY STUDY OF FORMULATION
The Incompatibility Study of Formulation done by DSC. DSC thermograms of pure drug and corresponding drug carrier system are depicted in the DSC curve of Mefenamic Acid shows a sharp endothermic peak (Tpeak = 232.38°C) corresponding to its melting, indicating its crystalline nature. Phospholipid showed a sharp endotherm at 13.91°C, 22.32°C, corresponding to its transition temperature. The mixer showed a sharp endotherm at 204.03°C and 218.29°C corresponding to its melting point/transition temperature. DSC
thermogram of Mefenamic loaded thermogram was observed at 208.380 C and 235.680C .This signifies that incorporated Mefenamic has interacted well with phospholipid. The absence of Mefenamic melting thermogram also proves the enhanced entrapment of drug within the vesicles. There was no appreciable change in the melting endotherms of the physical mixture (mefenamic + phospholipid) compared to pure drug.
(C) (D)
Fig 8: DSC thermograms of (A) Mefenamic acid Mefenamic ethosome (B) phosphatidyl coline (C) Mefenamic +phosphatidyl coline (D) Mefenamic Ethosome.
ENTRAPMENT EFFICIENCY
The presence of bilayer vesicles was confirmed in the Ethosomal system, the ability of vesicles for entrapment of drug was investigated by ultracentrifugation. Ultracentrifugation was the method used to separate the ethosomal vesicles containing drug and unentrapped or free drug, to find out the entrapment efficiency. The maximum entrapment efficiency of ethosomal vesicles as determined by ultracentrifugation was 67.26% for ethosomal formulation containing 30% ethanol (MET2)
which was almost double to the formulation containing
40% ethanol (MET3). As the ethanol concentration
increased from 20% to 30% w/w, there was increase in the entrapment efficiency and with further increase in the ethanol concentration (>30% w/w) the vesicle membrane becomes more permeable that lead to decrease in the entrapment efficiency. Results of entrapment efficiency also suggest that 2% phospholipid is optimal concentration for entrapment efficiency and hence increased or decreased in concentration of phospholipid reduces the entrapment efficiency of vesicles.
Table 4: Drug entrapment efficiency of ethosomes.
Sample Absorbance Conc
(µg/ml)
Amount of drug CxDF(µg)
Entrapped drug E=T–U(µg)
% Drug entrapped =E/Tx100
MET1
Total drug(T) 0.5912 9.747 1949.4
1130.4 57.98
Free drug (U) 0.2496 4.095 819
MET2
Total drug(T) 0.5783 9.533 1906.6
1282.3 67.26
Free drug (U) 0.1904 3.122 624.4
MET3
Total drug(T) 0.6014 9.9454 1989.08
660.28 33.19
Free drug (U) 0.4035 6.644 1328.8
Fig. 9: Entrapment efficiency of different ethosomes vesicles.
IN-VITRO SKIN PERMEATION STUDIES
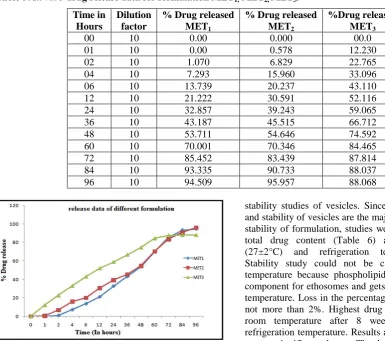
In-vitro skin permeation study or in vitro skin diffusion study have been extensively studied using Franz diffusion cell and epidermal surface of rat skin. The objectives in the developments of in-vitro diffusion tests are to show the release rates and extent of drug release from dosage form. Skin permeation study was carried out for 96 hours duration; all results were shown on table and represented graphically.
30.591±0.17% after 12 hours of study. After 24 hours of diffusion, the percentage drug release was 39.243±0.18%. There was an increase of nearly 11 % in drug release during the twelve-hour duration. The percentage drug release on 48th, 60th hours of study was
54.646±0.16% and 70.346±0.19% respectively for MET2. At the end of diffusion study after 96 hours, the
percentage drug release from MET2 was 95.957±0.05% and 4.043% was remaining within the MET2.
Table 5: In vitro drug release data for formulation MET1, MET2, MET3.
Time in Hours
Dilution factor
% Drug released
MET1
% Drug released
MET2
%Drug released
MET3
00 10 0.00 0.000 00.0
01 10 0.00 0.578 12.230
02 10 1.070 6.829 22.765
04 10 7.293 15.960 33.096
06 10 13.739 20.237 43.110
12 10 21.222 30.591 52.116
24 10 32.857 39.243 59.065
36 10 43.187 45.515 66.712
48 10 53.711 54.646 74.592
60 10 70.001 70.346 84.465
72 10 85.452 83.439 87.814
84 10 93.335 90.733 88.037
96 10 94.509 95.957 88.068
Fig 10: Invitro cumulative drug release of ethosomes
formulation (MET1,MET2,MET3).
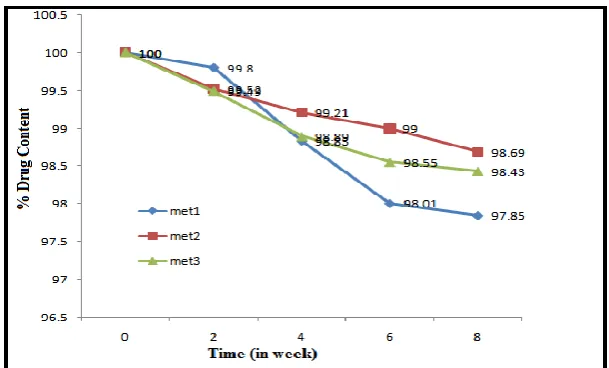
STABILITY STUDY OF ETHOSOME
The accelerated stability studies were carried out in accordance with the ICH guidelines. The ability of vesicles to retain the drug was assessed by keeping the Ethosome suspension at different temperature. Optimized Ethosomes formulations were selected for
stability studies of vesicles. Since the stability of drug and stability of vesicles are the major determinant for the stability of formulation, studies were carried to evaluate total drug content (Table 6) at room temperature (27±2°C) and refrigeration temperature (4±2°C). Stability study could not be carried out at higher temperature because phospholipid was used as on the component for ethosomes and gets deteriorated at higher temperature. Loss in the percentage of drug content was not more than 2%. Highest drug loss was observed at room temperature after 8 weeks as compared to refrigeration temperature. Results also showed that there was no significant change. The drug content in different formulations, indicating the stability of drug even after 8 weeks. Entrapment efficiency is the integral part of stability of vesicles, hence selected to show the stability of prepared formulation. According to the data (Table 7) indicate that formulations stored at refrigeration temperature were found to show higher entrapment efficiency.
Table 6: Data of stability studies for drug content at two different temperatures.
Formulation
Drug content in %
Initial After 2 weeks After 4 weeks After 6 weeks After 8 weeks
4±2oC 27±2oC 4±2oC 27±2oC 4±2oC 27±2oC 4±2oC 27±2oC 4±2oC 27±2oC MET1 100 100 99.85 99.80 99.66 98.83 99.24 98.01 98.74 97.85
MET2 100 100 99.74 99.52 99.56 99.21 99.43 99.00 99.17 98.69
Fig. 11: Loss of Percentage Drug content of the vesicles (MET1, MET2, MET3) during stability study.
Table 7: Data of stability studies for entrapment efficiency at two different temperatures.
Formulation
Entrapment study
Initial After 2 weeks After 4 weeks After 6 weeks After 8 weeks
4±2 oC 27±2 oC 4±2 oC 27±2 oC 4±2 oC 27±2 oC 4±2 oC 27±2 oC 4±2 oC 27±2 oC MET1 58.78 58.78 58.17 57.31 57.91 55.29 57.72 54.11 57.43 52.24
MET2 71.48 71.48 71.13 70.56 70.58 68.39 70.30 66.03 69.71 64.17
MET3 43.01 43.01 42.56 42.03 42.21 40.67 41.87 39.55 41.22 38.35
Fig 12: Loss of Percentage Drug entrapment efficiency of MET1, MET2, MET3 during stability study.
CONCLUSION
The ethosomal formulation of Mefenamic was prepared with the view to improve therapeutic response and reduce the possible adverse symptoms. Here ethosomes of Mefenamic acid were prepared using Hot process. Percentage entrapment efficiency was optimized after studying the effect of various levels of ethanol in the formulation. Maximum entrapment efficiency was found to be 67.26 % with 30% ethanol concentration. The prepared ethosomes were found to have good morphological properties and size distribution. From DSC thermograms of ethosomes it can be concluded that significant interaction occur between drug and lipid components of the vesicles that lead to higher
entrapment efficiency. The percentage drug release from the Mefenamic Ethosomes was found to be 95.957 % after 96 hours of in-vitro studies. Stability studies showed maximum percent drug retention capabilities of ethosomes. These results conclusively demonstrated provide better relief from the disease and reduces the duration of therapy.
ACKNOWLEDGEMENT
We are grateful to generous support for this work by Central Drug and Research Institute, Lucknow. I would like to thanks senior Miss. Asha Roshan, Mr.Ajay Kumar for helping me each and every time. My research wouldn't have seen the day's light without their constant motivation.
REFERENCES
1. Usha Rai, Dinesh Chandra, Shaundarya Kumar,Ethosomal gel: A novel tool for Topical drug delivery, International Journal of Universal Pharmacy and life Sciences, 2013; 3(2): ISSN: 2249-6793.
2. Gyati Shilakari, Davinder Singh, Abhay Asthana, Novel vesicular carriers for topical drug delivery and their application’s. International Journal of Pharmaceutical Sciences Review and Research, 2013; ISSN 0976 – 044X.
4. D. Akiladevi, Sachinandan Basak, Ethosomes A Noninvasive Approach for Transdermal Drug Delivery. International Journal of Current pharmaceutical Research, 2010; 2(4): ISSN- 0975-1491.
5. Dayan N and Touitou E. Carriers for skin delivery of trihexyphenidyl HCl: ethosome vs liposome. Biomaterials, 2000; 21: 1879-1885.
6. Shaik.Samifar, Shaik. Shaheda sultana, V.Vasu Naik, K. Madhuri, Ethosomes-An Emerging Approach for Vesicular Delivery System. International Journal of Universal Pharmacy and Bio Sciences, 2013; 2(5): (ISSN): 2319-8141. 7. A.R. Rathore, H. Khambete and S. Jain, Preparation
and Characterization of Repaglinide Loaded Ethosomal Gel for the Treatment of NIDDM, International Journal of Pharmaceutical & Biological Archives, 2013; 4(2): 385–390, ISSN 0976–3333.
8. Pavan Kumar Chintala and J. Padmapreetha, Formulation and in-vitro evaluation of gel containing ethosome entrapped with etodolac, International Journal of Pharmaceutical Sciences and Resesarch, 2014; 5(2): 630-635. E-ISSN: 0975-8232; P-ISSN: 2320-5148.
9. Vivek Dave1, Dhirendra Kumar, Shaila Lewis, Sarvesh Paliwal, Ethosome for Enhanced Transdermal Drug Delivery of Aceclofenac, International Journal of Drug Delivery, 2014; 2: 81-92, ISSN: 0975-0215.
10. Narayana Charyulu R., Mehta Satveek, Harish N.M. & Amit B. Patil, A comparative study of terbinafine ethosomal formulation a noval approach, Nitte University Journal of Health Science, 2013; 3: ISSN 2249-7110.
11. Anjali Singh, Priyanka Rathore*, Meenakshi Shukla and Satish Nayak , Comparative studies on skin permeation of miconazole using different novel carriers International Journal of Pharmaceutical Sciences and Resesarch, 2010; 1(9): 61-66 ISSN: 0975-8232.