NEW COMPLEXES OF UREA WITH Hg(II) AND Ni(II) METAL
IONS
Omar B. Ibrahim
[a], Moamen S. Refat
[a,b]*, Mahmoud Salman
[c]and
M. M.
Al-Majthoub
[a,c]Keywords:Urea, Hg(II) , Ni(II), Biological activity, Spectroscopic studies, Thermal analysis.
The complexation of urea (U) with mercury(II) and nickel(II) ions at room temperatures and 60 oC has been studied by many methods
namely elemental analysis, magnetic susceptibility, conductivity measurements, infrared and thermal analysis (TG/DTG), scanning electron microscopy (SEM), Energy-dispersive X-ray spectroscopy (EDX), and x-ray powder diffraction (XRD) method. The physical and spectral data were well explained in terms of the formation of HgCl2.4U.2H2O (1) and Ni(NO3)2.2U.2H2O (2) at room temperature, on one
hand, and HgCl2.2U.2H2O (3) and on the other hand Ni(NO3)2.2U.H2O (4) at 60 oC. On the basis of the infrared spectral data and the values
of stretching vibrational bands of both –C=O and –NH2 groups, the complexation of metal ions toward urea was distinguished. The
enhancement of the microbial treatments against bacteria (Escherichia Coli, Staphylococcus Aureus, Bacillus subtilis and Pseudomonas aeruginosa) and fungi (Aspergillus Flavus and Candida Albicans) was assessed and a remarkable efficiency was recorded for complexes (1) and (2).
* Corresponding Authors
E-Mail: [email protected]
[a] Department of Chemistry, Faculty of Science, Taif University, Al-Hawiah, Taif, P.O. Box 888 Zip Code 21974, Saudi Arabia
[b] Department of Chemistry, Faculty of Science, Port Said University, Port Said, Egypt
[c] Department of Chemistry, Faculty of Science, Al-Hussein Bin Talal University, P.O. Box 20 Ma'an, Jordan
Introduction
Urea, CH4N2O, a white solid which melts at 132C, soluble in water and ethanol, but insoluble in ether was first prepared by Wöhler1 by evaporating a solution containing a mixture of potassium isocyanate and ammonium sulphate. Ammonium isocyanate, which is formed first, undergoes molecular rearrangement to give urea, as shown by the following reaction;
NH4NCO H2NCONH2 (1)
Urea can be prepared in the laboratory by the reaction of ammonia with carbonyl chloride, alkyl carbonates, chloroformates or urethans. Industrially urea is used2-4 for preparing various formaldehyde-urea resins (plastics),5 barbiturates6, and fertilizers.7-10 Urea is also extensively used in the paper industry to soften cellulose and has been used to promote healing in infected wounds and also in many other applications in the field of medicine.11 - 13. Recently, urea is used for the manufacture of hydrazine in which it is treated with alkaline sodium hypochlorite6 and with reactive dyeing.14
Complexes of urea with some metal ions such as [Zn(urea)6]SO4.H2O and [Zn((urea)4](NO3)2.2H2O are used as fertilizers15 -18. Crystal structure studies of urea showed that in solid urea, both of the nitrogen atoms are identical.6 Urea usually coordinates as a monodentate
ligand through the oxygen atom, forming a C=O· · ·M bond. The rare N,O-bidentate coordination mode has been observed in a very limited number of cases.19-22
Raman and infrared spectra of urea have been studied by several scientists.23-33
Urea possesses two types of potential donor atoms, the carbonyl oxygen and amide nitrogens. Penland et al.34 studied the infrared spectra of urea complexes to determine whether coordination occurs through oxygen or nitrogen atoms. If coordination occurs through nitrogen CO stretching frequency is expected to increase with a decrease of CN stretching frequency, the NH stretching frequency in this case may fall to the same range as those of the amido complexes.
On the other hand if coordination occurs through oxygen CO stretching frequency decreases but with no appreciable change in NH stretching frequency. Since the vibrational spectrum of urea itself has been analysed,32 band shifts caused by coordination can easily be checked, for example, the effect of the coordination on the spectra of the complexes of urea with Pt(II) and Cr(III) in which the coordination occurs through nitrogen and oxygen atoms, respectively.34 The mode of coordination of urea with metal ions seems to be dependent upon the type and nature of metal ions. Pd(II) coordinates to the nitrogen, whereas Fe(III), Zn(II), and Cu(II) coordinate to the oxygen of urea.34
In urea-metal complexes, if a nitrogen-to-metal bond is present, the vibrational spectrum of this complex differs significantly from that of the free urea molecule. The N-H stretching frequencies would be shifted to lower values, and the C=O bond stretching vibration, ((C=O)) would be shifted to higher frequency at about 1700cm-1.35
Experimental
Materials
HgCl2, Ni(NO3)2.6H2O and methanol were obtained from Aldrich Company. Urea was received from Fluka chemical company. All chemicals used in this study were of analytical grade and they were used as such without further purification.
Synthesis of Hg(II)) and Ni(II) urea complexes
Synthesis of urea complexes at room temperature
The complexes with composition of HgCl2.4U.2H2O (1) and Ni(NO3).2U.2H2O (2), were prepared by mixing equal aqueous solutions of HgCl2 (2.72 g, 0.01 mole) and Ni(NO3)2.6H2O (2.90 g, 0.01 mole) in 25 mL distilled water with a 50 mL volume of urea solution (6.0 g, 0.1 mole) in methanol. The mixtures were stirred for about 12 hours under refluxed system at room temperature ca. 25
C. The amount of the precipitate so formed was increased with increasing with the time. The precipitated complex so formed was filtered off, dried under vacuo over anhydrous calcium chloride.
Synthesis of urea complexes at 60 oC temperature
The urea complexes, HgCl2.2U.2H2O (3) and Ni(NO3).2U. H2O (4), were prepared by a method similar to that of described for the preparation of urea complexes at room temperature. A 25 mL volume of urea solution (6.0g, 0.1 mole) in methanol was mixed with an equal volume of HgCl2 (2.72 g, 0.01 mole) and Ni(NO3)2.6H2O (2.90 g, 0.01 mole) and with 25 mL of distilled water. The mixtures were stirred for about 2 hours and then heated to 60 C for 6 hours on a water bath under refluxed system. The precipitated products were filtered, dried at 60 C in an oven for 3 hours.
Measurements
The elemental analysis of carbon and hydrogen contents were performed by the microanalysis unit at Cairo University, Egypt, using a Perkin Elmer CHN 2400 instrument. The conductivities of freshly prepared 1.0×10⁻² g/5 cm3 dimethylformamide (DMF) solutions were measured for the soluble urea complexes using Jenway 4010 conductivity meter. Magnetic measurements were performed on the Magnetic Susceptibility Balance, Sherwood Scientific, and Cambridge Science Park- Cambridge-England. The infrared spectra with KBr discs were recorded on a Bruker FT-IR Spectrophotometer (4000–400 cm-1). The thermal studies TG/DTG–50H were carried out on a Shimadzu thermogravimetric analyzer under static air till 800 oC. Scanning electron microscopy (SEM) images and Energy Dispersive X-ray Detection (EDX) were taken in Joel JSM-6390 equipment, with an accelerating voltage of 20 KV. The X-ray diffraction patterns for the urea complexes were recorded on X 'Pert PRO PANanalytical X-ray powder diffraction, target copper with secondary monochromate.
Antibacterial and antifungal activities
Antimicrobial activity of the tested samples was determined using a modified Kirby-Bauer disc diffusion method.38 Briefly, 100 μl of the best bacteria/fungi were grown in 10 mL of fresh media until they reached a count of approximately108 cells/mL for bacteria and 105 cells/mL for fungi.39 100 μl of microbial suspension was spread onto agar plates corresponding to the broth in which they were maintained. Isolated colonies of each organism that might be playing a pathogenic role should be selected from primary agar plates and tested for susceptibility by disc diffusion method.40,41
Of the many media so available, National Committee for Clinical Laboratory Standards (NCCLS) recommends Mueller-Hinton agar due to main reasons that: it results in good batch-to-batch reproducibility. Disc diffusion method for filamentous fungi tested by using approved standard method (M38-A) developed by the NCCLS42 for evaluating the susceptibility of filamentous fungi to antifungal agents.
Disc diffusion method for yeast developed standard method (M44-P) by the NCCLS.43 Plates inoculated with filamentous fungi as Aspergillus Flavus at 25 oC for 48hours; Gram (+) bacteria as Staphylococcus Aureus, Bacillus subtilis; Gram (-) bacteria as Escherichia Coli,
Pseudomonas aeruginosa they were incubated at 35-37
oC for 24-48 hours and yeast as Candida Albicans incubated at 30 oC for 24-48 hours and, then the diameters of the inhabitation zones were measured in
millimetres.38 Standard discs of Tetracycline
(Antibacterial agent), Amphotericin B (Antifungal agent) served as positive controls for antimicrobial activity but filter disc impregnated with 10 μl of solvent (distilled water, chloroform, DMSO) were used as a negative control.
The agar so used is Meuller-Hinton agar that is rigorously tested for composition and pH. Further the depth of the agar in the plate is a factor to be considered in the disc diffusion method. This method is well documented and standard zones of inhabitation have been determined for susceptible values. Blank paper disks (Schleicher & Schuell, Spain) with a diameter of 8.0 mm were impregnated 10 μl of tested concentration of the stock solutions. When a filter paper disc impregnated with a tested chemical is placed on agar the chemical will diffuse from the disc into the agar. This diffusion will place the chemical in the agar only around the disc. The solubility of the chemical and its molecular size will determine the size of the area of chemical infiltration around the disc. If an organism is placed on the agar it will not grow in the area around the disc if it is susceptible to the chemical. The area of no growth around the disc is known as a "Zone of inhibition" or "Clear zone". For the disc diffusion, the zone diameters were measured with slipping calipers of the National for Clinical Laboratory Standards.400
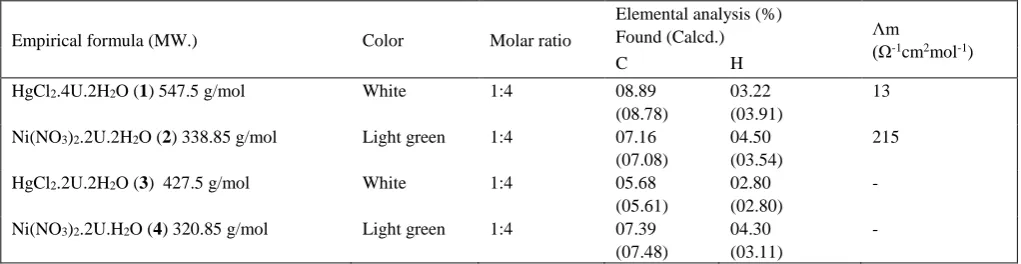
Table 1: Physical characterization, micro-analytical and molar conductance data of urea complexes
Results and Discussion
The color, physical characteristics, micro-analytical data, molar conductance measurements of Hg(II) and Ni(II) urea complexes are given in Table 1. The elemental analysis data of some prepared complexes revealed 1:4 molar ratio (M:U) (where M= Hg(II), Ni(II) and U= urea) are in a good agreement with the general formulas HgCl2.4U.2H2O (1), Ni(NO3)2. 2U.2H2O (2), HgCl2.2U.2H2O (3) and Ni(NO3)2. 2U. H2O (4). It is important to mention that complexes 1, and 2 were prepared at room temperature but complexes 3 and 4 were resulted from the chelation of urea with Hg(II) and Ni(II) ions at 60 oC with molar ratio of urea:metal=4:1. The reactions can be represented by the stoichiometric equations:
Reactions at 25 °C:
HgCl2+ 4U → HgCl2.4U.2H2O (1) (2)
Ni(NO3)2.6H2O + 4U → Ni(NO3)2.2U.2H2O (2) (3)
Reactions at 60 °C
HgCl2+4U+H2O → HgCl2.2U.2H2O (3) (4)
Ni(NO3)2.6H2O + 4U → Ni(NO3)2.2U.H2O (4) (5)
The complexes are air-stable, hygroscopic, with low melting points, soluble in H2O and dimethylformamide. The conductivities of 10-2 g/5 ml solutions of the prepared complexes in DMF (Table 1) indicate that the complexes have an electrolytic nature.
Conductivity measurements
The conductivity values for the urea complexes in DMF solvent (10-2 g/5 ml solution) are 13 and 215 Ω-1 cm2 mol-1 for complexes (1) and (2) respectively suggesting them to be electrolytes (Table 1). Conductivity measurements have frequently been used in structures of metal complexes (mode of coordination) within the limits of their solubility. They provide a method of testing the degree of ionization of the complexes, the molar ions that a complex liberates in solution (in case of presence anions outside the coordination sphere), the higher will be
its molar conductivity and vice versa. It is clear from the conductivity data that the complex (1) seems to be more electrolyte in nature than complex (2).
Also the molar conductance values indicate that the anions present outside the coordination sphere. This result was confirmed from the elemental analysis data where Cl -or NO3- ions are precipitated or colored by adding of
AgNO3 or FeSO4 solutions, respectively, this
experimental test is a good matched with CHN data. Both these complexes have electrolytic properties. This fact elucidated that the Cl- or NO
3- are present. These results establish the stoichiometry of these complexes, which are in agreement with the general formulas were suggested.
Magnetic measurements
Magnetic measurements were carried out on a Sherwood Scientific magnetic balance according to the Gauy method. The calculations were evaluated by applying the following equations:
where
χ is mass susceptibility per gm sample,
c is the calibration constant of the instrument and equal to 0.0816
R is the balance reading for the sample and tube Rois the balance reading for the empty tube M is the weight of the sample in gm T is the absolute temperature
The magnetic moments of Ni(NO3)2.2U.2H2O (2) and Ni(NO3)2.2U.H2O (4) complexes at T= 300 K and were calculated. The observed values of the effective magnetic moments μeff measured were found to be 3.73 B. M. and 2.96 BM. for complexes (2) and (4), respectively, this is convenient with experimental values of 3.32 B.M. obtained46 for octahedral Ni(II) complexes with sp3d2 hybridization for both Ni(II)/U complexes.
Empirical formula (MW.) Color Molar ratio
Elemental analysis (%)
Found (Calcd.) Λm
(Ω-1cm2mol-1)
C H
HgCl2.4U.2H2O (1) 547.5 g/mol White 1:4 08.89
(08.78)
03.22 (03.91)
13
Ni(NO3)2.2U.2H2O (2) 338.85 g/mol Light green 1:4 07.16
(07.08)
04.50 (03.54)
215
HgCl2.2U.2H2O (3) 427.5 g/mol White 1:4 05.68
(05.61)
02.80 (02.80)
-
Ni(NO3)2.2U.H2O (4) 320.85 g/mol Light green 1:4 07.39
(07.48)
04.30 (03.11)
-
cl(R Ro )
g 10 M9 (6)
(7)
m g
χ = χ MWt
2.828 mT
eff (8)
Infrared spectra
The infrared spectra of the Hg(II) and Ni(II) urea complexes at room temperature and at 60 oC are shown in Fig. 1. The band locations were measured for the mentioned urea complexes, together with the proposed assignments for the most characteristic vibrations are presented in Tables 2 and 3. In order to facilitate the spectroscopic analysis and to put our hand on the proper structure of the prepared complexes, the spectra of the urea complexes were accurately compared with those of the urea and similar complexes in literature. The discussion of the spectra will be addressed on the basis of the most characteristic vibrations.
Table 2: Characteristic infrared frequencies (cm–1) and tentative assignments of urea (U), [Pt(urea)2Cl2] (A), [Cr(urea)6]Cl3 (B),
HgCl2.4U.2H2O (1) and Ni(NO3)2.2U.2H2O(2) complexes
Urea A B 1 2 Assignments(b)
3450 3390 3290 3440 3330 3462 3357 3460 3333
(OH); H2O
as (NH2)
3350 3130 3030
3190 - 3361 s(NH2)
1683 1725 1505 1613 1667
1628 1660
(H2O)
(C=O)
1471 1395 1505 1447 1462 (C–N)
The assignments of full vibrational analysis of crystalline urea have been published.34 Tables 2 and 3 give diagnostic infrared peaks of the free urea ligand,
published work Hg(II) and Ni(II) complexes.
Assignments have been given in comparison with the data obtained for the free urea, that is, uncoordinated, U and its [Pt(urea)2Cl2] and [Cr(urea)6]Cl3 complexes.34 The effect of the coordination on the spectra of the complexes of urea with [Pt(urea)2Cl2] and [Cr(urea)6]Cl3 complexes in which the coordination occurs through nitrogen and oxygen atoms, respectively.34 The mode of coordination of urea with metal ions seems to be dependent upon the type and nature of metal. Pt(II) ions in [Pt(urea)2Cl2] coordinate to the nitrogen, whereas Fe(III), Zn(II), and Cu(II) coordinate to the oxygen of urea.34
Table 3: Characteristic infrared frequencies (cm–1) and tentative assignments of urea (U), [Pt(urea)2Cl2] (A), [Cr(urea)6]Cl3 (B),
HgCl2.2U.2H2O (3) and Ni(NO3)2.2U.H2O(4) complexes
Urea A B 3 4 Assignments(b)
3450 3390 3290 3440 3330 3462 3358 3454 3347
(OH); H2O
as (NH2)
3350 3130 3030
3190 2361 3233 s(NH2)
1683 1725 1505 1617 1668 1655
(H2O)
(C=O)
1471 1395 1505 1448 1473 (C–N)
For all the prepared complexes, the coordination mode take place via oxygen of amide group, the positively charged metal ion stabilizes the negative charge on the oxygen atom; the NCO group now occurs in its polar resonance form and the double bond character of the CN bond increases or still not affected, while the double bond character of the CO bond decreases, resulting in an
Figure 1a: Infrared spectra of urea complexes HgCl2.4U.2H2O(1), Ni(NO3)2.2U.2H2O(2), HgCl2.2U.2H2O(3)
and Ni(NO3)2.2U.H2O(4).
increase of the CN stretching frequency with a simultaneous decrease in the CO stretching frequency.47,48 The IR-active ν(M–O) vibration of all prepared urea complexes is observed at the range (637- 479) cm−1.47,48 The band related to the stretching vibration (O-H) of non-coordinated H2O is observed as expected in the range of (3454-3460) cm-1, while the corresponding bending motion of the non-coordinated water, (H2O), is observed in the range of (1613-1628) cm-1.
4000 3500 3000 2500 2000 1500 1000 500 0 30 40 50 60 70 80 90 100 110 % T ra n smi tt a n ce
Wavenumber [cm-1
] 1
4000 3500 3000 2500 2000 1500 1000 500 0 40 50 60 70 80 90 100 110 % T ra n smi tt a n ce
Wavenumber [cm-1
] 2
4000 3500 3000 2500 2000 1500 1000 500 0 60 70 80 90 100 110 % T ta n smi tt a n ce
Wavenumber [cm-1
] 4
4000 3500 3000 2500 2000 1500 1000 500 0 30 40 50 60 70 80 90 100 110 % T ra n smi tt a n ce
Wavenumber [cm-1
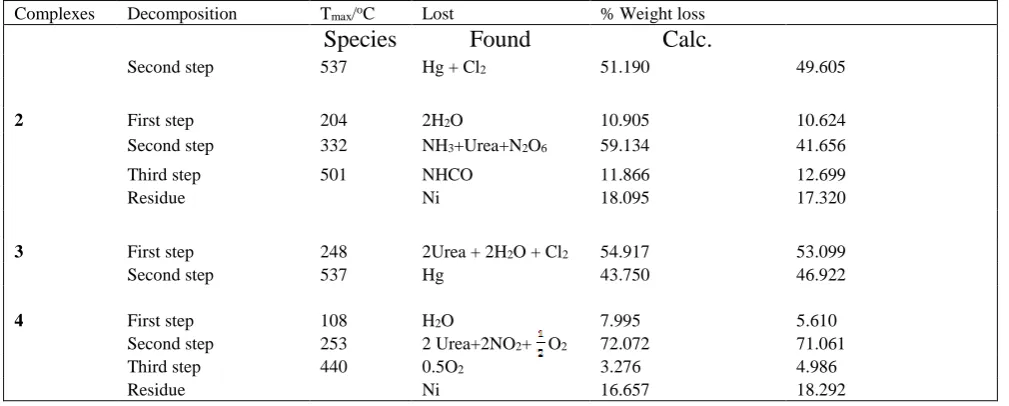
Table 4: The maximum temperature, Tmax/oC, and weight loss values of the decomposition stages for the HgCl2.4U.2H2O(1),
Ni(NO3)2.2U.2H2O(2), HgCl2.2U.2H2O (3) and Ni(NO3)2.2U.H2O(4) complexes.
Complexes Decomposition Tmax/oC Lost % Weight loss
Species
Found
Calc.
Second step 537 Hg + Cl2 51.190 49.605
2 First step 204 2H2O 10.905 10.624
Second step 332 NH3+Urea+N2O6 59.134 41.656
Third step 501 NHCO 11.866 12.699
Residue Ni 18.095 17.320
3 First step 248 2Urea + 2H2O + Cl2 54.917 53.099
Second step 537 Hg 43.750 46.922
4 First step 108 H2O 7.995 5.610
Second step 253 2 Urea+2NO2+ O2 72.072 71.061
Third step 440 0.5O2 3.276 4.986
Residue Ni 16.657 18.292
In both the nickel complexes, the characteristic stretching vibrations of the nitrato group, NO3
-
, is observed at around (1385 and 1156 cm-1
attributed to as(NO3) ands(NO3), respectively. 49 The stretching motion of ((N=O)) is observed at 1477 cm
-1
as a strong band, while the bending motion of the type (NO3) are well resolved and observed at around 784 cm-1 as a medium band.Thermal analysis
Urea complexes; HgCl2.4U.2H2O (1),
Ni(NO3)2.2U.2H2O(2), HgCl2.2U.2H2O (3) and Ni(NO3)2. 2U. H2O (4) were studied by thermogravimetric analysis
from ambient temperature to 800 oC in oxygen
atmosphere. The TG curves and decomposition stages obtained for these complexes with a temperature rate of 30 oC/min are given in the Supplementary material.
Thermal analysis of HgCl2.4U.2H2O (1) complex (Supplementary material) shows that the mercury(II) complex prepared at room temperature is thermally stable up to 140oC. Its thermal decomposition occurs in two stages of maximum temperatures DTGmax=273, and 537
oC, respectively. From the TG-DTG curves
(Supplementary material) it is clear that the first decomposition stage corresponds to the loss of 2 mol of water and 4 mol of urea. The continued loss decomposition in the second step corresponds release of Cl2 and sublimation of mercury or HgCl2 in itself. The probable thermal decomposition of urea released from the complex may be represented as:
H2NCONH2 → NH3 + HNCO
The mechanism of the thermal decomposition of the complex is proposed as:
HgCl2.4U.2H2O → HgCl2→ Cl2 + sublimated Hg
The TG curve of Ni(NO3)2.2U.2H2O (2) complex can be shown in the Supplementary material. Three stages of the dissociation of the complex are indicated in TG and
DTG curve. The first decomposition starts at 178 oC and ends at 261 oC, with an experimental mass loss of 10.905% against a theoretical loss of 10.624%, this corresponds to the release of 2 molecules of water. The second stage takes place between 261 and 405 oC, with an experimental mass loss of 59.134 % against a theoretical loss of 59.138 %, which corresponds to the release of 1 mol of ammonia, 1mol of urea and N2O4 . The last third stage is from 405 to 561 oC with maximum peak at 501 oC, with an experimental mass loss of 11.866 % against a theoretical mass loss of 12.699 %, corresponds to the dissociation of coordinated NHCO leaving Ni as a residue. The mechanism of the thermal decomposition of the complex is proposed as:
Ni(NO3)2. 2U.2H2O → Ni(NO3)2. 2U→ Ni(NCO) → Ni
The TG curve of HgCl2.2U.2H2O (3) complex can be seen in the Supplementary material. The TG-DTG curve indicates that the dissociation of complex is in two stages. The first transition takes place between 137 and 287 oC, with DTGmax= 248 oC, corresponds to the release of 2 mol of urea, 2 mol of H2O and Cl2. The second transformation is from 287 to 453 oC, is due to the sublimation of mercury. The mechanism of the thermal decomposition of the complex is proposed as:
HgCl2.2U.2H2O → Hg → sublimated Hg
The TG-DTG curve of Ni(NO3)2. 2U.H2O (4) complex is also shown in the Supplementary material. Three transition stages of are observed in the TG-DTG curve. The first transition stage is from 46 oC to 205 oC with DTGmax= 108 oC, with an experimental mass loss of
7.996% against a theoretical loss of 5.610%,
corresponding to the release of 1 mol of water . The second transition stage starts at 205 oC and ends at 329 oC, with DTGmax at 253 oC with an experimental mass loss of 72.072% against a theoretical mass loss of 71.061%, due to the release of 2 mol of urea, 2NO2 and 0.5 O2. The last and final transition stage which takes place between 358 oC and 509 oC is due to the loss of 0.5O
sequential thermal dissociation process of the complex can be is shown as follows:
Ni(NO3)2. 2U.H2O → Ni(NO3)2. 2U → NiO →Ni
To clarify the final decomposition products of urea complexes, the solid residues after thermal degradation under oxygen atmosphere were collected at 800 oC and
were analyzed by infrared spectroscopy, X-ray
diffractometry, EDX and SEM.
X- ray powder diffraction studies
The x-ray powder diffraction patterns for the Hg(II) and Ni(II) urea at different temperatures with formulas;HgCl2.4U.2H2O(1), Ni(NO3)2. 2U.2H2O (2), HgCl2.2U.2H2O (3) and Ni(NO3)2. 2U. H2O (4) are depicted in Fig. 3. Inspecting these patterns, we notice that all the systems are well crystalline in nature. The crystal size of these complexes could be estimated from XRD patterns by applying FWHM of the characteristic peaks using Deby-Scherrer equation 150 . Where D is the particle size of the crystal gain, K is a constant (0.94 for Cu grid), λ is the x-ray wavelength (1.5406 Ǻ), θ is the Bragg diffraction angle and β is the integral peak width. The particle size was estimated according to the highest value of intensity compared with the other peaks. These data gave an impression that the particle size located within nano scale range.
(1)
SEM and EDX studies
Scanning electron microscopy is a simplest tool used to give an impression about the microscopic aspects of the physical behavior of urea as a chelating agent (Fig. 3). Although this tool is not a qualified method to confirm complex formation but it can be a reference to the presence of a single component in the synthetic complexes.
The pictures of the Hg(II) and Ni(II) complexes show a small particle size with a nano feature products. The chemical analysis results by EDX for the formed complexes show a homogenous distribution between metal ions and chelating agent. SEM examinations were checked the morphology of the surfaces of these complexes that show small particles which have a tendency to agglomerates formation with different shapes comparison with the start materials. The peaks of EDX profile of these complexes (Fig.5 ) refer to all elements which constitute the molecules of urea complexes (1-4) that clearly identified confirming the proposed structures.
a
a
a
b
b
c
d
Figure 4: SEM image of: HgCl2.4U.2H2O(1),
Ni(NO3)2.2U.2H2O (2), HgCl2.2U.2H2O (3) and
Ni(NO3)2.2U.H2O (4). complexes
D K
cos
001
001
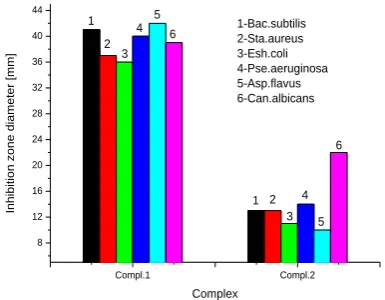
Table 5: Inhibition zone diameter (mm) of the target compounds against tested microorganisms for HgCl2.4U.2H2O (1) and
Ni(NO3)2.2U.2H2O (2) complexes
G: Gram reaction. Solvent: DMSO.
3-8- Biological evaluation
Biological evaluations were checked in terms of antimicrobial activities of target compounds against gram-positive (Bacillus subtilis and Staphylococcus
aureus) and gram-negative (Escherichia coli and
Pseudomonas aeruginosa) and two strains of fungi
(Aspergillus flavus and Candida albicans). Result from the agar disc diffusion tests for antimicrobial activities of target compounds are presented in Table 5,and illustrated in Fig. 4.
Figure 4 : Biological evaluation of HgCl2.4U.2H2O (1) and
Ni(NO3)2.2U.2H2O(2) complexes
The diameters of zone of inhibition (in mm) of the standard drug tetracycline against gram positive bacteria B. subtilis and S. aureus and gram negative bacteria E. coli and P. aeruginosa were found to be 36, 30, 31 and 35 mm, respectively, while the standard drug amphotericin B against Aspergillus flavus and Candida albicans gave 18 and 19, respectively. Under identical conditions, Table 5 shows that, complex 1 has (41, 36, 40, 37, 42 and 39 mm) while complex 2 has (13, 11, 14, 13, 10 and 22 mm)
respectively, for Bacillus subtilis, Escherichia coli,
Pseudomonas aeruginosa, Staphylococcus aureus,
Aspergillus flavus and Candida albicans. Both the
complexes were found to be an efficient microbial agents.
References
1 Wöhler, F., Ann. Phys., 1828, 12 , 253. 2 Tonn, W. H. Jr., Chem. Eng., 1955, 62, 186. 3 Moore, P., Chem. & Eng. News, 1959, 37, 84. 4 Franz, A., J. Org. Chem., 1961, 26, 3304.
5 Feldman, D. Barbalata, A.,“Synthetic Polymers”, Chapman &
Hall, London, 1996.
6 Finar, I. L., Organic Chemistry, Longman Group Ltd., London,
1973, p. 460.
7 Rahman, M. J. and P. Bozadjiev, Y. Polovski, Fert. Res., 1994,
38(2), 89.
8 George, S. Chellapandian, M. Sivasankar, B. Jayaraman, K.,
Bioprocess Eng., 1997, 16(2), 83.
9 Wang, X. J. Douglas, L.A., Agrochimica, 1996, 40(5-6), 209. 10 Yerokun, O. A., S. Afr. J. Plant Soil, 1997, 14(2), 63. 11 Heinig, R., SOFW J., 1996, 122(14), 998.
12 Gnewuch, C. T. Sosnovsky, G., Chem. Rev., 1997, 97(3), 829. 13 Miyagawa, C. I., Drug Intell. & Clin. Pharma., 1986, 20, 527. 14 Kissa, E., Text. Res. J., 1969, 39(8), 734.
15 Srinivasa, I. Vishivanathapuram, K. Mishra, M. B. Ghosh, S.
K., Technology, 1970, 7(12), 27.
16 Kaganskii, I. M. Babenko, A. M., Zh. Prikl. Khim., 1970,
43(11), 2390.
17 Zhang, Y. Bai, J. Wei, T. Lu, A., Huaxue Shijie, 1996, 37(4),
178.
18 Kim, Y. K., Williard, J. W., Frazier, A. W., J. Chem. Eng.
Data, 1988, 33(3), 306.
19 Gentile, P. S. Carfagno, P. Haddad, S. Campisi, L., Inorg.
Chim. Acta, 1972, 6C, 296.
20 Sagatys, D. S. Bott, R. C. Smith, G. Byriel, K. A. Kennard, C.
H. L., Polyhedron, 1992, 11(1), 49.
21 Lewinski, K. Sliwinski, J. Lebioda, L., Inorg. Chem., 1983,
22(16), 2339.
22 Kryatov, V. Nazarenko, A. Y. Robinson, P. D.
Rybak-Akimova, E. V. Chem. Comm., 2000, 11, 921. Inhibition zone diameter (mm / mg sample)
Sample Candida
albicans (Fungus) Aspergillus flavus (Fungus) Staphylococcus aureus
(G+) Pseudomonas aeruginosa
(G-) Escherichia coli
(G-) Bacillus
subtilis
(G+)
23 Bhoopathy, T. J. Baskaran, M. Mohan, S. Indian J. Phys.,
1988, 62B(1), 47.
24 Yamaguchi, A. Penland, R. B. Mizushima, S. Lane, T. J.,
Curran, C., Quagliano, J. V., J. Am. Chem. Soc., 1958, 80, 527.
25 Duncan, J. L., Spectrochim. Acta, 1970, 27A, 1197.
26 Aitken, G. B. Duncan, J. L. Mc Quillan, G. P. J. Chem. Soc. A,
1971, 2695.
27 Hadzi, D. Kidric, J. Knezevic, Z. V. Barlic, B. Spectrochim.
Acta, 1976, 32A, 693.
28 Bala, S. S., Ghosh, P. N., J. Mol. Struct., 1983, 101, 69. 29 Kellner, L. Proc. Roy. Soc., 1941, 177A, 456.
30 Waldron, R. D. Badger, R. M., J. Chem. Phys., 1950, 18, 566. 31 Andrew, E. R. Hyndman, D., Proc. Phys. Soc., 1953, 66A,
1187.
32 Yamaguchi, A. Miyazawa, T. Shimanouchi, T. Mizushima, S.,
Spectrochim. Acta, 1957, 10, 170.
33 Stewart, J. E., J. Chem. Phys., 1957, 26, 248.
34 Penland, R. B. Mizushima, S. Curran, C. Quagliano, J. V., J.
Am. Chem. Soc., 1957, 79, 1575.
35 G. F. Svatos, C. Curran, J. V. Quagliano, J. Am. Chem. Soc.,
1955, 77, 6159.
36 Boron W. F. and Boulpaep, E. L. Medical Physiology,
Updated Edition, Saunders, Philadelphia, Pa, USA, 2004.
37 Meessen J. H. and Petersen, H., „Urea,“ in Ullmann’s
Encyclopedia of Industrial Chemistry, Electronic Release, Wiley-VCH, Weinheim, Germany, 6th edition, 2002.
38 Bauer, A.W. Kirby, W. M. Sherris, C. Turck, M., Am. J. Clin.
Pathol., 1966, 45, 493.
39 Pfaller, M. A. Burmeister, L. Bartlett, M. A. Rinaldi, M. G., J.
Clin. Microbiol., 1988, 26, 1437.
40 National Committee for Clinical Laboratory Standards,
Performance vol. antimicrobial susceptibility of Flavobacteria, 1997.
41 Methods for dilution antimicrobial susceptibility tests for
bacteria that grow aerobically. National Committee for Clinical Laboratory Standards. Approved standard M7-A3, 1993.
42Reference Method for Broth Dilution Antifungal Susceptibility
Testing of Conidium-Forming Filamentous Fungi: Proposed Standard M38-A. NCCLS, Wayne, PA, USA., National Committee for Clinical Laboratory Standards. 2002.
43Methods for Antifungal Disk Diffusion Susceptibility Testing
of Yeast: Proposed Guideline M44-P. NCCLS, Wayne, PA, USA. National Committee for Clinical Laboratory Standards. 2003.
44 Liebowitz, L.D. Ashbee, H.R. Evans, E.G.V. Chong, Y.
Mallatova, N. Zaidi, M. Gibbs, D. and Global Antifungal Surveillance Group, Diagn. Microbiol. Infect. Dis., 2001, 4, 27.
45 Matar, M. J. Ostrosky-Zeichner, L. Paetznick, V. L.
Rodriguez, J. R. Chen, E. Rex, J. H. Antimicrob. Agents Chemother., 2003, 47, 1647.
46 Earnshaw, A. Introduction to Magnetochemistry, Academic
press, London and New York, 1968, p. 35.
47 Diamantopoulou, E. Papaefstatiou, G.S. Terzis, A.
Raptopoulou, C.P. Desseyn, H.O. Perlepes, S. P. Polyhedron, 2003, 22, 825.
48Keuleers, R., Papaefstathiou, G. S., Raptopoulou, C. P.,
Perlepes, S. P., Desseyn, H. O., J. Mol. Struct., 2000, 525(1-3), 173.
49 Nakamoto, K., Infrared and Raman Spectra of Inorganic and
Coordination Compounds, Wiley, New York, 1978.
50 Quan, C. X. Bin, L. H. Bang, G. G., Mater. Chem. Phys. 2005,
91, 317.
Received: 18.09.2012.
![Table 2: Characteristic infrared frequencies (cm–1) and tentative assignments of urea (U), [Pt(urea)2Cl2] (A), [Cr(urea)6]Cl3 (B), HgCl2.4U.2H2O (1) and Ni(NO3)2.2U.2H2O (2) complexes](https://thumb-us.123doks.com/thumbv2/123dok_us/7838711.2090696/4.595.328.514.60.653/table-characteristic-infrared-frequencies-tentative-assignments-hgcl-complexes.webp)