International Journal of Advances in Management and Economics
Available online at:
www.managementjournal.info
RESEARCH ARTICLE
Study on the Effects Working Overtime on Health and Lifestyle of
Tellers of Commercial Banks in Daklak Province
Dung Viet Tran, Dung Van Ha
Banking University HCMC, Vietnam.
Abstract: The paper aims to determine the impact of long working hours on the health and lifestyle of tellers of commercial banks in the province of Daklak. The paper analyzes the system of theoretical basis, refer to the empirical theoretical models of model building and research assumptions. Research processes identified research problems, research objectives to the steps modeling studies, building scale, questionnaire design, collection gathering, processing data analysis, evaluation, and discuss research results. Primary data source collected the direct survey of tellers, conducted by interviewing transactors by detailed questionnaire. A total of studies included in the formal analysis included 321 questionnaires. After standardizing the data, the author used SPSS and AMOS software for analysis. Research results are obtained from quantitative analysis techniques, techniques such as scale reliability testing, EFA discovery factor analysis, CFA affirmative factor analysis, SEM implementation (linear structure). ). The test results of the research hypotheses, 8 research hypotheses of the model are accepted at 95% confidence, from here will be the basis for the implications and policies to be able to prove overtime work have an impact on the health, lifestyle of bank tellers.
Keywords: Overtime, Health, Lifestyle behaviors, Bank tellers.
Article Received: 10 Jan. 2020 Revised: 27 Jan. 2020 Accepted: 18 Feb. 2020
Introduction
Overtime (OT) is often common in production, business and service activities. Recent studies from a survey of working conditions in European Union countries with a sample size of 21, 500 [1] show that 20% of European workers report very long working hours (more than 45 hours / week). The question is whether there is a relationship between working conditions and employee benefits, how long they work, and how many hours / week they work to gain a good physiological health.
A large proportion of long-working
researchers focus on shifting work and too long working weeks [2]. Relatively few people understand the impact of overtime, overtime habits affect workers' health, although the literature shows that long working hours may be related to the risk of overtime. Occupational health and safety [2, 4].
The previous studies have shown that the long hours related to psychological health poor [5, 6], the excessive fatigue [7] and the millions evidence of imbalance [8]. Moreover, several studies have shown that prolonged overtime is associated with an imbalance
between work and family life, in terms of role actions [9] or fatigue. Fatigue, anxiety and irritability [10].In Vietnam, businesses often use overtime as a way to solve the unexpected increase in workload without having to hire additional labor. Part of the workers wants to work overtime to contribute more products and materials to the economy, to the unit, and to benefit them when they can increase their income. However, working overtime is harmful to workers, business owners and society.
In the event that a bank teller has to work overtime regularly, it will cause health consequences, the ability to work out of focus
and cause errors when processing
transactions with customers, affecting business performance and reputation of the banking industry. The study on the effects of overtime on health and lifestyle behaviors of the tellers of Commercial Banks in Daklak province was conducted to find out the factors affecting health, behavior and the lifestyle of Bank tellers due to frequent overtime work.
Through the results of this study to test theory and study the impact of overtime on health, lifestyle behaviors of bank tellers, thereby contributing to limiting overtime, strengthening measures to take care of health, ensure a better life for Bank tellers
and contribute to improving labor
productivity as well as morale for tellers,
contributing to increasing operational
efficiency and profitability for bank tellers Banking industry in Daklak.
Theoretical Basis
In Western countries, the health
consequences of working overtime are the object of interest in many sciences, the topic of workers has always attracted the participation of scientists. Ever. A useful theoretical perspective for studying the relationship between working hours and mental health is the Effort-Recovery model [11]. According to this model, a lot of effort (or work) has a productivity benefit, but it also affects the physiology of the worker in
the short term. In principle, these effects or effects are reversible. When regularly working overtime for a long time, the ability to restore the strength of workers in the working process is not guaranteed. In the long term, exposure to high workloads and inadequate recovery can have a negative impact on workers' health. Moreover, the quality of recovery may be poor due to the adverse effects [12, 13, 14].
In addition, overtime is particularly likely to occur in work overload situations, meaning that the ability to recover physical strength (taking short breaks from work) will also be limited. In the end, inadequate recovery can cause the accumulation of fatigue and ultimately affect health and well-being.
However, there has not been any research work on this issue in Vietnam. Therefore, the research project on the impact of overtime on health and behavior of bank tellers hopes to contribute a part to clarify and prove the theory. Was given by the previous scientists to help realize the role of conditions in the work, while helping workers to be fully aware of working conditions and take positive actions. Extreme in improving yourself and your working environment.
Research Models
Based on the results of research from
theoretical and research institutions,
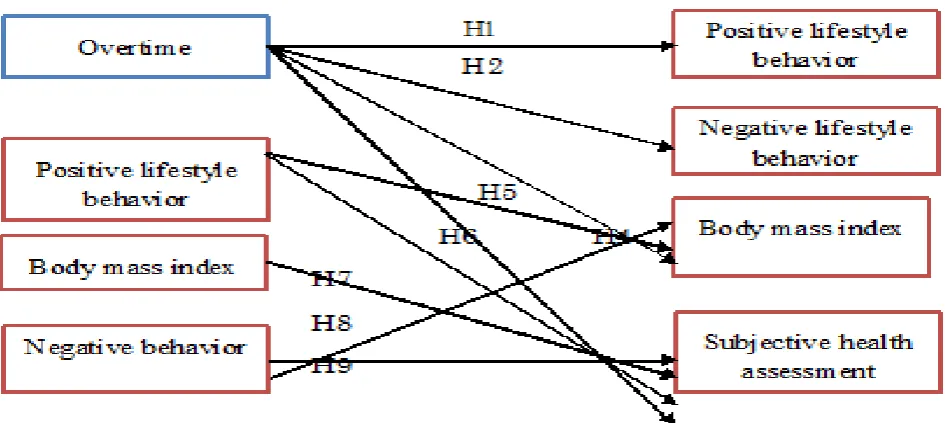
identifying overtime impacts on poor health, and overtime related to employee behaviors, the author proposed the model. Inheritance studies of Taris et al [15]. Are as follows:
Research Hypothesis
Hypotheses are posed as the impact of overtime on subjective health indicators, body mass index, and lifestyle behaviors.
H1: Overtime has an opposite effect on positive lifestyle behaviors
H2: Overtime has a same effect on negative lifestyle behaviors
H3: Overtime has the same effect on body mass index
H4: Overtime has an opposite effect on subjective health
H5: Positive lifestyle behaviors has the
same effect on subjective health
assessments
H6: Positive lifestyle behaviors has an opposite effect on body mass index
H7 : Body mass index has an opposite effect on subjective health
H8 : Negative lifestyle behaviors has the same effect on body mass index
H9: Negative lifestyle behaviors have an opposite effect on subjective health assessments.
Research Methods
Researching through books, magazines, domestic and foreign documents, analyzing the theoretical basis system, referring to empirical theoretical models of model building and research hypotheses. The research process goes through many steps from identifying research issues, research objectives to the steps of building a research model, building a scale, designing a questionnaire, collecting, processing and analyzing data , evaluate and discuss research results. The content of the process is shown through the research process diagram as follows:
In order to achieve the goal of the study, the author focuses on determining the factors affecting the health and lifestyle of transactors due to overtime work. Analysis of indicators affecting health: Back pain, joint pain, vision, stomach pain ... about lifestyle behaviors such as exercise habits, diet, nutrition...
Measure the impact of overtime on health, behavior of bank tellers by developing a complete questionnaire and scale. Based on
the scale of distributing survey
questionnaires to the traders to collect analytical data. Questionnaires are sent to respondents in the form of direct interviews with paper questions. The data was collected from 350 questionnaires, of which 337 were returned, of 337 there were 16 faulty questionnaires and data cleaning, to be included in the official analysis of 321 questionnaires.
And After standardizing the data, the author will use SPSS, AMOS software for analysis.
Research results are obtained from
quantitative analysis techniques, techniques such as scale reliability testing, EFA discovery factor analysis, CFA affirmative factor analysis, SEM implementation (linear structure). From there, give solutions based on the results that the model offers. In addition, the author proposes a number of solutions to the problems that arise and presents the limitations of the research.
Research Results
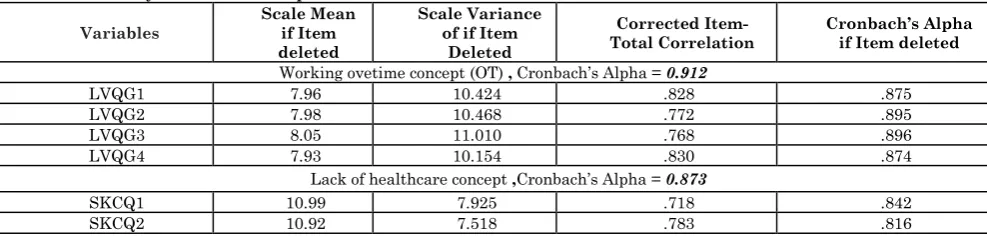
Evaluate the Scale Reliability by Cronback’s Alpha Reliability Coefficient In order to verify the reliability of the scale, the author has tested the Cronbach's Alpha coefficient, with the number of official research samples obtained as 321 samples; this number of samples is very good for verifying the reliability of the scale through the Cronbach's Alpha coefficient.
Table 1: Summary of Cronbach’s Alpha test information
Variables
Scale Mean if Item deleted
Scale Variance of if Item
Deleted
Corrected
Item-Total Correlation Cronbach’s Alpha if Item deleted
Working ovetime concept (OT) , Cronbach’s Alpha = 0.912
LVQG1 7.96 10.424 .828 .875
LVQG2 7.98 10.468 .772 .895
LVQG3 8.05 11.010 .768 .896
LVQG4 7.93 10.154 .830 .874
Lack of healthcare concept ,Cronbach’s Alpha = 0.873
SKCQ1 10.99 7.925 .718 .842
SKCQ3 10.75 7.431 .736 .834
SKCQ4 11.08 7.484 .683 .857
Positive health behavior concept, Cronbach’s Alpha = 0.834
HVSKTC1 8.26 8.294 .722 .766
HVSKTC2 8.28 7.870 .818 .723
HVSKTC3 8.17 8.159 .712 .769
HVSKTC4 7.72 9.107 .449 .891
Negative health behavior concept (HVSKTUC), Cronbach’s Alpha = 0.778
HVSKTUC1 4.71 4.094 .618 .703
HVSKTUC2 4.37 3.379 .591 .744
HVSKTUC3 4.59 3.850 .655 .661
Body mass index concept (CSKCT), cronbach alpha = 0.899
CSKCT1 4.89 4.195 .799 .858
CSKCT2 4.85 4.040 .850 .814
CSKCT3 5.01 4.209 .756 .895
Source: Calculation of authors
Through testing the reliability of the preliminary scale, it shows that there are 18 observable variables belonging to 5 concepts that meet the requirements (Cronbach's Alpha value, total correlation coefficient value), 5 research concepts belonging to The research model has a pretty good Cronbach's Alpha value, the lowest is 0.778 and the highest is 0.912 (> 0.6), so we can say that the scale content of the concepts is quite good, reliable to use. For the study, 18 observed variables will be included for EFA analysis in order to find inconsistent observation variables and once again verify the scale in more detail
Results of EFA Discovery Factor Analysis
The EFA analysis of the thesis was conducted after the observed variables were tested for the reliability of scales (Cronbach's Alpha), with 18 observed variables after passing the Cronbach's Alpha test, and were included simultaneously to EFA analysis, in order to retest the values of the scale, EFA analysis results are presented as follows:
EFA Analysis
Using Principal Asix Factoring and Promax to get a tighter data structure to be a prerequisite for further CFA analysis. EFA analysis showed that the coefficient value of
0.862 (> 0.5) KMO coefficients is quite good. Besides, Bartlett test value has a Sig value of 0.00 <0.05, so at 95% confidence, we conclude that the data are suitable for EFA analysis (observed variables are correlated with each other).
Using Principal Axis Factoring factor extraction and Promax matrix rotation data extracted 5 factors at the stop with Eigenvalue factor of 1,318 (> 1), a total extracted variance is 77,969% (> 50%) This means that 77,969% of the 5 extract factors are explained by 18 observed variables on the scale of 5 concepts, 5 extract factors corresponding to the concepts in the research model.
Table 2: Matrix of factors rotation
Measured variables Factor
1 2 3 4 5
LVQG1 .891
LVQG2 .770
LVQG3 .808
LVQG4 .908
SKCQ1 .713
SKCQ2 .881
SKCQ3 .885
SKCQ4 .687
HVSKTC1 .705
HVSKTC2 1.030
HVSKTC3 .810
HVSKTUC1 .753
HVSKTUC2 .656
HVSKTUC3 .823
CSKCT1 .836
CSKCT2 .932
CSKCT3 .829
Source: Calculation of authors
The observed variables all have factor load factors on which they measure the satisfactory (> 0.5), showing that the observed variables of the scale of the
Thus, after analyzing the discovery factor of EFA, the number of extracted factors is 5 factors, corresponding to 5 research concepts of the thesis, 18 observed variables are included in the EFA analysis, the results 1 observed variable with factor loading factor on the factor that it measured failed to conduct elimination, the remaining 17 observed variables met the EFA discovery factor analysis, observed variables will be included in further CFA analysis to retest the scale values.
Confirmatory Factor Analysis CFA Result
Confirmation Factor Analysis CFA
(Confirmatory Factor Analysis) is one of the statistical techniques to serve linear structure
model, CFA allows us to test how good the measured variables represent factors. CFA is the next step of EFA because CFA is only used appropriately when the researcher has some knowledge of the underlying structure, in which the relationship or hypothesis (derived from theory or experiment) between the measured variables and the baseline factors is assumed by the researcher before conducting statistical testing.
The CFA method is used to reaffirm the
unidimensional, reliability, convergent
validity and discriminant validity of the scale of factors affecting the health and behavior of bank tellers by working overtime.
Testing the Suitable of CFA Model
Table 3: Summary of CFA analysis
The evaluation index Value
CMIN/DF 1.889
GFI 0.932
TLI 0.964
CFI 0.971
RMSEA 0.053
Appropriate sig value 0.000
Source: Calculation of authors
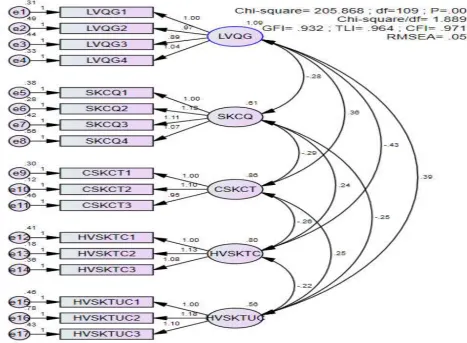
Through the results of assessing the suitability of the CFA analysis, we see the value of CMIN / DF = 1,889 (<3), TLI and CFI, GFI> 0.9, RMSEA index 0.053 <0.08 and value. sig test of the model 0.000 <0.05 so we can conclude that at 95% confidence this model is suitable for CFA analysis, the analysis data is compatible with the research model.
Assess the Reliability of the Scale
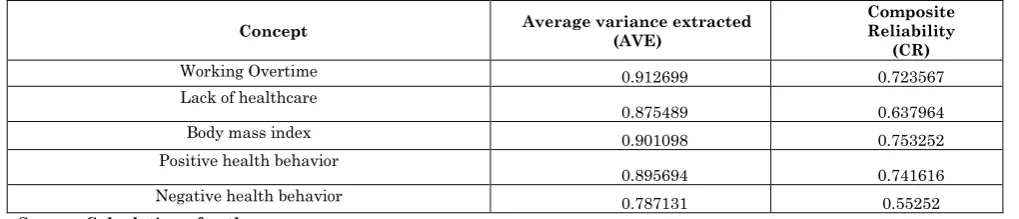
The reliability of a scale is one of the values of the scale that need to be tested harder, the reliability through CFA analysis is measured by the general reliability index (CR), total extracted variance ( AVE) and Cronbach's Alpha coefficient.Cronbach’s Alpha coefficient above, presented, the scales for the concept of satisfactory Cronbach’s Alpha coefficient. Table 4: Composite reliability, variance extracted
Concept Average variance extracted (AVE)
Composite Reliability
(CR)
Working Overtime 0.912699 0.723567
Lack of healthcare
0.875489 0.637964
Body mass index 0.901098 0.753252
Positive health behavior
0.895694 0.741616
Negative health behavior 0.787131 0.55252
Source: Calculation of authors
According to Hair et al [16].The scale is considered to be reliable when the Composite Reliability scores higher than 0.5 and the total average variance extracted is more than 0.5. Based on the evaluation of the total average variance extract and the Composite reliability of the concepts, we see that the
Convergent Validity
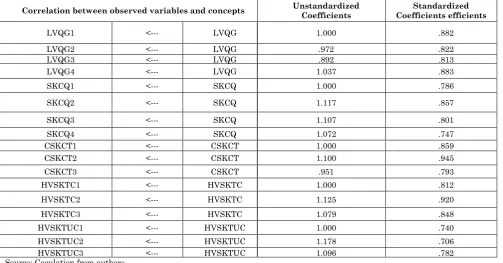
According to Hair et al [16].The scale is considered to reach the convergence value when the standardized weights of the scales in CFA analysis are greater than 0.5 and statistically significant. In addition, there is another criterion to test the convergence value is the total average variance extract (AVE) of the concepts must be at a minimum
of more than 0.5. According to the analysis, it is shown that all standardized coefficients of the observed variables on the measurement concept have met the requirements (over 0.5). Besides, the total variance extracted from the concepts is also greater than 0.5, from which we can conclude that the factors reach the convergent value (the results are presented
in the table of standardized and
unstandardized Coefficients).
Table 5: Standardized and unstandardized Coefficients of observed variables
Correlation between observed variables and concepts Unstandardized Coefficients Coefficients efficients Standardized
LVQG1 <--- LVQG 1.000 .882
LVQG2 <--- LVQG .972 .822
LVQG3 <--- LVQG .892 .813
LVQG4 <--- LVQG 1.037 .883
SKCQ1 <--- SKCQ 1.000 .786
SKCQ2 <--- SKCQ 1.117 .857
SKCQ3 <--- SKCQ 1.107 .801
SKCQ4 <--- SKCQ 1.072 .747
CSKCT1 <--- CSKCT 1.000 .859
CSKCT2 <--- CSKCT 1.100 .945
CSKCT3 <--- CSKCT .951 .793
HVSKTC1 <--- HVSKTC 1.000 .812
HVSKTC2 <--- HVSKTC 1.125 .920
HVSKTC3 <--- HVSKTC 1.079 .848
HVSKTUC1 <--- HVSKTUC 1.000 .740
HVSKTUC2 <--- HVSKTUC 1.178 .706
HVSKTUC3 <--- HVSKTUC 1.096 .782
Source: Caculation from authors
Homogeneity and Unidimensionality
Determining the homogeneity and
unidimensionality of the scale, based on the values to evaluate the appropriateness of the model, we can conclude that the scale
achieves the homogeneity and
unidimensionality with the assessment values of a suitable model, CMIN / DF = 1,889 (<3), TLI and CFI evaluation index, GFI> 0.9, RMSEA index 0.053 <0.08 and sig test value of model 0.000 <0.05 so we can conclude that at the reliability of 95%, this model is suitable for CFA analysis. We can conclude that the scale achieves homogeneity and unidimensionality.
Discriminant Validity
To test this, discriminant validity is known through the following evaluation criteria:
Evaluate if the correlation coefficient between factors is far from 1, through correlation coefficient value and P-value test.
Compare the square root of Total Variance Explained with the correlation coefficients of one factor and the others.
Table 6: Total Variance Explained and its square root
Concept Averave Variance Extract (AVE) Square root of AVE
Working overtime 0.912699 0.955353
Lack of healthcare 0.875489 0.935676
Body mass index 0.901098 0.949262
Positive health behavior 0.895694 0.946411
Negative health behavior 0.787131 0.887204
Table 7: Discriminant validity test
Correlation between concepst Estimate S.E C.R P
LVQG <--> SKCQ -.285 .055 -5.151 ***
LVQG <--> CSKCT .359 .064 5.586 ***
LVQG <--> HVSKTC -.430 .067 -6.422 ***
LVQG <--> HVSKTUC .385 .060 6.464 ***
SKCQ <--> CSKCT -.286 .050 -5.677 ***
SKCQ <--> HVSKTC .245 .049 5.022 ***
SKCQ <--> HVSKTUC -.255 .046 -5.519 ***
CSKCT <--> HVSKTC -.265 .055 -4.854 ***
CSKCT <--> HVSKTUC .254 .050 5.085 ***
HVSKTC <--> HVSKTUC -.221 .048 -4.563 ***
Source: Caculation from authors
Based on the research results, we find that the square root of the total variance extracted and the correlation coefficients satisfy the condition, so we can say that with existing data, the scale achieves the discriminant validity.
This shows that the research scale is very reliable and well used. Thus, through confirmatory factor analysis, we get the CFA model shown in the figure, with criteria to evaluate the model's suitability to be met, or the values of the scale are also meet and satisfy the request.
Figure 2: CFA model result
Source: Caculation from authors
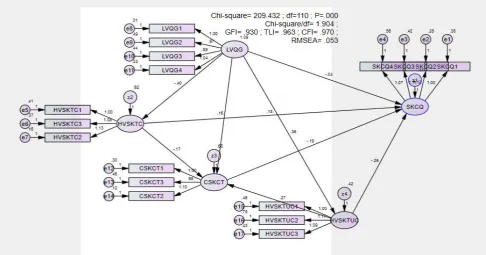
Structural Equation Modeling (SEM) After conducting the CFA confirmatory factor analysis, we conducted an analysis of the structural equation modeling SEM, in order to test the research hypotheses and measure the impact of the factors on each other.
Table 8: Structural equation modeling SEM result
Estimate S.E. C.R. P Label
HVSKTC <--- LVQG -.398 .053 -7.464 ***
HVSKTUC <--- LVQG .359 .048 7.560 ***
CSKCT <--- LVQG .165 .066 2.496 .013
CSKCT <--- HVSKTC -.173 .067 -2.571 .010
CSKCT <--- HVSKTUC .274 .090 3.028 .002
SKCQ <--- LVQG -.039 .055 -.700 .484
SKCQ <--- HVSKTC .151 .058 2.614 .009
SKCQ <--- CSKCT -.187 .054 -3.492 ***
SKCQ <--- HVSKTUC -.287 .080 -3.603 ***
Source: Caculation from authors
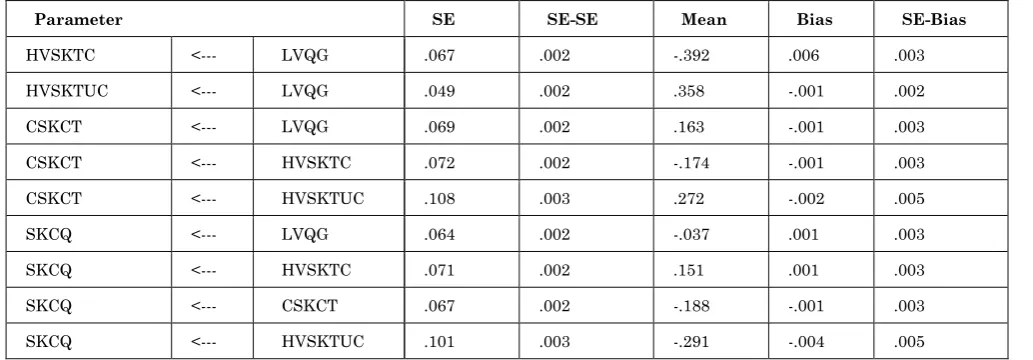
Table 9: Boostrap analysis
Parameter SE SE-SE Mean Bias SE-Bias
HVSKTC <--- LVQG .067 .002 -.392 .006 .003
HVSKTUC <--- LVQG .049 .002 .358 -.001 .002
CSKCT <--- LVQG .069 .002 .163 -.001 .003
CSKCT <--- HVSKTC .072 .002 -.174 -.001 .003
CSKCT <--- HVSKTUC .108 .003 .272 -.002 .005
SKCQ <--- LVQG .064 .002 -.037 .001 .003
SKCQ <--- HVSKTC .071 .002 .151 .001 .003
SKCQ <--- CSKCT .067 .002 -.188 -.001 .003
SKCQ <--- HVSKTUC .101 .003 -.291 -.004 .005
Source: Caculation from authors
Boostrap analysis results, with 350 research samples conducted by Boostrap help reassess the estimation model, with the analysis results showing that the average of the estimated coefficients is not different from the conventional estimation method. Besides, the estimated errors between the two methods are not significant, so we can conclude that the estimated coefficients of the model are reliable and the interpretation of results is safe.
Through the verification table of research hypotheses, we see that the impact of working overtime on positive lifestyle behaviors is - 0.398, with test significance of sig = 0.000 (<0.05), hence at reliability
level of 95%, we can conclude that Working
overtime has a negative effect on positive lifestyle behaviors, increasing overtime will reduce positive lifestyle behaviors and vice versa.
The impact of Working overtime on
negative behavioral behaviors is 0.359, with sig value of 0.000 much less than 0.05, so at 95% reliability level we conclude that Working overtime has a positive effect to negative lifestyle behaviors. This means, in the same conditions, increasing overtime by
1 unit will decrease the negative lifestyle by to 0.359 units and vice versa.
The impact of Working overtime on body mass index is 0.165, with sig value of 0.003 (<0.05) so at a 95% reliability level we
conclude that Working overtime has to
affect accordingly to the body mass index. In the same conditions, the more overtime it is the more volatile the body mass index is.
The impact of Working overtime on Lack of
healthcare is -0.039 with a test value of 0.484> 0.05, hence at 95% reliability level, we conclude that Working overtime has no negative effect on lack of healthcare.
The impact coefficient of positive lifestyle behaviors on Lack of healthcare is 0.151 and the test value is 0.009 (<0.05), hence at a 95% reliability level, we conclude that Positive lifestyle behaviors have a positive impact on lack of healthcare.
The impact coefficient of body mass index on subjective health is -0.187 and the test value is 0.000 <0.05, hence at 95% reliability level, we can conclude that the Body Mass Index have a negative effect on Lack of healthcare
The impact coefficient of Negative lifestyle behaviors impact on body mass index is 0.274 and a test value of 0.002 <0.05, hence at 95% reliability level, we can conclude that Negative lifestyle behaviors have a positive effect on body mass index
The impact coefficient of negative lifestyle behaviors on subjective health is -0.287 with a test value of 0.000 (<0.05), hence at 95% reliability level, we can conclude that Negative lifestyle behaviors have negative effect on Lack of healthcare.
The impact coefficient of positive lifestyle behaviors on body mass index is -0.173 and a test value of 0.010 (<0.05), hence at 95% reliability level, we can conclude that positive lifestyle has a negative effect on body mass index
Thus, the test results of research hypotheses show us 8 research hypotheses of the model are accepted at the 95% reliability level, which will be the basis for the implications and policies to prove that proving that working overtime affects the health and behavior of bank tellers.
Through Structural equation modeling SEM, the main criteria to evaluate the suitability of
the model are shown as follows:
Figure 2: Structural equation modeling result Source: Caculation from authors
Conclusions and Policy Implications
Conclusion
With the aim of determining the impact of working overtime on the health and lifestyle behavior of tellers of commercial banks in Daklak province, the research has conducted basic steps such as building theoretical models and research hypotheses. The process goes through many steps from identifying issues and objectives to building a model, a scale, designing a questionnaire, collecting, processing and analyzing data, evaluating
Table 10: Results of research hypotheses
Hypotheses Result
H1: Working overtime has a negative effect on positive lifestyle behaviors Accepted H2: Working overtime has a positive effect on negative lifestyle behaviors Accepted H3: Working overtime has a positive effect on body mass index Accepted H4: Working overtime has a negative effect on Lack of healthcare Refuse H5: Positive lifestyle behaviors have the same effect on subjective health assessments Accepted
H6: Positive lifestyle behaviors have the negative effect on body mass index Accepted H7: Body mass index has a negative effect on lack of health Accepted H8: Negative lifestyle behaviors have a positive effect on body mass index Accepted H9: Negative lifestyle behaviors have a negative effect on lack of healthcare Accepted Source: Statistics from authors
Policy Implications
Bank managers in DakLak province need to pay attention to tellers' health and arrange for them to be compensatory leave off and take turns to allow proper to recreation and recuperation. At the same time, reward officials and employees, especially the transactors whose achievements deserve recognition, there should be a way to evaluate the performance closely and objectively to promptly recognize and reward for the effort that the tellers have made. Besides paying salaries, it is necessary to ensure a stable source of income.
Meantime, the value of a valuable reward must be materially helpful for the tellers so that they are motivated to work, hence having a way to evaluate the results of performance fairly and objectively so that tellers feel rewards are always appropriate and fair. Based on the results, positive lifestyle behaviors have a good impact on the lack of healthcare with an impact coefficient of 0.151 and vice versa, therefore, the management of Banks in the area need to pay more attention to the life of the tellers at a higher level to encourage them to lead a positive lifestyle a better state of health, often tellers to take exercises, hold physical competitions that advocate for good health and a healthier lifestyle.
Results show that working overtime has a negative effect on positive lifestyle behaviors (-0.398), working overtime has a positive effect on negative lifestyle behaviors (0.359) and working overtime has a positive effect on body mass index (0.165), which show that working overtime actually has a great impact on various factors to be considered, means the more you work overtime the more active lifestyle behaviors will diminish. In other words, overtime will be negatively correlated with positive lifestyles, which leads to the possibility of health deterioration, the management needs to bear in mind this situation of tellers.
It is necessary to arrange working hours in a balanced and reasonable way, take regular consideration of the lifestyle of tellers, as a result, having a reward scheme or raise income to stimulate enthusiasm and ensure the material wealth without overtime pressure to work for material compensation. Banks can implement welfare policies that make tellers feel that material rewards are worthwhile and safe for their lives so that they reduce the overtime pressure.
Moving on, results show that positive lifestyle behaviors have a positive effect on subjective health assessment (0.151), positive lifestyle behaviors have the negative effect on body mass index (-0.173), body mass index has a negative effect on subjective health (-0.187), negative lifestyle behaviors have the same positive effect on body mass index (0.274), negative lifestyle behaviors have a negative effect on lack of healthcare (-0.287).
Therefore, the results also show that the more positive the lifestyle, the better the health of the tellers and the better the body mass index, so the management needs to take active lifestyle of the tellers towards better health during the working process, plan to arrange take-turn leave off enabling them to rest, recover and refresh so that they are healthy enough to stay longer with the organization.
Need to organize and promote the health care activities for tellers, help them to have a positive daily life through health care
policies, need to create promotion
fairness, objectivity and these individuals must understand the incentives that the organization gives so that they can be assured of the path of promotion and development to be motivated to work and to train themselves better, creating promotion opportunities must be associated with personal achievements, those who strive and achieve good results are absolutely must be guaranteed to implement the policy of self-development in order to help tellers lead a more active and productive life at work. Policies can be implemented such as propagating the overall goals of the divisions to relevant officials and employees. Hence, they can better understand their objectives in a real context.
The job will now have a better understanding of its job goal. In addition, Banks need to arrange a suitable workload so that tellers can make good use of their skills and expertise to help them see that expertise is necessary and practical for the job. At the same time, consider the job characteristics when assigning work to officials and employees which should be in accordance with their capacity to ensure there is a between the goals and job characteristics. Maintaining the job goals that the unit has done well means continue to let tellers decide on work-related issues so they can be more autonomous at work. This leads to more effective working policies [17-33].
References
1. Merllié D (2000) Ten years of working
conditions in the European
Union. Luxembourg, Office for Official
Publications of the European
Communities/European Foundation for the Improvement of Living and Working Conditions, 7.
2. Thierry H, Meijman T (1994) Time and
behavior at work.
3. Harrington JM (1994) Working long hours
and health.
4. Spurgeon A, Harrington JM, Cooper CL
(1997) Health and safety problems associated with long working hours: a
review of the current
position. Occupational and environmental medicine, 54(6): 367-375.
5. Sparks K, Cooper C, Fried Y, Shirom A
(1997) The effects of hours of work on
health: a meta‐analytic review. Journal of
occupational and organizational
psychology, 70(4): 391-408.
6. Borg V, Kristensen TS (1999) Psychosocial
work environment and mental health among travelling salespeople. Work & Stress, 13(2): 132-143.
7. Rosa RR (1995). Extended workshifts and
excessive fatigue. Journal of Sleep
Research, 4: 51-56.
8. Barnett RC, Gareis KC, Brennan RT
(1999) Fit as a mediator of the relationship between work hours and burnout. Journal of occupational health psychology, 4(4): 307.
9. Staines GL, Pleck JH (1984) Nonstandard
work schedules and family life. Journal of Applied Psychology, 69(3): 515.
10.Grzywacz JG, Marks NF (2000)
Reconceptualizing the work–family
interface: An ecological perspective on the correlates of positive and negative
spillover between work and
family. Journal of occupational health psychology, 5(1): 111.
11.Meijman TF, Mulder G, Drenth PJ,
Thierry H, De Wolff CJ (1998) Handbook
of work and organizational
psychology. Work psychology, 2.
12.Repetti RL (1989) Effects of daily workload
on subsequent behavior during marital interaction: The roles of social withdrawal and spouse support. Journal of personality and social psychology, 57(4): 651.
13.Repetti RL (1993) Short-term effects of
occupational stressors on daily mood and
health complaints. Health
Psychology, 12(2): 125.
14.Chan CJ, Margolin G (1994) The
relationship between dual-earner couples' daily work mood and home affect. Journal
of Social and Personal
Relationships, 11(4): 573-586.
15.Taris TW, Ybema JF, Beckers DG,
Verheijden MW, Geurts SA, Kompier MA (2011) Investigating the associations among overtime work, health behaviors, and health: a longitudinal study among full-time employees. International journal of behavioral medicine, 18(4): 352-360.
16.Hair JF, Anderson RE, Tatham RL, Black
17.Culyer AJ (1976) Need and the National Health Service: economics and social choice. Rowman & Littlefield Publishers.
18.Culyer AJ, Wagstaff A (1993) Equity and
equality in health and health care. Journal of health economics, 12(4): 431-457.
19. Hatcher L (1994) A step-by-step approach
to using the SAS(R) system for factor analysis and structural equation modeling. Cary, NC: SAS Institute.
20. Hoang Trong, Chu Nguyen Mong Ngoc
(2008) Research data analysis with SPSS 1-2, Hong Duc Publisher.
21.Kleppa E, Sanne B, Tell GS (2008)
Working overtime is associated with anxiety and depression: the Hordaland Health Study. Journal of occupational and environmental medicine, 50(6): 658-666.
22.Lalonde M (1974) A New Perspective on
the Health of Canadians: A Working Document= Nouvelle Perspective De La Sante Des Canadiens.
23.Liu Y, Tanaka H (2002) Overtime work,
insufficient sleep, and risk of non-fatal acute myocardial infarction in Japanese men. Occupational and Environmental Medicine, 59(7): 447-451.
24.Lynch JW, Kaplan GA, Cohen RD,
Tuomilehto J, Salonen JT (1996) Do cardiovascular risk factors explain the relation between socioeconomic status, risk of all-cause mortality, cardiovascular
mortality, and acute myocardial
infarction?. American journal of
epidemiology, 144(10): 934-942.
25.Maslow AH (1943) A theory of human
motivation. Psychological review, 50(4):
370.
26.Nakamura K, Shimai S, Kikuchi S,
Takahashi H, Tanaka M, Nakano S, Yamamoto M (1998) Increases in body mass index and waist circumference as
outcomes of working
overtime. Occupational Medicine, 48(3):
169-173.
27.Nguyen Dinh Tho (2011) “Methods of
scientific research in business”. Social Labor Publisher, HCMC.
28.Nutbeam D, Harris E, Wise W
(2010) Theory in a nutshell: a practical guide to health promotion theories. McGraw-Hill.
29.Park J, Kim Y, Cho Y, Woo KH, Chung
HK, Iwasaki K, Hisanaga N (2001) Regular overtime and cardiovascular functions. Industrial health, 39(3):244-249.
30.Steptoe A, Wardle J, Lipsey Z, Mills R,
Oliver G, Jarvis M, Kirschbaum C (1998) A longitudinal study of work load and variations in psychological well-being,
cortisol, smoking, and alcohol
consumption. Annals of Behavioral
Medicine, 20(2): 84-91.
31.Thomas HR (1992) Effects of scheduled
overtime on labor productivity. Journal of
Construction Engineering and
Management, 118(1), 60-76.Virtanen
Marianna. Overtime work and incident coronary heart disease: the Whitehall II prospective cohort study. European Heart Journal, 31(14):1737-1744 · May 2010.
32.Van Der Hulst M, Geurts S (2001)
Associations between overtime and
psychological health in high and low reward jobs. Work and Stress, 15(3): 227-240.
33.Virtanen M, Ferrie JE, Singh-Manoux A,
Shipley MJ, Vahtera J, Marmot MG, Kivimäki M (2010) Overtime work and incident coronary heart disease: the
Whitehall II prospective cohort