MnO2 AND MnO2/TiO2 MEDIATED, PERSULPHATE
ENHANCED PHOTOCATALYSIS FOR THE REMOVAL OF
INDIGO CARMINE FROM WATER
K. P. Vidya Lekshmi,
[a]Suguna Yesodharan
[a]and E. P. Yesodharan
[a]*
Keywords: anion effect; Indigo carmine dye; manganese dioxide; photocatalysis; titanium dioxide; persulphate.
Heterogeneous photocatalysis using UV/VIS light or natural solar radiation as the energy source is one of the most efficient advanced oxidation processes (AOP) for the removal of chemical and bacterial pollutants from water. One of the least investigated oxides in this
context, i.e. MnO2 and its combination MnO2/TiO2 are examined as potential photocatalysts for the removal of Indigo carmine (IC) dye
pollutant from the water. The catalysts are characterized by XRD, FTIR, SEM, TEM, adsorption and surface area measurements. While
MnO2 is very efficient for the decolorization of the dye, it is not effective enough for mineralization. MnO2 /TiO2 as the photocatalyst at the
optimized ratio of 9:1 combines the advantages of both the oxides, i.e., rapid decolorization and efficient mineralization. Persulphate
(S2O82-) enhances the degradation while H2O2 inhibits the same. The degradation is dependent on pH with higher degradation under
extremely acidic conditions. The influence of dissolved salts/anions in the water on the degradation varies from ‘moderate inhibition' to ‘no effect' or even ‘enhancement' depending on the chemistry of the anion and reaction conditions. Effect of various parameters such as
reaction time, substrate concentration, catalyst dosage, the presence of O2, recycling of the catalyst, etc. on the efficiency of degradation is
investigated. The results are critically analyzed, and a tentative mechanism is proposed.
*Corresponding author
Tel: +91 9847193695, +91 484 2604889 e-mail: [email protected]
[a] School of Environmental Studies, Cochin University of
Science and Technology, Kochi 682022, India.
Introduction
Heterogeneous photocatalysis mediated by semiconductor (SC) oxides is an efficient advanced oxidation process (AOP) for the decontamination of water from chemical and bacterial pollutants.1-5 When the SC oxide is irradiated with a light energy source (UV or visible) such that hν > Eg (band gap of the SC), electron-hole pairs are created. The electrons get excited from the valence band to the conduction band leaving positively charged holes in the valence band. These holes and electrons can participate in oxidative and reductive reactions respectively. In aqueous suspensions, highly reactive OH radicals are generated, and they can promote the oxidation and eventual mineralization of the pollutant to CO2, water, and inorganic salts.
The most widely investigated SC oxides in this respect are ZnO and TiO2 in view of their favorable physicochemical properties, low cost, easy availability, high stability and low toxicity. The band gaps of ZnO (~3.2 eV) and TiO2 (anatase
Ebg = ~ 3.2 eV, rutile Ebg = ~3.0 eV) are fairly similar. Hence they can absorb light only below 400 nm, which is in the UV range that constitutes only <5 % of the sunlight. ZnO is relatively more active in the visible region and is hence preferred in the investigations aimed at the harnessing of solar energy.6-9 However, it has the disadvantage of corrosion under extreme acidic and alkaline conditions as well as photocorrosion making the scope of its commercial application limited.
A number of studies have been reported on the modification of semiconductor oxides in order to extend the absorption of light to the visible range. These include dye sensitization, semiconductor coupling, impurity doping, use of coordination metal complexes and metal deposition.4,10-14 Composites such as TiO2/carbon have also been reported.15 Physical modification of TiO2 with small amounts of transition metal cations such as vanadium and chromium extends the absorption up to 550 nm and makes it active under UV as well as sunlight.16 Deposition of noble metals such as Pt, Pd, Au, Ag etc. on TiO2 enhances the catalytic oxidation of organic pollutants due to the increased light absorption and retardation of the recombination of photogenerated electrons and holes.17-19
MnO2 is one of the least investigated SC oxides in photocatalysis in spite of its excellent semiconductivity, porosity, and mixed-valent properties. The combination of MnO2 with TiO2 may offer advantages of the high adsorption and reactivity of the former and photochemical property of the latter. Considering these, the application of MnO2 and MnO2/TiO2 as photocatalysts for the removal of recalcitrant toxic materials is examined here. One of the widely used special application dyes Indigo Carmine (IC) is selected as the test candidate.
The chemical structure of IC is given in Figure 1.
Figure 1. Chemical structure of Indigo carmine
Only a few investigations aimed at the removal IC from water have been reported.22-26 To the best of our knowledge, the current study is the first instance of the application of MnO2 mediated photocatalysis for the degradation/mineralization of IC from the water. The efficacy of the technique is evaluated under various reaction conditions, and the optimum parameters are identified.
Experimental
Materials
MnO2 used in the study was supplied by Merck India Limited. The particles were approximately spherical and nonporous with > 99 % purity. The BET surface area was ~31m2/g. The pore volume was ~ 0.05 cm3 g-1, and the average pore width was 74.2 Å. Degussa P-25 TiO2 (> 99 % pure, average particle size ~ 15-20 µm, BET surface area ~15 m2 g-1) consisting of ~80 % anatase and ~20 % rutile was used as such without further purification.
Persulphate (PS) (purity ~99 %) and H2O2 (30.0 % w/v), both from Qualigen (India) and Indigo Carmine (Extra Pure Grade > 99.5 % purity) from Sisco Research Laboratories Pvt. Ltd (India) were used as such without further purification. Doubly distilled water was used in all the experiments. All other chemicals were of AnalaR Grade or equivalent.
Characterization of the catalyst
X-ray diffraction measurements were made by using Rigaku X-ray diffractometer with CuK radiation. Scanning Electron Microscopy (SEM) measurements were performed with JEOL Model JSM-6390LV. Diffuse Reflectance Spectra (DRS) were recorded with Varian Cary 5000 using BaSO4 as the reference. Transmission electron microscopy (TEM) was done using JOEL/JEM/200; source LaB6. FTIR spectra were recorded using Nicolet Avatar 370 instrument equipped with triglycine sulfate detector with a KBr window and a KBr beam splitter. The equipment was purged with dry air to prevent interference from atmospheric moisture. The transmission spectrum was obtained with a resolution of 4 cm-1 by using 32 scans in the range 400 – 4000 cm-1. The powdered samples were diluted with finely ground KBr to about 5 % by weight.
Photocatalytic experiments
Photocatalytic experiments in the presence of UV were performed in a jacketed Pyrex reactor. The dye solution together with weighed amount of the catalyst and other additives as required was taken in the inner compartment and cooling water from a thermostat (27±1 0C) was circulated through the outer jacket. UV irradiation was done using a 400 W medium pressure mercury vapor lamp. The suspension was frequently stirred to ensure uniform mixing. Samples were drawn periodically, centrifuged and analyzed for the dye concentration by Spectrophotometry (608 nm). Suspension kept under identical conditions in the dark was used as the reference in each case to eliminate the contribution from adsorption towards the reduction in the dye concentration. H2O2 was determined by standard iodometry. Chemical oxygen demand (COD) measurements were made by the open reflux method.27 Adsorption studies were made by the standard technique.28
Detection of hydroxyl radicals
The formation of .OH radicals during the UV irradiation of the reaction system was tested by the photoluminescence (PL) technique using terephthalic acid (TPA) as the probe molecule.29,30
The hydroxyl radicals formed in situ in the system reacts with TPA to form the 2-hydroxyterephthalic acid (HTPA), which is a fluorescent molecule. The intensity of its PL is proportional to the concentration of in situ formed .OH radicals in the system. MnO2 at the standard experimental concentrations is suspended in an aqueous solution of TPA (2 x 10⁻⁴ M) and NaOH (2x10⁻³ M) and irradiated by UV light. The PL spectrum of the product HTPA is recorded in the range of 400 - 450 nm after every 5 minutes of irradiation. The excitation wavelength was 315 nm. The PL intensity at 425 nm corresponds to the concentration of HTPA and hence of the .OH radicals formed in the system. Shimadzu model RF-5301PC fluorescence spectrophotometer is used for recording the spectrum.
Results and Discussions
Characterization of MnO2
The catalysts MnO2 and TiO2 were characterized by XRD, SEM, TEM, Fourier transform infrared (FTIR) spectroscopy and DRS. Typical results with respect to MnO2 are given in Figures 2 A, B, C, D and E. The characteristics of TiO2 are same as those reported earlier.31
Figure 2A. XRD image of MnO2.
Figure 2B. SEM image of MnO2.
The morphology and particle size are further confirmed by TEM analysis (Figure 2C) which shows platelet and rod-like structure. The FTIR pattern (Figure 2D) shows very week absorption intensity of OH (3100-3600 cm-1) or H2O (1600 and 3600 cm-1). The general spectral pattern shows that MnO2 is pure with no contamination from any of the precursors.
Figure 2C. TEM image of MnO2.
Figure 2D. FTIR spectrum of MnO2.
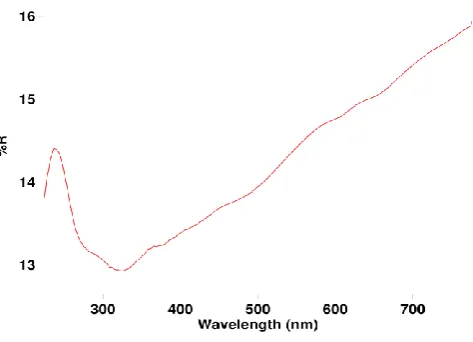
Diffuse reflectance spectrum (Figure 2E) shows a sharp reflectance band between 200 and 300nm indicating that the material absorbs in the UV range. The optical absorption intensity of MnO2 steadily increases from 300 to 800 nm with no clear band edge. This indicates that MnO2 is not a typical semiconductor like TiO2 or ZnO. The brown color of MnO2 also indicates favorable absorption of visible light.32
Figure 2E. DRS of MnO2.
Photocatalytic degradation of IC on MnO2
Figure 3. Photocatalytic degradation of IC in the presence of MnO2.
Effect of catalyst dosage
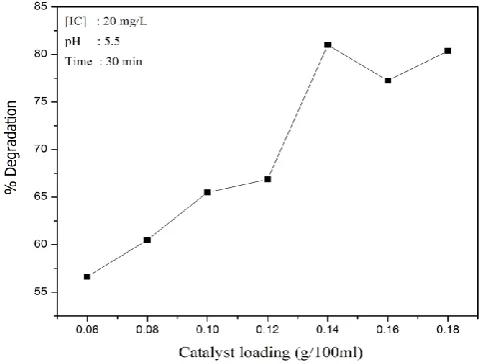
The effect of MnO2 loading on the photocatalytic degradation of IC is tested by varying the dosage of MnO2, keeping other parameters constant. The results are plotted in Figure 4 which shows that the degradation of the dye increases with increase in catalyst dosage and stabilizes at 0.14 g in 100 mL under the reaction conditions.
Figure 4. Effect of MnO2 dosage on the photocatalytic degradation of IC.
The enhanced degradation at higher catalyst loadings can be attributed to the increased number of adsorption and interaction sites for the IC and/or the intermediates and more effective harvesting of light. This leads to increased formation of reactive hydroxyl and other radicals which are known to be responsible for the photocatalytic degradation of organic pollutants. Any increase in catalyst concentration beyond the optimum will only result in scattering and reduced passage of light through the suspension medium. Another reason may be the aggregation of catalyst particles causing a decrease in the number of available active surface sites. Beyond a particular loading, the catalyst particles cannot be fully and effectively suspended in a particular reactor which also leads to suboptimal penetration of light
and reduced adsorption of the substrate on the surface. It is also possible that at higher loading, part of the originally activated MnO2 is deactivated through collision with ground state catalyst according to the following equation.33:
MO* + MO MO# + MO (1)
where MO represents MnO2, MO* and MO# are its activated and deactivated forms, respectively).
In the case of MnO2 which is a good adsorber/absorber and reservoir for O2, higher dosage provides more photogenerated reactive oxygen species (ROS) such as .OH radicals. The formation of .OH radicals in MnO2/IC/UV is confirmed by PL spectral studies. The increase in fluorescence with irradiation time (Figure 5) corresponds to the progressive formation of .OH radicals (See experimental section).
Figure 5. PL spectral changes during UV irradiation of
MnO2/terephthalic acid/NaOH.
MnO2 is 0.14 g in 100 mL. Hence all further studies were carried out with this loading.
Effect of concentration of IC
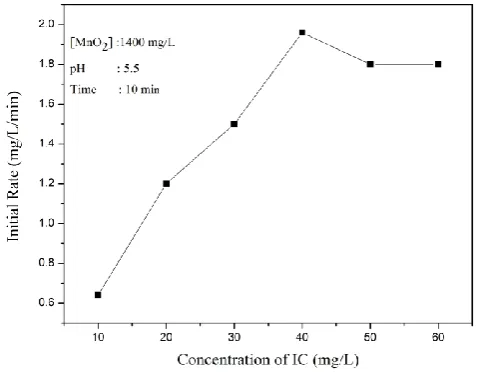
The effect of initial concentration of IC in the range of 10-60 mg/L in the water on its photocatalytic degradation is investigated. The percentage degradation decreases as the concentration of IC increases. In contrast, the rate of removal increases steadily and steeply with an increase in the initial concentration of IC up to 40 mg L-1 and stabilizes after that (Figure 6). The optimum kinetic rate of 1.9 mg L-1 min-1 is reached at 40 mg L-1 of IC. This is followed by a slight decrease and eventual stabilization of the rate implying gradually decreasing and eventual zero order kinetics at higher concentration of >40 mg L-1.
Figure 6. Effect of concentration of IC on the rate of photocatalytic degradation.
The photocatalytic degradation of many organic pollutants in water is reported to follow pseudo first order kinetics.35-37 The increase in degradation with an increase in concentration up to 40 mg L-1may is due to increase in adsorption of IC on MnO2 which will continue until the surface is fully covered and all the active sites are occupied. Further, at higher concentration, there will be more IC molecules available in bulk as well as in the proximity of the surface which can also interact with the surface-generated active free radicals and ROS such as .OH and H2O2. At higher concentration beyond the optimum, at least a part of the irradiating UV light may be blocked and/or absorbed by IC and the intermediates formed from it thereby reducing the photons available for catalyst activation. Another reason may be retardation in the penetration of light at a longer distance from the light source and consequent decrease in its path length. This results in decreased availability of photons per IC molecule in the system and hence decreased degradation.38 As the initial concentration of IC increases, the requirement of catalyst surface needed for maintaining the corresponding rate of degradation also increases. Since illumination intensity and catalyst concentration are maintained constant, the relative number of ROS available per IC molecule is also presumably decreasing with increase in the concentration of IC.
This also leads to stabilized/ decreased rate of degradation. Once the concentration of the substrate is enough to interact with all the optimum available ROS and/or other reactive free radicals, any further increase cannot result in increased reaction, and the IC removal becomes independent of concentration. It is also possible that at higher substrate concentration, some of the reaction intermediates may get adsorbed onto the surface or remain in bulk for the relatively longer period leading to the less frequent interaction between fresh IC molecules and the ROS. At any point in time during the irradiation, there will be an optimum for the number of substrate molecules that can interact with the reactive free radicals generated in the system. This optimum will depend on some reaction parameters such as initial concentration of the substrate, pH, intensity of illumination, the wavelength of light, mass and type of photocatalyst, type and geometry of photoreactor, the presence of other contaminants, etc. Consequently, the optimization will apply only to the specific reaction conditions and cannot be generalized.
Since both catalyst and light are essential for the degradation, the negative effect of increasing concentration of IC on the rate of degradation implies that at higher concentration, the dye is inhibiting the action of the catalyst and/or light. At higher concentration, there will be better adsorption of the dye on the surface of the catalyst. This will prevent direct absorption of light by the catalyst thereby inhibiting the generation of reactive free radicals and ROS. In the absence of steady and significant degradation, the adsorbed dye will not leave the surface sites. This will prevent the adsorption of fresh dye molecules and continued degradation.
The simplest way to represent the rate of photocatalytic degradation is the Langmuir-Hinshelwood model, modified to accommodate reactions taking place at the solid-liquid interface. Accordingly, the rate of degradation is:
(2)
where
r0 is the rate of disappearance of IC (mg L-1 min-1),
C0 (mg L-1) is the initial concentration of the dye,
C is the concentration at time t,
K is the equilibrium adsorption coefficient (mgL-1) and
k is the reaction rate constant (min-1) at maximum surface coverage.
Equation 2 can be integrated and presented as
(3)
when C0 is very small, (C0-C) is negligible and equation (3) becomes
0 0
0
1
kKC
dC
r
dt
KC
0
0
1
1
ln
C
t
C
C
kK
C
k
(4)
In the present study, the logarithmic plot of ln(C0/C) vs. time t did not give straight lines that pass through the origin. This shows that the degradation of IC in the presence of MnO2 does not follow the expected pseudo first order kinetics as in the case of most photocatalytic processes. The Langmuir-Hinshelwood model and the pseudo-first order kinetics underline the key role of adsorption on the rate of reaction assuming that the adsorption-desorption kinetics is faster than the photochemical reaction.39,40 The rate of unimolecular surface reaction is proportional to the surface coverage, assuming that the reactant is more strongly adsorbed than the products on the catalyst particles.41
Adsorption studies of IC on MnO2 under the reaction conditions showed that~32 % of the dye is adsorbed at the equilibrated stage. When K is large, the first term of equation (3) is negligible. i.e.
(5)
The concentration of the dye decreases with time until the optimum surface coverage is attained.
The pseudo first order kinetics, as in the case of typical semiconductor oxide photocatalysts such as ZnO (adsorption: ~11 % ) and TiO2 (adsorption: ~8 %), is not followed in the case of MnO2 with high adsorption (~32 %). Hence it may be inferred that the degree of adsorption of the substrate on the catalyst does influence the degradation kinetics. This further indicates that the general assumptions implicit in the application of LH mechanism and related kinetic analysis are not fully applicable in the case of MnO2 mediated photocatalysis. These assumptions are:42
i) The reaction of adsorbed species is the rate-determining step
ii) Fractional surface coverage (θA) of the reactant species is the more appropriate concentration parameter to be applied in rate laws,
iii)θA → 1 for saturation coverage corresponding to a monolayer of adsorbate on the surface and
iv)Langmuir adsorption isotherm type equation represents the relationship between θA and the activity. In the case of highly adsorbing particles such as MnO2, there will be competition between the solvent (water) and the solute (IC) molecules for adsorption sites which can complicate the kinetics of adsorption as well as degradation.
Effect of pH
The pH of the reaction medium is known to influence the surface characteristics and adsorptive properties and consequently the photocatalytic behavior of semiconductor oxides. The effect of pH on the photodegradation of IC in
the presence of MnO2 is investigated, and the results are given in Figure 7. Maximum degradation (~97 % in 10 min) is observed at pH 2. However, under this condition, the decolorization is very facile even without UV irradiation.
Figure 7. Effect of pH on the photocatalytic degradation of IC over
MnO2
The pH has only negligible effect on the decolorization of the dye as such (in the absence of UV and MnO2). However, under UV, even the dye alone undergoes reasonable decolorization at various pH, the maximum being at pH 2. The degradation decreases steadily with the increase in pH up to pH 10 and increases slightly after that. The fast decolorization in the presence of MnO2 under acidic pH, even in the absence of UV irradiation, shows that simple adsorption of IC on MnO2 also is facilitated at acidic pH.
Similar pH effect on the adsorption of IC on TiO2 catalyst has been reported by Barka et al...43 pH is known to influence the surface state of the catalyst and ionization state of the dye. The point of zero charges (PZC) of MnO2 is ~ 4.7.26,44,45 Below this pH the surface is positively charged, and hence its oxidizing ability will be relatively higher. IC is a dianionic dye in aqueous solution, and this configuration is maintained in the pH range 3-11.24,45 Below the PZC of MnO2, the electrostatic interaction between the positive catalyst surface and the dianions can lead to strong interaction between them and subsequent degradation of the dye. At higher pH when the surface is negatively charged, the adsorption is less due to the electrostatic repulsion between the negatively charged surface and the dye. It is also possible that the heterogeneous degradation in the presence of MnO2 involves the formation of precursor complex between the dye and surface bound Mn.46 Electrons from the activated dye move to the Mn(IV) on the surface of MnO2. Consequently, the dye undergoes oxidative degradation. The Mn(II) thus formed reductively from MnO2 dissolves in the bulk solution. Thus MnO2 functions both as a catalyst as well as an oxidant. The Mn(II) is oxidized to Mn(IV) oxide again by the dissolved O2. In this respect, MnO2 plays the role of a catalyst and dissolved O2 acts as the oxidant. The re-adsorption of free Mn(II) ions in solution back onto MnO2 surface is facilitated at pH beyond the PZC. At the natural pH, ~5.5 of the reaction system, the 0
ln
C
kKt
k t
'
C
0
decolorization of IC in the presence of MnO2/UV is 50% more efficient than simple adsorption. High degradation of IC at pH ~2 shows that it is induced by extremely acidic conditions. UV irradiation and MnO2 accelerate the degradation. The slight increase in degradation at pH~ 11 may be due to increased number of reactive .OH radicals formed from the higher concentration of OH- ions.
The effect of pH on the photocatalytic efficiency of a highly adsorbing and reactive oxide such as MnO2 may not be simple or straightforward because it depends on the complex interplay of multiple factors, i.e. chemistry of the substrate and the surface, extent, and mode of adsorption (of IC as well as the numerous intermediates), concentration and nature of interactions of reactive free radicals, etc. The adsorption of the substrates is more in the acidic range while the concentration of the .OH radical is more in the alkaline region as explained earlier. Thus the effect of pH on these two parameters, which are important for the degradation of IC, is different and opposing. As a consequence, the combined net effect need not necessarily be the same quantitatively even at the same pH at different times. Hence precise correlation of the effect of pH on the adsorption/degradation of IC with the PZC of MnO2 will not be fully consistent. Lack of direct correlation between the PZC and the adsorption/degradation rate can also be because the PZC itself depends on some factors including the size and nature of dispersion of the particles, chemistry of substrates and the intermediates and the type of catalyst itself.
Effect of H2O2
H2O2, which is concurrently formed in many photocatalytic processes is a powerful oxidant and has been widely investigated for its potential to enhance the mineralization of organic water pollutants. The enhancement is caused by the photocatalytic generation of extra .OH radicals as follows:
H2O2 → 2.OH (6)
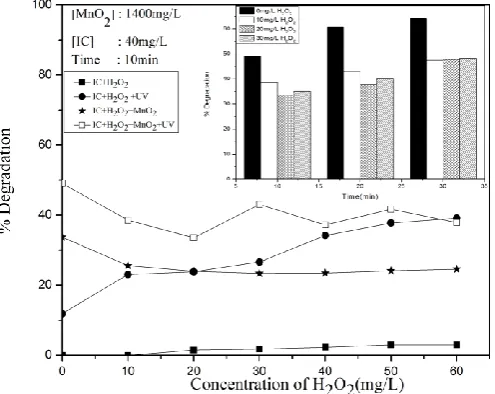
In this context, the effect of externally added H2O2 on the photocatalytic decolorization of IC is tested under different conditions. In the absence of MnO2, under UV irradiation, the degradation of IC increases with increase in the concentration of H2O2 and reaches a plateau at 50 mg L-1 (Figure 8A).
The initial decrease in concentration of IC in the presence of the only MnO2 can be attributed to simple adsorption. In the presence of MnO2 and H2O2 (at 10 mg L-1), initially, there is inhibition in the % decolorization of IC compared to that in the presence of MnO2 only (Figure 8A). With the increase in the concentration of H2O2, the net concentration of IC in the system is stabilized. This indicates that H2O2 is getting competitively adsorbed on the surface of MnO2 and replacing some of the adsorbed IC molecules. Once a steady adsorption-desorption equilibrium for both IC and H2O2 is reached further increase in H2O2 does not result in enhanced adsorption of H2O2 or desorption of IC.
Figure 8A. Effect of added H2O2 on the degradation of IC (Inset:
Effect of time)
In the combined presence of MnO2 and UV irradiation, H2O2 inhibits the degradation initially. At the H2O2 concentration of ~20 mg L-1, the degradation starts increasing moderately and stabilizes at ~30 mg L-1. The stabilized level of degradation is almost the same as in the absence MnO2. This shows that in the presence of H2O2, MnO2 is not an effective photocatalyst for the degradation of IC. Hence MnO2 may be simultaneously generating .OH radicals as well as accelerating their deactivation by facilitating the interaction with H2O2 at the surface. The stabilization of degradation at higher concentration of H2O2 shows that the deactivation as well as the formation of .OH and another ROS is more or less balanced. The stabilization is further evident from Figure 8A (inset) which shows that at later stages of the reaction when the concentration of IC becomes relatively less, the degradation remains more or less the same irrespective of the concentration of H2O2.
At higher concentrations of added H2O2 some of the reactive .OH radicals get quenched as follows:
H2O2 + .OH → HO2. + H2O (7)
Consequently, the number of .OH radicals interacting with the substrate is less resulting in decreased degradation of IC. The quenching of the .OH radicals (oxidation potential: 2.80 eV) results in the formation of less efficient oxidant HO2. (1.70 eV). The decomposition of H2O2 into H2O and O2 and the recombination of HO2. (reactions 8 and 9) are other possible reasons for the inhibition.
UV
2H2O2 → 2H2O + O2 (8)
HO2. + HO2. → H2O2 + O2 (9)
formation and quenching of .OH get balanced, at least in the concentration range studied here, resulting in more or less steady degradation, i.e. no significant effect by added H2O2.
The initial inhibiting effect of H2O2 is further confirmed by addition of H2O2 in-between to the system in which the degradation of IC is in progress. Results are shown in Figure 8B. Every extra addition of H2O2 (20 min and 40 min) decreases the % degradation of IC thereby reconfirming that in the presence of MnO2 as a catalyst, H2O2 functions more as an inhibitor.
Figure 8B. Effect of in-between addition of H2O2 on the
degradation of IC.
The effect of H2O2 on the adsorption of IC over MnO2 as a possible cause of inhibition/stabilization of the degradation is tested by measuring the adsorption of the dye at various concentrations in the presence of H2O2. The results presented in Table 1A show that irrespective of the concentration of IC, H2O2 inhibits the adsorption. Similarly, experiments on the effect of increasing H2O2 concentration on the adsorption of IC (Table 1B), show that the adsorption decreases initially and stabilizes after that.
Table 1A. Effect of H2O2 on the adsorption of IC at various
concentrations on MnO2.[MnO2]:1400 mg L-1, [H2O2]:40 mg L-1,
time:30 min
[IC] mg L-1 Adsorption of IC, % with H2O2 without H2O2
20 23.5 40.7
30 24.4 33.5
40 22.0 33.0
50 19.5 28.9
60 17.0 27.5
Table 1B. Effect varying concentration of H2O2 on the adsorption
of IC on MnO2.[MnO2]:1400 mg L-1, [IC]: 40 mg L-1, time: 30 min
[H2O2] mg L-1 Adsorption of IC, %
0 33.0
10 25.5
20 24.0
30 23.5
40 22.0
50 24.2
60 24.5
Hence it is possible that in the presence of added and/or in situ formed H2O2, at least some of the surface sites on MnO2 are utilized for their adsorption and/or decomposition, and this may be one of the reasons for the initial inhibition by H2O2. However, there is a limit to the number of sites that can be occupied by H2O2 at any point in time for a given amount of MnO2. This may be a reason for the stabilization of the adsorption as well as degradation of IC beyond a particular concentration of H2O2.
The competition between H2O2 and IC for adsorption on the surface is further confirmed by using IC pre-adsorbed MnO2 for H2O2 adsorption/ decomposition (IC: 60 mg L-1, H2O2: 50 mg L-1, MnO2: 1800 mg L-1). In this case, the decrease in the concentration of H2O2 is only ~60 % against ~ 90 % on fresh MnO2.
Effect of persulphate (PS)
PS (S2O82-, E0 = 2.1 V) is a powerful oxidant capable of mineralizing some recalcitrant pollutants under AOP conditions and is investigated as a potential enhancer of the photocatalytic degradation of IC. It has specific advantages such as high solubility and stability under ambient conditions. Further, the SO42- ions, which are the major products of PS reduction are relatively harmless and considered to be environment-friendly. Preliminary experiments showed that PS as such does not cause any degradation of IC. However, irradiation by UV causes moderate degradation which increases with increase in the concentration of PS (Figure 9). The decolorization is ~35 % in the presence of MnO2 in the absence of UV irradiation, which is due to simple adsorption and is practically unaffected by the presence of PS. This also shows that unlike in the case of H2O2, the adsorption of PS on MnO2 is weak.
Figure 9. Effect of added K2S2O8 on the degradation of IC (Inset:
Effect of time).
negative effect in the presence of an excess of PS, any unused oxidant remaining in the system can be used for the treatment of fresh input of IC pollutant which is important from the angle of commercial application of the process.
The MnO2/UV degradation of IC in the presence of the combination of H2O2 and PS showed that the degradation is only the average of the negative effect of H2O2 and the positive effect of PS. Hence this option is not pursued in detail.
PS is known to generate highly reactive SO4-. radical anions in situ under photocatalytic conditions. These can interact with the substrate and initiate/enhance the degradation of organics under AOPs. More SO4-. radicals will be formed with an increase in the concentration of PS, under UV irradiation and a series of chain reactions can follow as in equations 10-20.47
S2O82- → 2SO4-. (10)
S2O82- + RH → SO4-. + HSO4- +R. (11)
RH: organic pollutant
SO4-. + H2O → SO42- + H+ + .OH (12)
SO4-. + RH → R. + HSO4- (13)
.OH+ RH → R. + H2O (14)
R. + .OH → Intermediates → products (15)
SO4-. + R. → Chain termination (16)
SO4-. + .OH → Chain termination (17)
2SO4-. → S2O82- Chain termination (18)
2 .OH → H2O2 Chain termination (19)
2R. → RR Chain termination/ (20)
Various ROS such as H2O2, HO2., .OH etc. and SO4-. formed during the irradiation interact with IC on the surface of the catalyst as well as in bulk, leading to its degradation into various intermediates and eventual mineralization. However, the degradation is not increasing with increase in the concentration of PS, after the initial enhancement. The excess of SO4-. radicals formed in situ at higher concentration of PS may be getting deactivated as in reactions (16) and (18). The reactiveSO4-. radicals can also interact with PS and form less reactive S2O8-. radicals as follows:
SO4-. + S2O82- → SO42- + S2O8-. (21)
Thus the SO4-. radicals which are responsible for the enhancement of the degradation of IC in the presence of PS can get deactivated by unproductive interactions. This leads to decrease/ stabilization in the rate of degradation at higher concentration of PS and with reaction time.
Effect of dissolved salts/anions
Many of the anionic contaminants which are naturally present in water inhibit the efficiency of degradation of organic pollutants under AOPs.36,48,49 Instances of anions functioning as enhancers of the degradation of pollutants also have been reported.50 In this context, the effect of some of the commonly occurring anions in water, i.e. SO42-, Cl-, PO43-, CO32-, HCO3- and NO3- on the efficiency of UV/MnO2 degradation of IC is tested at various concentrations and reaction times (Figure 10A).
Figure 10A. Effect of concentration of anions on the photocatalytic degradation of IC.
The results showed that the anions SO42-, Cl- and PO43- at lower concentrations have only negligible effect on the degradation of IC while CH3COO-, CO32- and HCO3- inhibit the degradation at all concentrations. SO42- and Cl- do not influence the degradation significantly even at higher concentrations while PO43- becomes a good inhibitor at higher concentrations. NO3- enhances the degradation at all concentrations.
At lower concentrations of 5 mg L-1, the anion effect is less pronounced and the inhibition is in the order:
CO32- (inhibition) > HCO3- (inhibition) > CH3COO- (inhibition) > PO43- (mild inhibition to no effect) > SO42- (no
effect) ~ Cl- (no effect) > NO3- (enhancement)
(22)
At higher concentration of the anion (15 mg L-1) where the effect is significant, the inhibition effect is in the sequence;
HCO3- (inhibition) ≥ PO43- (inhibition) > CO32- (inhibition) > CH3COO- (inhibition) > SO42- (no effect) ~ Cl- (no effect)
>NO3- (enhancement)
The inhibiting anions become better inhibitors, and the enhancing anion becomes better enhancer with an increase in concentration. However, the comparative effect of the anions remains more or less the same irrespective of the concentration. Another parameter that can influence the effect of anions is the duration of the reaction possibly due to the increasing presence of various in-situ formed intermediates and the decreasing concentration of the substrate. The relative concentration of the ion with respect to the substrate increases progressively with time leading to more inhibition. The effect is tested at 3 different time intervals, and the results are plotted in Figure 10B.
Figure 10B. Effect of reaction time on the photocatalytic degradation of IC in the presence of various anions.
The relative effect of the anions at different durations of reaction is summarized in (24) - (26).
10 min.:
HCO3- (inhibition) ≥ PO43- (inhibition) > CO32- (inhibition) > CH3COO- (inhibition) > SO42- (no effect) ~ Cl- (no effect)
> NO3- (enhancement)
(24)
20 min.:
HCO3- (inhibition) ≥ PO43- (inhibition) > CO32- (inhibition) > CH3COO- (inhibition) > Cl- (slight inhibition to no
effect) ~ SO42- (no effect) > NO3- (enhancement)
(25)
30 min.:
PO43- (inhibition) > CO32- (inhibition) ≥ HCO3 -(inhibition) > CH3COO- (inhibition) > SO42- (no effect) ~
Cl- (no effect) > NO3- (enhancement)
(26)
The trend remains more or less the same irrespective of the duration of the reaction. The effect ranging from ‘inhibition' to ‘no effect' and ‘enhancement' and the variation depending on the concentration indicate that many reaction parameters such as the characteristics of the anions, the chemistry of the substrate and the catalyst, relative concentration of different components, the nature of their interactions etc. influence the anion effect. Hence any general conclusions on the effect of anions may not be consistent.
The inhibition of the photocatalytic degradation of organics by anions/salts is often explained based on blocking of the active surface sites on the catalyst by competitive adsorption, surface layer formation and/or scavenging of reactive .OH radicals. In this context, the adsorption of IC on MnO2 in the presence of the anions is measured experimentally. The results are presented in Table 2.
The adsorption is the least in the presence of PO43- followed by CO32- and HCO3- while Cl-, CH3COO- (Ac-), SO42- andNO3- do not influence the adsorption. The cation was kept the same in all cases, i.e., Na+. Had competitive adsorption of the anions been the main cause, the inhibition should have been in the order:
PO43- > CO32- ≥ HCO3- > Ac- ~ SO42- ≥ Cl- ~ NO3- (27)
Table 2. Adsorption of IC on MnO2 in the presence of anions.
[IC] : 40 mg L-1, MnO
2 : 0.14 g in 100 mL, [Anion] : 10 mg L-1
Anion Adsorption of IC, %
None 32.2
PO43- 14.3
HCO3- 21.3
CO32- 19.4
Cl- 33.5
SO42- 30.5
Ac- 29.5
NO3- 34.7
This sequence is consistent with the experimentally observed inhibition thereby suggesting that preferential adsorption by the anion is a major cause of inhibition. The anions are also known to scavenge the ROS, especially .OH, which also could cause the inhibition of the degradation of IC. Scavenging of the .OH by anions would yield respective radical anion species as follows:
.OH + HCO3- → H2O + CO3.- (28)
.OH + CO32- → OH- + CO3.- (29)
.OH + SO42- → OH- + SO4.- (30)
.OH + NO3- → OH- + NO3. (31)
.OH + Cl- → OH- + Cl. (32)
The radical anions are also reactive towards organic compounds, though less efficiently than .OH.49 Moderate degradation in the presence of the anions can also be due to the interaction of the radical anions with the substrate on the surface as well as in bulk.
The presence of anions also reduces the diffusion coefficient of the organic pollutant in the reaction medium. Consequently, the pollutant molecules will be less accessible to the reactive .OH and this also can contribute to the inhibition. Anotherpossible reason for the inhibition by anions is the formation of an inorganic layer on the catalyst surface. The efficiency of layer formation depends on the solubility of the salts.51 The higher the solubility of the salt the lower will be the layer formation. The solubility of the salts (in mg/g of water at 200C) tested here is in the order;
NaNO3 ( 94.9) > CH3COONa (54.6) > Na2SO4 (40.8) ≥ Na2CO3 (39.7) > NaCl (36.1) > Na3PO4 (16.3) > NaHCO3
(11.1)
(34)
Correspondingly the layer formation, if any, will be in the order:
HCO3- > PO43- > Cl- ≥ CO32- ≥ SO42- > Ac- > NO3-
(35)
If layer formation is the major cause, the inhibition must be in the same order as in (35). The experimentally observed anion effect in the current instance is not fully consistent with equation (35). However, the trend is similar especially in the case of the maximum (HCO3- > PO43- ) and the minimum (NO3- ) inhibition. Hence, the layer formation also may be contributing partially to the anion effect. However, the relative contribution of various factors towards the anion effect may vary.
The inhibitive or ‘nil' effect of various anions on the photocatalytic degradation of IC in the presence of MnO2 can be explained to a great extent by any or all of the above interpretations. However, a universally consistent explanation to account for the effect of anions in different kinds of photocatalytic systems with different catalysts, substrates and reaction conditions is not possible, and it will be more appropriate to consider individual anions to explain specific effects. In this context, two specific examples, i.e. SO42- for ‘no effect’ and NO3- for ‘enhancement’ are discussed here.
The primary step in the photocatalytic process is:
Catalyst + h Catalyst (e-, h+) (36)
(Formation of electrons and holes)
Catalyst (e-, h+) Catalyst (37)
(Recombination of electrons and holes)
In the case of SO42- ions; they get adsorbed on the surface of the catalyst and interact with the photoproduced holes to generate sulfate radical anions as follows52:
h+ + SO42- → SO4-. (38)
S is a strong oxidizing agent and hence the SO4-. can accelerate the degradation process according to reactions (39) and (40).
SO4-. + Pollutant → SO42-+ Intermediate (39)
SO4-. + Intermediate → → SO42- + CO2 + salts (40)
As seen in reaction (12), the presence of SO4-. can lead to the formation of more reactive .OH radicals which can accelerate the degradation of the dye. Hence, unlike in the case of other anions which scavenge the .OH, the SO4 2-anions concurrently generate them. Thus, factors leading to inhibition and enhancement of the degradation coexist in the system. Under the reaction conditions used here, they may balance, and hence the degradation is practically unaffected. It is also possible that depending on the domination of either of the effects, the net effect may be ‘inhibition,' ‘no effect' or ‘enhancement' at any point in time during the reaction.
The enhancement in the degradation of IC in the presence of NO3- shows that the factors responsible for the inhibition by other anions are not significant here. Hence both the surface and bulk processes are not affected. Further, under irradiation by UV light, NO3- leads to the formation of reactive .OH radicals as follows53:
NO3- + hν → NO2- + O (41)
NO3- + H2O + hν → NO2- + OH- + .OH (42)
O + H2O → 2.OH (43)
The enhancement by NO3- can be thus attributed to the direct and indirect formation of .OH radicals. Zepp et al.53 suggested that nitrate-induced photooxidation is a possible transformation mechanism for trace organic pollutants in shallow clear water bodies with inputs from ground waters or other sources with higher ratios of nitrate/dissolved organic carbon concentration. Zhu et al. also reported similar findings.54
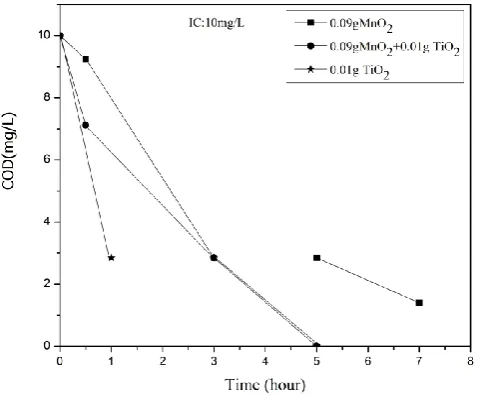
Chemical oxygen demand
Estimation of chemical oxygen demand (COD) of the optimized reaction system UV/MnO2 /IC at various intervals of irradiation shows that the degradation and decolorization of IC do not lead to instant mineralization.
Figure 11. COD of the reaction system at different times of irradiation after decolorization of IC.
The photodegradation of IC is known to yield stable organics such as acetic acid, tartaric acid, malic acid, oxalic acid, anthranilic acid etc.22,25 Independent experiments in our laboratory with these compounds showed that they are not mineralized under MnO2 mediated photocatalysis (not reported here). In this context, the possibility of combining a more efficient photocatalyst such as TiO2 with MnO2 in order to enhance the mineralization capability is examined.
Investigations using different weight ratios of MnO2 and TiO2 have shown that MnO2/TiO2 in the ratio 9:1 is optimum for the decolorization of IC under the standardized reaction conditions. The comparative decolorization and mineralization efficiency of MnO2, TiO2, and MnO2/TiO2 for IC are evaluated. The rate of decolorization and mineralization is more in the presence of MnO2/TiO2 compared to individual MnO2 or TiO2. This is evident from the COD values in the presence of the three catalysts (Figure 11).
The complete and faster mineralization in the presence of MnO2/TiO2 shows clearly that the advantages of higher adsorption and oxidative properties of MnO2 and the photocatalytic efficiency of TiO2 can be beneficially combined for the mineralization of traces of IC in water. However, the precise mechanism of the process, as well as the nature of intermediates, may be different in the case of different catalysts, and these aspects need to be investigated in detail.
General mechanism
The primary step in semiconductor mediated heterogeneous photocatalytic processes is the formation of an electron-hole pair as in reaction (36) which may undergo concurrent recombination as in reaction (37). When the particles are small, the holes escape recombination in the bulk of the catalyst and can reach the surface. The average transit time τD of the charge carriers to reach the surface is calculated by Gratzel and Frank55 as:
(44)
where
r is the radius of the particle and
Dc is the diffusion coefficient of the charge carrier.
If the photogenerated hole does not recombine with the electron, it can react with the organic pollutant (RH) or even with the solvent water as follows:
RH + h+ .R + H+ aq (45)
H2O + h+ .OH + H+ aq (46)
The hole can also react with the OH- ions either present in the system under alkaline conditions or formed on the surface by the dissociative adsorption of water to H+ads. and OH- ads.56. The OH-ads can act as traps for the holes at the surface;
h+ + OH-ad .OHad (47)
.OH + .OH H2O2 (48)
H2O2 formed in the photocatalytic system has been proven to undergo concurrent decomposition leading to the phenomenon of oscillation in its concentration.57 The reductive decomposition of H2O2 by the photogenerated electron as in (49) results in the formation of reactive .OH radicals. This also protects the holes from recombination with the electrons.
H2O2 + e- OH. + OH- (49)
According to Gerischer and Heller58 reaction (47) is more likely than reaction (46) since the availability of holes on the catalyst surface is more under photocatalysis as explained above. Further, the .OHad can exist as the stable product at specific surface sites. Consequently, the oxidation of organic pollutants can occur as:
RH + .OHad R. + H2O (50)
The direct reaction between the organic pollutant and the hole as in reaction (45) can compete with reaction (50) if the concentration of RH is high or the RH molecules are strongly adsorbed on the surface.
If reaction (50) is the main path, the oxidation may be weaker compared to direct oxidation by holes as in reaction (45) since only some of the holes are available for the formation of .OHads.57 This will lead to decrease in the oxidation rate and the quantum efficiency in the case of stable organic molecules.
2
D 2
c
r
D
When there are more H2O2 in the system, it can also trap the h+ as in reaction (51) and quench .OH as in reaction (7) which also lead to decreased rate of degradation.
H2O2 + 2 h+ O2 + 2H+ (51)
Oxygen plays an important role in photocatalytic degradation reactions in aqueous solutions by scavenging the electrons generated on the photocatalyst thereby inhibiting the recombination of electrons and holes. The formation of highly reactive superoxide radical anion which is responsible for the photocatalytic degradation is the outcome of this reaction.
O2 (g) + e- → (O2-.) (52)
O2-. participates in a series of reactions directly or indirectly as in (53) – (60) resulting in the formation of a number of reactive free radicals which interact with and degrade the pollutant.
H2O OH- + H+ (53)
O2-. + H+ HO2. (54)
2HO2. H2O2 + O2 (55)
HO2. + e- HO2-. (56)
HO2-. + H+ H2O2 (57)
H2O2 + O2-. OH. + OH- + O2 (58)
H2O2 + e- OH. + OH- (59)
OH- + h+ OH. (60)
In order to confirm the role of dissolved O2 in the photocatalytic degradation IC, the reaction system is deaerated with N2, and the experiments were carried out under otherwise identical conditions. The effect of deaeration is not significant thereby suggesting that the main source of O2 for the reaction is not the dissolved form. The required O2 is provided primarily by the surface (adsorbed) and the lattice of MnO2 which cannot be easily removed by flushing with N2.
Amorphous MnO2 is known to release bulk oxygen more easily to the surface which makes it a better catalyst regarding facile activation and regeneration.32 MnO2 with multiple oxidation states together with its electron donor-acceptor properties is an excellent oxidation – reduction catalyst. Photolysis of MnO2 increases the oxygen species on the surface either by oxygen migration to the surface or by Mn migration to the bulk or both. Surface oxygen is consumed faster upon irradiation and oxygen from the bulk moves to the surface. In the case of MnO2, the loss of oxygen takes place at temperatures as low as 50 0C. The
photo-initiated oxygen release from MnO2 may be due to movement of O2- (bulk) to the surface and subsequent weakening of MnO2 bonds.59 In the re-oxidation of oxides, atmospheric oxygen and/or dissolved O2 is taken up by the surface of the partially reduced MnO2 as follows32:
O2 (g) + e- → (O2-) (61)
(O2-) + e- → 2(O-) → O2- (s) (62)
Most of the oxygen radicals are present in the bulk of the catalyst while some of them may remain on the surface for a short period. These highly active oxygen radicals can regenerate reduced manganese species. Under UV irradiation, the bonds in MnO2 are weakened and O2- is released to the surface. Even though the lifetime of excited state oxygen species is short, they possess adequately high energy and electronegativity to facilitate the reduction or hydrogen abstraction from the substrate. Possible reaction pathways are:
hν hν
O2- (s) → (O-) → O2 (surface) (63) - e- - e-
O2 (surface) + RH (i.e., IC) → HO2. (surface) + R. (64)
O2 (surface) + R→Intermediates →
→ Mineralization (CO2 + H2O) (65)
The abstracted H. interacts with the hole and gets oxidized to form acid sites on the surface of MnO2.
H. + h+ →H+ (66)
The regeneration of MnO2 may be represented as:
hν
-Mn(3+ or 2+) → -Mn(4+ or 3+) (67) - e-
n(-Mn(4+ or 3+)-)+O2-(from reaction 62)→ MnO2 (or Mn3O4)
(68)
The migration of bulk oxygen to the less energetic surface sites and its consumption by participation in catalytic reactions has been proven experimentally and from ESR studies.60
The formation of H2O2 during the photocatalytic degradation of IC is verified by analyzing the reaction solution immediately after decolorization and periodically after that. The concentration of in situ formed H2O2 increases initially, reaches an optimum and decreases after that. This is consistent with the earlier reports57 on the oscillation in the concentration of in situ formed H2O2 in semiconductor-mediated photocatalytic systems which are attributed to concurrent formation and decomposition [reactions (53)-(60)].
Dyes are known to absorb light efficiently in the visible region. Hence IC can absorb more visible light and act as a sensitizer thereby transferring electrons from the excited dye molecule to the conduction band of MnO2.
Dye (ads) → Dye (ads)* (69)
Dye (ads)* + MnO2 → Dye(ads)+. + MnO2 (eCB-) (70)
Dye(ads)+. → Intermediates → Oxidation/Degradation
(71)
The similar pathway was suggested for the degradation of dyes on Ag/TiO2 catalyst also.61 However, dye sensitization as a mode of catalyst activation is highly concentration-dependent. At lower concentration of the dye, there will be only monolayer coverage and the energy acquired by light absorption may not be adequate to sensitize the semiconductor. At higher concentration, there will be multilayer adsorption of the dye. Consequently, light absorption and photocatalytic efficiency may not increase significantly because the inner layers will tend to act as insulators with respect to outer layers.
Conclusion
Trace amounts of the toxic dye pollutant Indigo Carmine in water are degraded efficiently by MnO2 mediated photocatalysis. However, the degradation does not lead to complete mineralization which requires more efficient photocatalyst such as TiO2 or the combination MnO2/TiO2. The degradation does not follow the modified L-H mechanism or pseudo-first order kinetics as in the case of many AOPs probably because of the high adsorption and oxidation capability of MnO2 and consequent faster degradation. The degradation is faster under acidic conditions. H2O2 which is a powerful oxidant for many photocatalytic reactions inhibits the degradation which is attributed to the quenching of the photoproduced holes and reactive .OH radicals. However, another oxidant persulphate enhances the degradation through the in situ generation of reactive SO4-. radical anion and .OH. Salts/anions likely to be present in water influence the degradation differently varying from ‘moderate inhibition' to ‘no effect' or even ‘enhancement' depending on the chemistry of the anion, its
concentration, interactions with the substrate, catalyst, intermediates, etc. and other reaction conditions. The surface, bulk as well as lattice oxygen of MnO2 participates in the photocatalytic degradation of IC, and this results in decreased activity with every recycling.
Acknowledgement
Financial support from the Council of Scientific and Industrial Research (CSIR), India by way of Senior Research Fellowship to KPV is gratefully acknowledged.
References
1Hoffmann, M. R., Martin, S. T., Choi, W., Bahnemann, D. W.,
Chem. Rev., 1995, 95, 69,
pubs.acs.org/doi/abs/10.1021/cr00033a004
2Gaya, U. I., Abdullah, A. H., J. Photochem. Photobiol. C:
Photochem. Rev.,2008, 9, 1,
https://doi.org/10.1016/j.jphotochemrev.2007.12.003
3Devipriya, S., SugunaYesodharan., Solar Energy Materials and
Solar Cells, 2005, 86, 309,
https://doi.org/10.1016/j.solmat.2004.07.013
4Ollis, D., Pichat, P., Serpone, N., Appl. Catal.B: Environ., 2010,
99,377, https://doi.org/10.1016/j.apcatb.2010.06.030
5Chong, M. N., Jin, B.,Chow, C. W. K., Saint, C., Water Res.,2010,
44, 2997, https://doi.org/10.1016/j.watres.2010.02.039
6Sakthivel, S., Neppolean, B., Shankar, M. V., Arabindoo, B.,
Palanichamy, M., Murugesan,V., Solar Energy Mater. Sol.
Cells, 2003, 77, 65, https://doi.org/10.1016/S0927-0248(02)00255-6
7Shibin, O. M., Rajeev, B., Veena, V., Yesodharan, E. P.,
Yesodharan, S., J. Adv. Oxid. Technol,2014, 17, 297,
https://doi.org/10.1515/jaots-2014-0215
8Fenoll, J., Hellin, C., Martinez, M., Flores, P., Navarro, S., Appl.
Catal. B: Environ.,2012, 115-116, 31,
https://doi.org/10.1016/j.apcatb.2011.12.023
9Rao, A. N., Sivasankar, B., Sadasivam, V., J. Hazard. Mater.,
2009, 166, 1357, DOI:10.1016/j.jhazmat.2008.12.051
10Takeuchi, J. P., Cuong, M., Zhang, T-M.,Matsuoka, M., Anpo,
M., Res. Chem. Intermed., 2010, 36, 327,
doi:10.1007/s11164-010-0126-5
11Pei, D., Luan, J., Int. J. Photoenergy, 2012, article id 262831, 13
pages, http://dx.doi.org/10.1155/2012/262831
12Chen, H., Li, W., Liu, H., Zhu, I., Micropor. Mesopor. Mater.,
2011, 138, 235,
https://doi.org/10.1016/j.micromeso.2010.09.021
13Wu, C. G., Chao, C. C., Kuo, F. T., Catal.Today,2004, 97, 103,
https://doi.org/10.1016/j.cattod.2004.04.055
14Bae, E., Choi, W., Environ Sci. Technol., 2003, 37, 147,
DOI: 10.1021/es025617q
15Li, Y., Sun, S., Ma, M., Ouyang, Y., Yan, W., Chem. Eng. J.,
2008, 142, 147, https://doi.org/10.1016/j.cej.2008.01.009
16Anpo, M., Takeuchi, M., J CataL., 2003, 216, 505,
https://doi.org/10.1016/S0021-9517(02)00104-5
17Zheng, Z., Huang, B., Qin, X., Zhang, X., Dai, Y., Whangbo,
M-H., J. Mater. Chem., 2011, 21, 9079.
https://doi.org/10.1039/c1jm10983a
18Sakthivel, S., Shankar, M. V., Palanichamy, M., Arabindoo, A.,
Bahnemann, D. M., Murugesan, B. V., Water Res., 2004, 38,