Special Issue of the
First Workshop on Patterns Promotion
and Anti-patterns Prevention
(PPAP 2013)
Experimenting the Influence of Numerical Thresholds on
Model-based Detection and Refactoring of
Performance Antipatterns
Davide Arcelli, Vittorio Cortellessa, Catia Trubiani
30 pages
Guest Editors: Aminata Saban ´e, Wei Wu
Managing Editors: Tiziana Margaria, Julia Padberg, Gabriele Taentzer
Experimenting the Influence of Numerical Thresholds on
Model-based Detection and Refactoring of
Performance Antipatterns
Davide Arcelli1, Vittorio Cortellessa2, Catia Trubiani3
1[email protected] 2[email protected]
Dipartimento di Ingegneria e Scienze dell’Informazione e Matematica (DISIM) Universit`a degli Studi dell’Aquila
L’Aquila, Italy
Abstract: Performance antipatterns are well-known bad design practices that lead to software products suffering from poor performance. A number of performance antipatterns has been defined and classified and refactoring actions have also been suggested to remove them. In the last few years, we have dedicated some effort to the detection and refactoring of performance antipatterns in software models. A specific characteristic of performance antipatterns is that they contain numerical parameters that may represent thresholds referring to either performance indices (e.g., a device utilization) or design features (e.g., number of interface operations of a software component). In this paper, we analyze the influence of such thresholds on the capability of detecting and refactoring performance antipatterns. In particular, (i) we analyze how a set of detected antipatterns may change while varying the threshold values and (ii) we discuss the influence of thresholds on the complexity of refactoring actions. With the help of a leading example, we quantify the influence using precision and recall metrics.
Keywords:Software Performance Antipatterns, Detection, Refactoring, Numerical thresholds.
1
Introduction
In the software development domain, there is a high interest in the early validation of perfor-mance requirements because it avoids late and expensive fixes to consolidated software artifacts. Model-based approaches, pioneered under the name of Software Performance Engineering (SPE) by Smith [Smi07], aim at producing performance models early in the development cycle and us-ing quantitative results from model solutions to refactor the design with the purpose of meetus-ing performance requirements [WFP07].
useful to overcome performance problems (e.g., split a software component in two components and re-deploy one of them). The results interpretation is today exclusively based on the analysts’ experience and therefore it suffers of lack of automation.
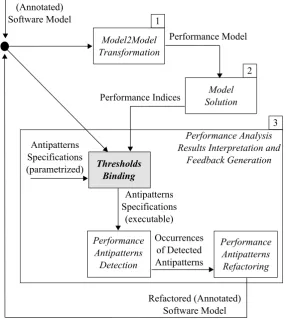
(Annotated) Software Model
Model2Model Transformation
1
Model Solution
2
Performance Analysis Results Interpretation and
Feedback Generation 3 Performance Model
Performance Indices
Antipatterns Specifications (parametrized)
Antipatterns Specifications
(executable)
Thresholds Binding
Performance Antipatterns Detection
Performance Antipatterns Refactoring Occurrences
of Detected Antipatterns
Refactored (Annotated) Software Model
Figure 1: Model-based software performance analysis process.
Figure1 illustrates a model-based software performance analysis process. It includes three main operational steps: (1) theModel2Model Transformationstep takes as input an annotated1 software model and generates a performance model [CMI11]; (2) theModel Solutionstep takes as input a performance model and produces a set of performance indices [LKGS84]; (3) the
Performance Analysis Results Interpretation and Feedback Generationmacro step takes as input both the software model and the performance indices to detect possible performance problems2 and it provides a refactored (annotated) software model where problems have been removed. In particular, the refactored model is obtained with a semantics-preserving transformation that aims at improving the quality of the original software model. In other words, the functional aspects of this latter model remain unaltered after the transformation. For example, the interaction between
1 Software model annotations support the performance analysis by specifying parameters like workload, resource
demands, etc. [Obj09].
2A performance problem is an unfulfilled requirement, e.g., the estimated response time of a service is higher than
two components might be refactored to improve performance by sending fewer messages with larger data per message.
Few approaches have been recently introduced for this macro step [Xu12, MKBR10] (see more details in Section2) as have been working on the detection and refactoring of performance antipatterns [CDE+10,TK11,CDDT12].Performance antipatterns[SW03] are well-known bad design practices that lead to software products suffering from poor performance and they include solutions in terms of refactoring actions.
The macro step of Figure1has been detailed with the two main steps that we have envisaged in our approach, which are performance antipatterns detection and refactoring. A further prelim-inary step has been made explicit in Figure1, i.e., thethresholds bindingand it represents the focus of this paper.
In fact, a specific characteristic of performance antipatterns is that they contain numerical pa-rameters that represent thresholds referring to either performance indices (e.g.,high,lowdevice utilization) or design features (e.g.,many interface operations,excessivemessage traffic). The
thresholds binding step takes as input parametrized antipatterns specifications, determines the numerical values for antipattern thresholds and gives as output executable antipatterns specifica-tions3.
The goal of this paper is to analyze the influence of such thresholds on the capability of detect-ing and refactordetect-ing performance antipatterns. In particular, (i) we analyze how a set of detected antipatterns may change while varying the threshold values and (ii) we discuss the influence of thresholds on the complexity of refactoring actions. The thresholds influence is also quantified with precision and recall metrics.
To complete the description of Figure 1, we remark that the whole process may be iterated several times to find the model that best fits the performance requirements. In fact, several antipattern occurrences may be detected in a software model, and several refactoring actions may be available for solving each antipattern. Hence, at each iteration the antipattern-based refactoring actions are aimed at building new (refactored) software models that undergo the same process.
The remainder of the paper is organized as follows. Section2presents related work. Section
3provides some background on the thresholds introduced for the specification of performance antipatterns. Section 4 presents an illustrative example where performance antipatterns have been detected and refactored while considering fixed thresholds. Section5provides a sensitivity analysis on the values of thresholds. Section6 discusses the emerging issues derived from our experimentation. Section7concludes the paper by outlining the most challenging research topics in this area.
2
Related work
Several approaches have been recently introduced to specify and detect code smells and an-tipatterns [MPN+12,KPGA12,RRPK12,YM12,PZ12]. They range from manual approaches, based on inspection techniques [TSFB99], to metric-based heuristics [Mar04,OKAG10], using
3 “Executable” means that these resulting specifications can be used in the detection step to browse the software
rules and thresholds on various metrics [MGDM10] or Bayesian Belief Networks [KVGS11]. In complement, our approach intends to work at the design level and it can be applied early in the software life-cycle.
A small number of methodologies [MGDM10, KVGS11] were introduced to formalize the concepts and properties of code smells at a high-level of abstraction, whereas no formalization had been yet provided for the performance antipatterns specified in [SW03].
Very few model-based approaches for the macro step of Figure 1 exist and, in [AC13], we compared the approaches working either on software or performance sides. On the software side, in [MKBR10], meta-heuristic search techniques are used for improving different non-functional properties of component-based software systems: evolutionary algorithms search the architec-tural design space for optimal trade-offs. The main limitation of such approach is that it is quite time-consuming because the design space may be huge. On the performance side, in [Xu12], performance problems are identified before the implementation of a software system, but they are based only on bottlenecks (e.g., the “One-Lane Bridge” antipattern) and long paths. The main limitation of such approach is that it only applies to Layered Queueing Network perfor-mance models, hence its portability to other notations is yet to be proven and it may be quite complex.
In the area of software design quality improvement, several search-based refactoring tech-niques have been proposed. In [SSB06], a search-based approach for refactoring the class struc-ture of a software system is proposed, but it is limited to a restricted set of refactorings. In [HT07], search-based techniques are used to automatically discover useful refactorings aimed at improving the quality of software systems. Authors use the concept of Pareto optimality to search-based refactoring, hence multiple fitness functions lead to different Pareto optimal refac-torings. In [OC08], multiple weighted metrics are combined into a single fitness function that is based on well-known measures of coupling between components. All these search-based ap-proaches share the same limitation, i.e., the search space may be huge, so the search process may be time-consuming.
3
Thresholds in performance antipattern
specification/representa-tion
Performance antipatterns have been originally defined in natural language [SW03]. Hence, we first tackled the problem of providing a more formal representation by introducing first-order logic rules that express a set of system properties under which an antipattern occurs [CDT12]. More recently, we undertook the problem of removing performance antipatterns detected in soft-ware models by introducing a role-based approach that allows to formalize the refactoring em-bedded into performance antipattern definitions [ACT12].
Our formalization of antipatterns [CDT12] reflects our interpretation of their informal textual definitions. Other feasible interpretations of antipatterns can be provided. This unavoidable gap, that recurs in any formalization task, requires a wider investigation to consolidate the antipatterns definitions and is left for future work.
behavioral to deployment. They additionally include parameters related to design features and performance indices. In fact, antipattern parameters are related to design characteristics (e.g.,
manyusage dependencies,excessivemessage traffic) and–or to performance results (e.g.,high,
lowutilization), hence thresholds must be introduced.
Because we cannot avoid thresholds in antipatterns definition, detection and refactoring ac-tivities are heavily affected by the multiplicity and the estimation accuracy of thresholds an antipattern requires.
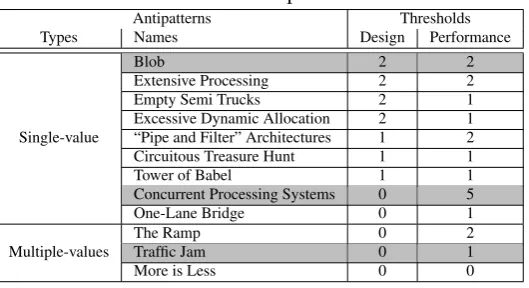
Table 1contains a list of performance antipatterns [SW03]. Each row represents a specific antipattern that is characterized by four attributes: antipattern type, name, and number of de-sign/performance thresholds. We have partitioned antipatterns in two different types [CDT12]: the ones detectable by single values of performance indices (such as mean, max, or min values), named Single-valueperformance antipatterns, and the ones requiring the trend (or evolution) of performance indices in time, namedMultiple-valuesperformance antipatterns. Due to these characteristics, performance indices needed to detect the latter type of antipatterns must be ob-tained via simulation or monitoring.
Table 1: Overview of antipatterns thresholds.
Antipatterns Thresholds
Types Names Design Performance
Single-value
Blob 2 2
Extensive Processing 2 2
Empty Semi Trucks 2 1
Excessive Dynamic Allocation 2 1 “Pipe and Filter” Architectures 1 2 Circuitous Treasure Hunt 1 1
Tower of Babel 1 1
Concurrent Processing Systems 0 5
One-Lane Bridge 0 1
Multiple-values
The Ramp 0 2
Traffic Jam 0 1
More is Less 0 0
From Table 1, we observe that: (i) some antipatterns include both design and performance thresholds such as Blob, Extensive Processing, etc.; (ii) some antipatterns only include perfor-mance thresholds, such as Concurrent Processing Systems, One-Lane Bridge, etc.; (iii) there is one antipattern (i.e., the More is Less) without thresholds because it relies on configuration parameters (database and web connections, etc.) that are detected by run-time software analysis. The binding of thresholds to concrete numerical values (e.g.,0.8may denote high utilization for a hardware resource) is a crucial point of any formalization, because it affects the number of false positives and true negatives that may occur.
Different sources of information can be used to support the binding of thresholds, such as: (i) the system requirements; (ii) the domain experts knowledge; (iii) the evaluation of the system under analysis. In our previous work [CDT12], we provided some heuristics to calculate these thresholds.
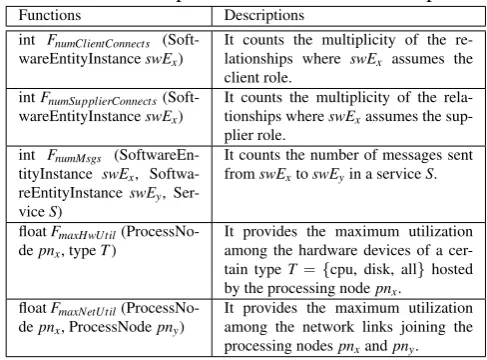
Blob -A Blob occurs when a component requires alotof information from other ones, it gen-eratesexcessivemessage traffic that lead toover utilizethe device on which it is deployed or the network involved in the communication. The logic-based formula of the Blob antipattern has been defined in [CDT12] and reported in Equation (1), where swEandSrepresent the set of all software components and services, respectively.
∃swEx,swEy∈swE,S∈S|
(FnumClientConnects(swEx)≥T hmaxConnects ∨FnumSupplierConnects(swEx)≥T hmaxConnects) ∧(FnumMsgs(swEx,swEy,S)≥T hmaxMsgs ∨FnumMsgs(swEy,swEx,S)≥T hmaxMsgs) ∧(FmaxHwUtil(Pxy,all)≥T hmaxHwUtil
∨FmaxNetUtil(PswEx,PswEy)≥T hmaxNetUtil) (1)
Table2reports the functions involved in the Blob specification. The first column of the Table shows the function signatures and the second column provides their descriptions.
Table 2: Functions specification for the Blob antipattern.
Functions Descriptions int FnumClientConnects
(Soft-wareEntityInstanceswEx)
It counts the multiplicity of the re-lationships where swEx assumes the client role.
intFnumSupplierConnects (Soft-wareEntityInstanceswEx)
It counts the multiplicity of the rela-tionships whereswExassumes the sup-plier role.
int FnumMsgs (SoftwareEn-tityInstance swEx, Softwa-reEntityInstanceswEy, Ser-viceS)
It counts the number of messages sent fromswExtoswEyin a serviceS.
floatFmaxHwUtil (ProcessNo-depnx, typeT)
It provides the maximum utilization among the hardware devices of a cer-tain typeT={cpu, disk, all}hosted by the processing nodepnx.
floatFmaxNetUtil (ProcessNo-depnx, ProcessNodepny)
It provides the maximum utilization among the network links joining the processing nodespnxandpny.
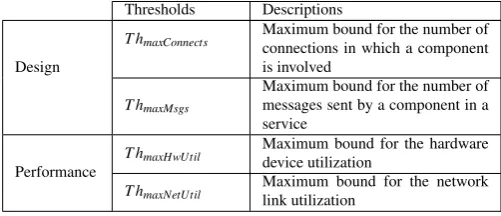
Table 3 reports the thresholds involved in the Blob specification [CDT12]: two thresholds (T hmaxConnects,T hmaxMsgs) refer to design features, whereas the other ones (T hmaxHwUtil,T hmaxNetUtil)
are related to performance indices.
Heuristics for Blob thresholds can be defined as follows [CDT12]. T hmaxConnects can be es-timated as the average number of connections per component, by considering the entire set of software components in the software system, plus the corresponding variance. In a similar way,
T hmaxMsgs can be estimated as the average number of sent messages per software component, plus the corresponding variance.T hmaxHwUtilcan be estimated as the average value of utilization
Table 3: Thresholds specification for the Blob antipattern.
Thresholds Descriptions
Design
T hmaxConnects Maximum bound for the number ofconnections in which a component is involved
T hmaxMsgs
Maximum bound for the number of messages sent by a component in a service
Performance
T hmaxHwUtil Maximum bound for the hardwaredevice utilization T hmaxNetUtil Maximum bound for the networklink utilization
CPS -A CPS occurs when processes cannot make effective use of available hardware nodes because of a non-balanced assignment of tasks to devices. Some hardware nodes areover-utilized
and some others areunder-utilized. CPS occurrences are denoted with (hwNode1, hwNode2),
wherehwNode1is the over-utilized hardware node andhwNode2is the under-utilized one. The
logic-based formula of the CPS antipattern has been defined in [CDT12] and reported in Equation (2), wherePrepresents the set of all the hardware nodes.
∃Px,Py∈P|
FmaxQL(Px)≥T hmaxQL
∧[(FmaxHwUtil(Px,cpu)≥T hmaxC puUtil ∧FmaxHwUtil(Py,cpu)<T hminC puUtil) ∨(FmaxHwUtil(Px,disk)≥T hmaxDiskUtil
∧(FmaxHwUtil(Py,disk)<T hminDiskUtil))] (2)
Table4reports the functions involved in the CPS specification. The first column of the Table shows the function signatures and the second column provides their descriptions.
Table 4: Functions specification for the CPS antipattern.
Functions Descriptions float FmaxQL (ProcessNode
pnx)
It provides the maximum queue length among the hardware devices hosted by the processing nodepnx.
intFmaxHwUtil(ProcessNode pnx, typeT)
It provides the maximum utilization among the hardware devices of a cer-tain typeT={cpu, disk, all}hosted by the processing nodepnx.
Table5reports the thresholds involved in the CPS specification [CDT12]: all the five thresh-olds (T hmaxQL,T hmaxC puUtil,T hminC puUtil,T hmaxDiskUtil, andT hminDiskUtil) are related to
perfor-mance indices.
Heuristics for CPS thresholds can be defined as follows [CDT12]. T hmaxQL can be estimated as the average value of queue length per hardware device, plus the corresponding variance.
Table 5: Thresholds specification for the Concurrent Processing Systems antipattern.
Thresholds Descriptions
Performance
T hmaxQL Maximum bound for the hardwaredevice queue length T hmaxC puUtil
Maximum bound for the processing device utilization
T hminC puUtil Minimum bound for the processingdevice utilization T hmaxDiskUtil Maximum bound for the disk de-vice utilization T hmaxDiskUtil Maximum bound for the disk de-vice utilization
of utilization per processing device, minus the corresponding variance. T hmaxDiskUtil can be
estimated as the average value of utilization per disk device, plus the corresponding variance; similarly,T hminDiskUtilcan be estimated as the average value of utilization per disk device, minus the corresponding variance.
TJ -A TJ occurs when one problem causes a backlog of jobs that results in a wide variability in response time, which persists long after the problem has disappeared. The logic-based formula of the TJ antipattern has been defined in [CDT12] and reported in Equation (3), whereOrepresents the set of all operation instances.
∃OpI∈O|
∑1≤t≤k|(FRT(OpI,t)−FRT(OpI,t−1))|
k−1 <T hOpRtVar
∧ |FRT(OpI,k)−FRT(OpI,k−1)|>T hOpRtVar
∧∑k≤t≤n|(FRT(OpI,t)−FRT(OpI,t−1))|
n−k <T hOpRtVar (3)
Table6 reports the functions involved in the TJ specification. The first column of the Table shows the function signatures and the second column provides their descriptions.
Table 6: Functions specification for the TJ antipattern.
Functions Descriptions floatFRT(OperationInstance
OpI, timeIntervalt)
It provides the estimated response time of the operation instance OpI at the time intervalt
Table7reports the threshold involved in the TJ specification [CDT12]:T hOpRtVar is related to performance indices.
Table 7: Threshold specification for the Traffic Jam antipattern.
Thresholds Descriptions Performance T hOpRtVar
Maximum bound for the variabil-ity in response times of operations across simulation intervals
exploit historical data (obtained by previous performance analysis) to accurately tune the slope used as boundary for the increase of response time and the decrease of throughput.
4
Detection and refactoring of antipatterns: fixed thresholds
In this section, we present the example leading our experimentation. In particular, we first de-scribe the (Annotated) E-Commerce System (ECS) software model and the performance indices obtained from its analysis. We then perform a preliminary antipatterns detection/refatoring step with fixed thresholds values.
4.1 An illustrative Example: ECS model
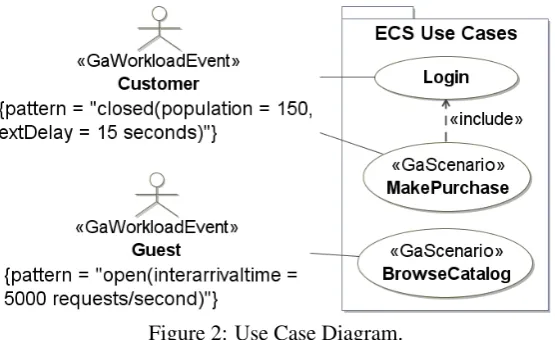
ECS is a web-based system that manages business data related to books and movies. Figure2
shows the UML [Obj05] Use Case Diagram: a Guestmay invoke the BrowseCatalogservice, whereas aCustomermay invoke two services, i.e.,LoginandMakePurchase.
Figure 2: Use Case Diagram.
Software model annotations support performance analysis. In fact, in Figure 2, we observe that MARTE [Obj09] annotations have been added to specify the system workload. In particular, (i) a closed workload has been defined for theMakePurchaseservice, for which the number of users is set to 150 with an average thinking time of 15 seconds and (ii) an open workload has been defined for theBrowseCatalog service, for which the average arrival rate is set to 5,000 requests per second.
We assume to have a multi-view annotated software model, composed byStatic,Dynamicand
Æmilia [BDC02]) allow to model different views of a software system to achieve a clear separa-tion of concerns. For software analysis, a (possibly restricted) set of views is usually considered, where each view is properly annotated with parameters involved in the analysis process. The ap-proaches in [BDIS04] represent a broad summary on the usage of multiple views in performance analysis.
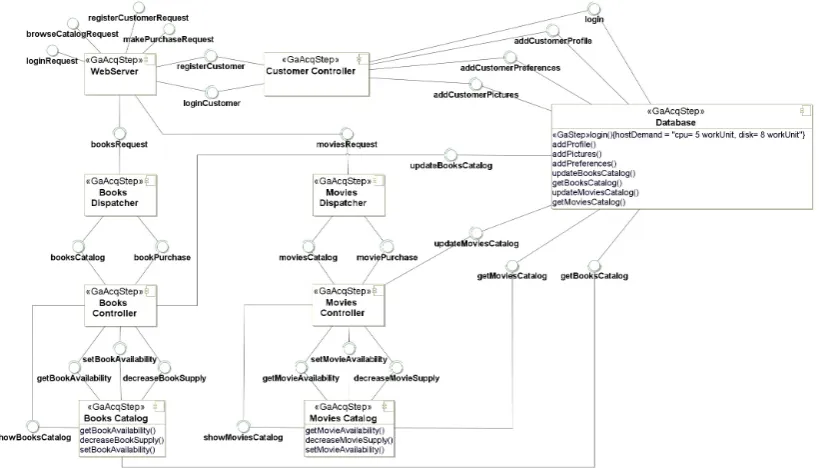
Figure 3: (Annotated) Static View.
Several software components have been defined and connected in the Static View (see the UML Component Diagram in Figure3). MARTE annotations have been added to specify the host demand required by components operations. For example, in Figure3, we observe that the
login operation provided by theDatabasecomponent requires 5 and 8 work units for cpu and disk devices, respectively.
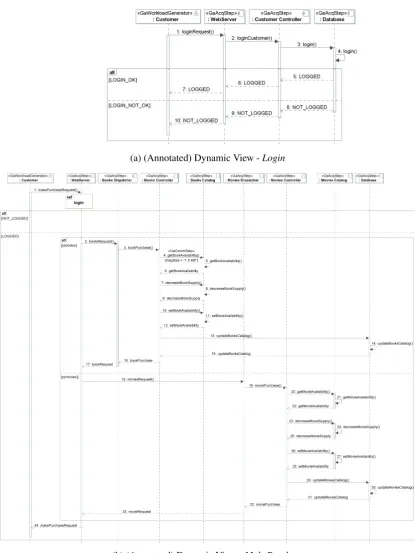
Among all system services, we focus here on: (i)MakePurchase, which is triggered whenever a customer wants to purchase a book or a movie, after authentication (see the UML Sequence Diagram in Figure4); (ii)BrowseCatalog, which is triggered whenever a guest wants to browse book or movie catalogues (see the UML Sequence Diagram in Figure5). MARTE annotations have been added to specify the message size of components communications. For example, in Figure4, we observe that theBooksControllercommunicates with theBooksCatalogby means of a message (getBookAvailability) whose size is equal to 1.5 KB.
(a) (Annotated) Dynamic View -Login
(b) (Annotated) Dynamic View -MakePurchase
Figure 5: (Annotated) Dynamic View: BrowseCatalogservice.
We assume that performance requirements have been defined on theMakePurchaseand Browse-Catalogservices: (i) the average response time of theMakePurchaseservice must not exceed 1.83 seconds; (ii) the average response time of theBrowseCatalog service must not exceed 5 seconds. Both requirements must be fulfilled under a workload of 150 customers.
A.I Performance Annotations
Table 8 reports the average service demands (expressed in seconds) for the MakePurchase
service. We have supposed an average thinking time of 15 seconds (see Figure 2) for each customer.
Table 8:MakePurchaseservice demands.
Node D(MakePurchase) [sec] CustomerNode 15
WebServerNode 0.015 BooksDispatcherNode 0.008 MoviesDispatcherNode 0.062 BooksControlNode 0.1 MoviesControlNode 0.105
DatabaseNode 0.09
Table 9 reports the average service demands (expressed in seconds) for the BrowseCatalog
service. We have supposed an average arrival rate of 5,000 requests/second (see Figure2).
Table 9:BrowseCatalogservice demands.
Node D(BrowseCatalog) [sec] WebServerNode 0.06 BooksDispatcherNode 0.032 MoviesDispatcherNode 0.248 BooksControlNode 0.4 MoviesControlNode 0.42
DatabaseNode 0.36
A.II Performance Analysis
The performance analysis has been conducted by transforming the software model into a Queueing Network (QN) model [CM02] and by solving the latter with two techniques [Jai91]: (i) Mean Value Analysis for Single-value antipatterns and (ii) Simulation for Multiple-value an-tipatterns. Both solution techniques are supported by Java Modeling Tools (JMT) [CS11].
Table10shows the resulting performance indices for the ECS software model. In particular, the average response times (RT), utilizations (U), and queue length (QL) of hardware nodes are reported as well as the average response times ofMakePurchase andBrowseCatalogservices. The utilization of a hardware node is estimated as the maximum value overall of its cpu and disks devices [CDT12]. Hence, the columnDEVICE TYPEof Table10containscpuordiskwhether the node utilization is determined by its cpu or disk, respectively.
server-Table 10: Initial performance analysis results for theMakePurchaseandBrowseCatalogservices.
RT U QL DEVICE
[sec] [%] [customers] TYPE MakePurchase 17.16 - 150 -BrowseCatalog 14.37 - 150 -CustomerNode 15 - 131.1 -WebServerNode 0.017 13.11 0.15 cpu BooksDispatcherNode 0.009 6.99 0.07 cpu MoviesDispatcherNode 0.134 54.19 1.17 cpu BooksControlNode 0.672 87.4 5.88 cpu MoviesControlNode 0.934 91.77 8.16 cpu DatabaseNode 0.396 78.66 3.46 disk
side for each request (i.e., the average response time at the server-side) is larger than the stated requirement. In particular, theMakePurchaseservice has an average response time of 17.16 - 15 = 2.16 seconds, which is larger than the defined requirement of 1.83 seconds; theBrowseCatalog
service has an average response time of 14.37 - 5 = 9.37 seconds, which is larger than the defined requirement of 5 seconds.
B. Antipatterns Detection and Refactoring
Before performing the preliminary antipatterns detection/solution step, we define the follow-ing refactorfollow-ing actions used in our experimentation, which build upon our previous work on performance antipatterns removal [ACT12]:
-redeploy(Component c,Node n): this action moves the identified componentcto the noden. Such a refactoring action is aimed at improving the utilization of the node where the component
cwas deployed.
-split(Component c,Integer i,Node[ ]n): this action equally distributes (moduloi) the con-nections of the componentcbetween the latter and several new components that are uniformly deployed on the set of nodesn. Such a refactoring action is aimed at reducing the number of connections ofcin an efficient way.
- mirror(Component c, Integer i, Node[ ]n): this action createsicopies (mirrors) of the c
component. Mirrors are uniformly deployed on the set of nodesn. This means that the incoming workload is equally distributed between the componentcand its mirrors.
-replace(Component c,Float f,Service s): this action replaces the componentcwith a new component having a resource demand for the servicesequal to f ∗ r(c,s), wherer(c,s)is the resource demand ofcfors, and f is a scale factor in the interval]0,1[.
The application of refactoring actions can be limited by pre-existing (functional or non-func-tional) requirements. Examples of functional requirements are legacy ones that disable compo-nents to be split and redeployed. Examples of non-functional requirements are security issues that do not allow the redeployment of software components due to the critical information they manage. For the sake of automation, such requirements should be pre-defined so that the whole process can take into account them and preventively excluding infeasible refactoring actions.
Blob -Table11reports some thresholds involved in the Blob antipattern specification.
Table 11: Thresholds binding for the Blob antipattern. Threshold Value
T hmaxConnects 5
T hmaxHwUtil 90%
With these numerical values, one occurrence of Blob is detected, i.e., theMoviesController
component. TheMoviesCatalogcomponent is not a Blob because it has a number of connections lower thanT hmaxConnects(i.e., 5). Furthermore, although theBooksController component has a
number of connections larger thanT hmaxConnects, the utilization of the node where it is deployed (i.e.,BooksControlNode, whose utilization is 87.4%) is not larger than theT hmaxHwUtil threshold
(i.e., 90%). For similar reasons,BooksCatalogandDatabasecomponents are not Blobs. As refactoring action for theMoviesControllerBlob, we applied
redeploy(MoviesController,MoviesDispatcherNode)
This refactoring leads to a response time of 1.98 seconds, which still does not satisfies the requirement (1.83 seconds). Hence, the preliminary Blob detection is not effective with respect to the requirement ofMakePurchaseresponse time, maybe due to the fact that more significant antipatterns occur in the system.
CPS -Table12reports some thresholds involved in the CPS antipattern specification.
Table 12: Thresholds binding for the Concurrent Processing Systems antipattern. Threshold Value
T hmaxQL 8
T hmaxC puUtil 90%
T hminC puUtil 50%
With these numerical values, two occurrences of CPS are detected, i.e., (MoviesControlNode,
BooksDispatcherNode) and (MoviesControlNode,WebServerNode) pairs of hardware nodes. In case of (MoviesControlNode,BooksDispatcherNode) occurrence, we applied
redeploy(getCriticalComponent(MoviesControlNode),BooksDispatcherNode)
wheregetCriticalComponent(Node n)returns the most critical component, i.e., the one having the highest resource demand among all the components deployed onn, and in particular:
getCriticalComponent(Node n) =
MoviesController
ifn=MoviesControlNode BooksController
This refactoring leads to a response time of 1.66 seconds, which satisfies the requirement (1.83 seconds).
Similarly, in case of (MoviesControlNode,WebServerNode) occurrence, we applied
redeploy(getCriticalComponent(MoviesControlNode),WebServerNode)
This refactoring leads to a response time of 1.67 seconds, which satisfies the requirement (1.83 seconds).
Hence, both the refactoring actions applied to remove the CPS antipattern are beneficial for fulfilling the requirement of 1.83 seconds defined on theMakePurchaseresponse time.
TJ - Table 13 reports some thresholds involved in the TJ antipattern specification. With this numerical value one occurrence of TJ is detected, i.e., theBrowseCatalogservice.
Table 13: Thresholds binding for the Traffic Jam antipattern. Threshold Value
T hOpRtVar 0.25
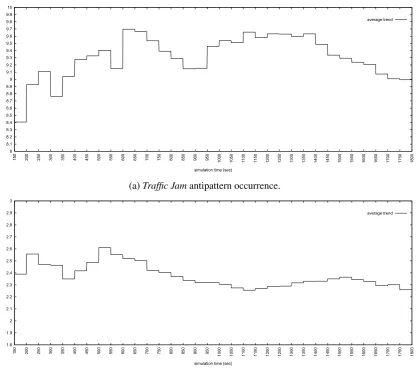
Figure 7a illustrates an excerpt of the response time (observed during simulation) of the
BrowseCatalog service, where we highlight the TJ antipattern occurrence. On the x-axis the simulation time is reported and on the y-axis the response time of the service is depicted. The trend of the average response time for theBrowseCatalogservice is shown. We obtained this trend by dividing the simulation time in intervals of 50 seconds and, for each interval, we calcu-lated the average response time of the observed completions. Hence, we drew theaverage trend
by considering the calculated average response time as constant in the referring interval to obtain the piecewise linear function, i.e., the solid line of Figure 7a. The average trend is observed after 150 seconds because the initial simulation values may be misleading due to the setting of simulation seeds.
We observe several intervals with the occurrence of the TJ antipattern, i.e.,[150,200],[300,350],
[600,650],[900,950]. For example, in the interval[900,950]we observe that theBrowseCatalog
service shows the following features: (a) it has a quite stable value of its response time along pre-vious observation time slots up to 950 seconds of simulation time; (b) it has an increasing value of response time in the intervals[900,950]and[950,1000](in fact a peak is shown: RT( Browse-Catalog, 900) = 9.14 seconds and RT(BrowseCatalog, 950) = 9.46 seconds by giving raise to a gap of 0.32 seconds that is larger than theT hOpRtVar threshold value set to 0.25 seconds); and (c) it has a quite stable value of its response time after 1000 seconds of simulation time (in fact RT(BrowseCatalog, 1000) = 9.53 seconds).
As refactoring action for the unique TJ occurrence, we applied
replace(getCriticalComponent(n),0.25,BrowseCatalog)
Figure7billustrates the performance improvement that we observe for the response time of the BrowseCatalogservice, i.e., for the average trend in the different time slots. Similarly to Figure7a, the average trend is observed after 150 seconds. We find that the maximum slope is achieved for the interval[450,500]of simulation time where there is a difference of 0.12 seconds in the response time of theBrowseCatalogservice, i.e., lower than theT hOpRtVarthreshold value
(see Table13). The average response time is 2.34 seconds, and the requirement (5 seconds) is satisfied. 8 8.1 8.2 8.3 8.4 8.5 8.6 8.7 8.8 8.9 9 9.1 9.2 9.3 9.4 9.5 9.6 9.7 9.8 9.9 10
150 200 250 300 350 400 450 500 550 600 650 700 750 800 850 900 950 1000 1050 1100 1150 1200 1250 1300 1350 1400 1450 1500 1550 1600 1650 1700 1750 1800
RT - browseCa
ta
log (s
ec)
simulation time (sec)
average trend
(a)Traffic Jamantipattern occurrence.
1.8 1.9 2 2.1 2.2 2.3 2.4 2.5 2.6 2.7 2.8 2.9 3
150 200 250 300 350 400 450 500 550 600 650 700 750 800 850 900 950 1000 1050 1100 1150 1200 1250 1300 1350 1400 1450 1500 1550 1600 1650 1700 1750 1800
RT - browseCa
ta
log (s
ec)
simulation time (sec)
average trend
(b) Performance improvement due to theTraffic Jamantipattern solution.
5
Detection and refactoring of antipatterns: sensitivity analysis vs.
thresholds
In this section, we show the impact of thresholds on the capability of detecting and refactoring performance antipatterns. For this goal, we perform antipattern detection and refactoring on the ECS introduced in the previous section, while varying the numerical values of several thresholds. We quantify the threshold variations with the support of precision and recall metrics.
5.1 Precision and Recall for the performance
Precision and recall are well-known metrics aimed at quantifying the effectiveness of a technique for pattern recognition or information retrieval [FB92]. In simple terms, high recall means that the technique has returned most of the relevant results, while high precision means that it has returned substantially more relevant results than irrelevant ones.
In the area of pattern/antipattern detection, these metrics have been very useful to compare dif-ferent techniques in quantitative terms [MGDM10]. When analyzing the results of pattern/anti-pattern detection, a pattern/anti-pattern/antipattern/anti-pattern occurrence can be classified into one of four categories:
true-positive(T P: correctly found), false-positive(FP: incorrectly found), true-negative(T N: correctly unfound), and false-negative (FN: incorrectly unfound). Two common metrics of measuring the accuracy of detection results are then precision and recall. Precision is the ratio of correctly found to all found occurrences and equals toT P/(T P+FP). Recall is the ratio of correctly found to all correct occurrences and equals toT P/(T P+FN).
To apply these metrics in the context of performance antipatterns, we first must refine the concepts of true and false positives in such intrinsically stochastic context. In fact, even if a performance antipattern represents a bad design practice that may adversely affect the system performance, the removal of an antipattern does not certainly lead to improve the system perfor-mance because refactoring actions, applied to remove it, might introduce perforperfor-mance problems somewhere else in the system, and these problems emerge only after solving the refactored per-formance model.
In this paper, we associate the recall metrics to the detection activity and the precision metrics to the refactoring activity, as follows. The recall is defined as the ratio between the number of detected performance antipatterns and the number of existing performance antipatterns. We define the latter quantity as the number of all performance antipatterns that can be detected while varying the antipattern thresholds within predefined ranges.
As mentioned above, to distinguish between true and false positives, we should first observe the effect of an antipattern removal on the system performance. Therefore, the precision is de-fined as the ratio between the number of detected performance antipatterns that actually improve the system performance once removed and the number of detected performance antipatterns.
When analyzing the results of performance antipatterns detection and refactoring, a perfor-mance antipattern occurrence can be classified into one of four categories: true-positive(T P: correctly found, i.e., the detected antipatterns whose refactoring is beneficial), false-positive
refactoring is beneficial). Because the detection process provides different results depending on thresholds binding, we proceed with the following definitions. Recall is the ratio between all the occurrences found with thresholds binding and all found occurrences while varying the antipattern thresholds, thus it equals to(T P+FP)/(T P+FP+T N+FN). Hence, a recall score of 4/5 means that 4 occurrences were detected over 5 occurrences that are found while varying the antipattern thresholds within predefined ranges. Precision is the ratio of correctly found to all found occurrences and equalsT P/(T P+FP). Hence, a precision score of 2/4 means that 2 found occurrences were beneficial for the system performance.
In the next section we show the application of these metrics to the ECS example.
5.2 Precision and Recall Applied to ECS
In this section, we present the experimentation that we conducted while varying thresholds of Blob and CPS antipatterns, first separately and then in an aggregate way. We report the influence of these variations on precision and recall metrics. We do not consider the TJ antipattern because our ECS does not present multiple TJ occurrences, thus precision and recall would be trivial for this case.
B.I Impact of Blob Thresholds
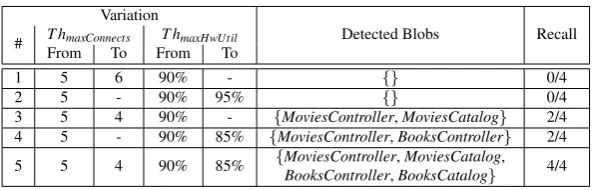
Regarding the Blob antipattern, we variedT hmaxConnects, initially set to 5, in the interval[4, 6]
andT hmaxHwUtil, initially set to 90%, in the interval[85%, 95%]. Such variations lead 4 Blob occurrences to emerge in the ECS, that areMoviesController,MoviesCatalog,BooksController, andBooksCatalog.
Table14summarizes the set of detected Blob occurrences while varying the considered thresh-olds and reports the recall for each variation. The first column (i.e., #) identifies the variation. The columnFromshows the initial value for each considered threshold whereas the columnTo
shows the value that the threshold assumes after the variation has been applied. The “−” symbol in theTocolumn indicates that no variation has been made for the corresponding threshold value.
Table 14: Blob thresholds variations vs. detection vs. recall.
Variation
Detected Blobs Recall # T hmaxConnects T hmaxHwUtil
From To From To
1 5 6 90% - {} 0/4
2 5 - 90% 95% {} 0/4
3 5 4 90% - {MoviesController,MoviesCatalog} 2/4 4 5 - 90% 85% {MoviesController,BooksController} 2/4 5 5 4 90% 85% {MoviesController,MoviesCatalog, 4/4
BooksController,BooksCatalog}
By increasing T hmaxConnects from 5 to 6 and–orT hmaxHwUtil from 90% to 95% no Blobs are
decreasing one of them (i.e.,T hmaxConnectsfrom 5 to 4 orT hmaxHwUtil from 90% to 85%) a new
Blob occurrence is detected in addition to theMoviesControllercomponent, resulting in a recall of 0.5. By decreasing bothT hmaxConnectsfrom 5 to 4 andT hmaxHwUtilfrom 90% to 85% (variation #5), three new Blob occurrences in the system are detected, resulting in a recall of 1.
For each Blob occurrence blob, we applied theredeployand split refactoring actions as it follows:
−redeploy(blob,hwNode);
−split(blob,ceiling(getNumConnects(blob)/T hmaxConnects),{hwNode});
whereceiling(Float f)returns the smallest integer not less thanf,getNumConnects(Component c)
returns the number of connections of the componentc, and
hwNode=
MoviesDispatcherNode
ifblob={MoviesController,MoviesCatalog}
BooksDispatcherNode
ifblob={BooksController,BooksCatalog}
Table 15 summarizes the response times for the MakePurchase service while varying Blob thresholds in the most significative ways (i.e., #3, #4, and #5) and applying the redeployand
split refactoring actions. The table also reports corresponding precisions. In the remainder of the paper, shaded entries in tables represent beneficial refactorings, i.e., the ones that result in a response time lower or equal than 1.83 seconds.
Table 15: Blob thresholds variations vs. refactoring vs. precision.
# Average response time after Blob refactorings Precision MoviesController MoviesCatalog BooksController BooksCatalog
3 redeploy split redeploy split - - 2/2 1.98 1.83 4.47 1.66
4 redeploy split - redeploy split - 1/2
1.98 1.83 1.84 1.91
5 redeploy split redeploy split redeploy split redeploy split 2/4 1.98 1.83 4.47 1.66 1.84 1.91 1.86 1.85
Let us now focus on each row of Table15.
#3: After redeployingMoviesCatalog, an average response time of 4.47 seconds is obtained. This is the worst case because the resource demand of MoviesCatalog is too heavy for Dis-patcherMoviesNodethat already hostsMoviesDispatcherandUserController. This results in a saturation ofDispatcherMoviesNodein the refactored model and the requirement on the MakePur-chaseservice is not fulfilled.
only have 2 connections and this falsifies the clause related to the number of connections in the Blob antipattern definition. Hence, the Blob occurrence identified byMoviesCatalogis removed and the requirement on theMakePurchaseservice (1.83 seconds) is fulfilled.
The precision of variation #3 is equal to 1 because, for each detected antipattern, it exists at least a refactoring action that removes the antipattern and satisfies the requirement, i.e., thesplit
refactoring action.
#4:After redeployingBooksController, an average response time of 1.84 seconds is obtained. This response time represents an improvement with respect to the one deriving from the first redeployment action but it is not sufficient for satisfying the requirement. Anyhow, we cannot guarantee that all the nodes involved in the redeployment action have an utilization lower than the modifiedT hmaxHwUtilthreshold (i.e., 85%). Hence, we need a further performance analysis step
on the refactored model to verify if the corresponding clause in the Blob antipattern definition has been falsified.
By splittingBooksController, an average response time of 1.91 seconds is obtained. As in the case ofMoviesCatalogsplitting, we can guarantee that each component involved in the splitting action has a number of connections lower than the originalT hmaxConnectsthreshold (i.e., 5). In fact, in the refactored model, they have at most 3 connections and this number falsifies the clause related to the number of connections in the Blob antipattern definition. Hence, the Blob occurrence identified byMoviesCatalogis removed but the requirement on theMakePurchase
service (1.83 seconds) is not fulfilled.
The precision of variation #4 is equal to 0.5, because only for 1 of 2 detected antipatterns there exists at least a refactoring action that removes the antipattern and satisfies the requirement, i.e., thesplitrefactoring action applied to the antipattern identified byMoviesController.
#5:After redeployingBooksCatalog, an average response time of 1.86 seconds is obtained and we need a further performance analysis step on the refactored model to verify if the clause con-cerningT hmaxHwUtilin the Blob antipattern definition has been falsified. By splitting BooksCat-alog, the average response time is 1.85 seconds and we can guarantee the Blob removal by falsifying the clause related toT hmaxNumConnectsin the Blob antipattern definition. However, both these refactoring actions are not sufficient to satisfy the requirement on the response time of
MakePurchase(1.83 seconds).
The precision of variation #5 is equal to 0.5, because only for 2 of 4 detected antipatterns there exists at least a refactoring action that removes the antipattern and satisfies the requirement, i.e., thesplit refactoring action applied to the antipatterns identified by MoviesController and
MoviesCatalog.
B.II Impact of Concurrent Processing Systems Thresholds
Regarding the CPS antipattern, we varied T hmaxQL, initially set to 8, in the interval [5, 9],
T hmaxC puUtil in the interval[85%, 95%]starting from 90%, andT hminC puUtil in the interval[5%,
55%]starting from 50%. Such variations lead 5 CPS occurrences to emerge in the ECS4, that are (MCN,BDN), (MCN,WSN), (MCN,MDN), (BCN,BDN), and (BCN,WSN).
Table16summarizes the set of detected CPS occurrences while varying the considered thresh-olds and reports the recall for each variation.
Table 16: CPS thresholds variations vs. detection vs. recall.
Variation
Detected CPS Recall # T hmaxQL T hminC puUtil T hmaxC puUtil
From To From To From To
1 8 9 50% - 90% - {} 0/5
2 8 - 50% - 90% 95% {} 0/5
3 8 - 50% 5% 90% - {} 0/5
4 8 - 50% 55% 90%
-{(MCN,BDN), 3/5 (MCN,WSN), (MCN,MDN)}
5 8 5 50% - 90% 85%
{(MCN,BDN), 4/5 (MCN,WSN),
(BCN,BDN), (BCN,WSN)}
6 8 5 50% 55% 90% 85%
{(MCN,BDN), 5/5 (MCN,WSN), (MCN,MDN), (BCN,BDN), (BCN,WSN)}
By increasingT hmaxQLfrom 8 to 9 and–orT hmaxC puUtilfrom 90% to 95%, no CPS are detected and the recall is obviously 0. These thresholds represent upper bounds and it is useless to explore further variations in this direction. Similarly, by decreasing T hminC puUtil from 50% to 5%, no CPS are detected, thus the recall is 0. This latter threshold represents a lower bound, hence it is again useless to explore further variations.
On the contrary, while decreasing upper bound thresholds and–or increasing the lower bound threshold, we observe that the number of detected antipatterns (thus the recall too) increases. In fact, by increasingT hminC puUtilfrom 50% to 55% (i.e., variation #4), a new CPS occurrence, i.e.,
(MCN,MDN), is detected in addition to the ones detected during the first antipatterns detection step, resulting in a recall of 3/5.
Furthermore, by decreasing one or both of them (i.e.,T hmaxQLfrom 8 to 5 and–orT hmaxC puUtil
from 90% to 85%), new CPS occurrences are detected. In particular, we observe that: (i) by decreasing T hmaxQL from 8 to 5 and T hmaxC puUtil from 90% to 85% (i.e., variation #5), two new CPS occurrences, i.e., (BCN,BDN) and (BCN,WSN), are detected in addition to the ones detected during the first detection step and the recall is 4/5; (ii) by decreasingT hmaxC puUtil from
4For the sake of the readability, we use acronyms to name nodes involved in CPS occurrences:MCNfor
MoviesCon-trolNode,MDNforMoviesDispatcherNode,BCNforBooksControlNode,BDNforBooksDispatcherNode, andWSN
90% to 85% and by increasingT hminC puUtil from 50% to 55% (i.e., variation #6) at the same
time, all the five CPS occurrences are detected, resulting in a recall of 1.
For each CPS occurrence(hwNode1,hwNode2), we applied themirror andredeploy
refac-toring actions as follows:
−mirror(getCriticalComponent(hwNode1),2,{hwNode2}); −redeploy(getCriticalComponent(hwNode1),hwNode2);
wheregetCriticalComponent(Node n)is the previously defined function.
Table 17 summarizes the response times for the MakePurchase service while varying CPS thresholds in the most significative ways (i.e., #4, #5, and #6) and applying the redeployand
mirrorrefactoring actions as described. The table also reports corresponding precisions.
Table 17: CPS thresholds variations vs. refactoring vs. precision.
# Average response time after CPS refactorings
Preci-(MCN,BDN) (MCN,WSN) (MCN,MDN) (BCN,BDN) (BCN,WSN) sion 4 mirror redeploy mirror redeploy mirror redeploy - - 3/3
1.66 1.61 1.67 1.64 1.82 2.96
5 mirror redeploy mirror redeploy - mirror redeploy mirror redeploy 2/4
1.66 1.61 1.67 1.64 1.86 1.84 1.87 1.85
6 mirror redeploy mirror redeploy mirror redeploy mirror redeploy mirror redeploy 3/5
1.66 1.61 1.67 1.64 1.82 2.96 1.86 1.84 1.87 1.85
Both themirrorand theredeployrefactoring actions lead to the fulfillment of the requirement on theMakePurchaseservice, if applied to the (MCN,BDN) or (MCN,WSN) CPS occurrences. On the contrary, neither of the two applicable refactoring actions fullfill the requirement, if ap-plied to (BCN,BDN) or (BCN,WSN). Regarding the (MCN,MDN) occurrence, only themirror
refactoring action is beneficial for the requirement, whereas theredeployone leads to an average response time of 2.96 seconds, due to the resource demand of theMoviesControllercomponent that cannot be handled byMoviesDispatcherNode.
As previously stated, we need a further performance analysis step on the refactored model to verify if the clauses related toT hminC puUtil andT hmaxC puUtil in the CPS antipattern definition have been falsified after each refactoring.
In Table 17, we observe that the precision of variation #4 is equal to 1, because for each detected CPS occurrence there exists at least a refactoring action that removes the antipattern and satisfies the requirement for theMakePurchaseservice. Variation #5 has a precision equal to 0.5, because 2 of the 4 detected CPS occurrences can be removed, satisfying the requirement. Finally, although variation #6 detects all the 5 CPS occurrences in the ECS, only 3 of them are solvable in a beneficial way with respect to the requirement.
It is worth to notice that, similarly to the Blob occurrences, the best precision is achieved by the variation with the lowest recall, i.e., variation #4. Variation #4 detects exactly the three CPS whose removal leads to a response time that satisfies the requirement for theMakePurchase
B.III Aggregating Thresholds
In this section, we aggregate thresholds for the Blob and CPS antipatterns, because both the
T hmaxHwUtilof the Blob and theT hmaxC puUtilof the CPS represent upper bounds for the utilization
of hardware devices and they vary in the same interval of values (i.e., [85%, 95%]). Hence, we can unifyT hmaxC puUtiltoT hmaxHwUtiland vary the new set of aggregated thresholds as we varied thresholds by considering one antipattern at a time.
We remind that the ECS contains 4 Blob occurrences, i.e.,MoviesController,MoviesCatalog,
BooksController, andBooksCatalog, and 5 CPS occurrences, i.e., (MCN,BDN), (MCN,WSN), (MCN,MDN), (BCN,BDN), and (BCN,WSN).
Table18summarizes the set of detected Blob and CPS occurrences while varying the new set of thresholds and reports the recall for each variation.
Table 18: Blob and CPS thresholds variations vs. aggregated detection vs. aggregated recall.
Variation
Detected Blobs Detected CPS Recall # T hmaxNumConnects T hmaxQL T hminC puUtil T hmaxHwUtil
From To From To From To From To
1 5 6 8 - 50% - 90% - {} {} 0/9
2 5 - 8 9 50% - 90% - {} {} 0/9
3 5 - 8 - 50% 5% 90% - {} {} 0/9
4 5 - 8 - 50% - 90% 95% {} {} 0/9
5 5 4 8 - 50% - 90% - {MoviesController, {} 2/9 MoviesCatalog}
6 5 - 8 - 50% - 90% 85% {MoviesController, {} 2/9 BooksController}
7 5 - 8 - 50% 55% 90% - {}
{(MCN,BDN), 3/9 (MCN,WSN), (MCN,MDN)}
8 5 4 8 - 50% - 90% 85%
{MoviesController,
{} 4/9
MoviesCatalog, BooksController,
BooksCatalog}
9 5 4 8 - 50% 55% 90%
-{(MCN,BDN), 5/9 {MoviesController, (MCN,WSN),
MoviesCatalog} (MCN,MDN)}
10 5 - 8 5 50% - 90% 85%
{(MCN,BDN), 6/9 {MoviesController, (MCN,WSN),
BooksController} (BCN,BDN), (BCN,WSN)}
11 5 - 8 5 50% 55% 90% 85%
{(MCN,BDN), 7/9 (MCN,WSN), {MoviesController, (MCN,MDN), BooksController} (BCN,BDN),
(BCN,WSN)}
12 5 4 8 5 50% - 90% 85%
{MoviesController, {(MCN,BDN), 8/9 MoviesCatalog, (MCN,WSN), BooksController, (BCN,BDN), BooksCatalog} (BCN,WSN)}
13 5 4 8 5 50% 55% 90% 85%
{(MCN,BDN), 9/9 {MoviesController, (MCN,WSN),
MoviesCatalog, (MCN,MDN), BooksController, (BCN,BDN),
Table19summarizes response times for theMakePurchaseservice while varying Blob-CPS thresholds in the most significative ways (i.e., from #5 to #13) and applying themirror,redeploy, andsplitrefactoring actions as previously described5. For each antipattern occurrence, the table only reports the most beneficial refactoring actions between the three applicable ones. The table also reports corresponding precisions.
Table 19: Blob and CPS thresholds variations vs. refactoring vs. precision.
#
Average response time after Blob-CPS refactorings
Precision
Blobs CPS
MCo MCa BCo BCa (MCN, (MCN, (MCN, (BCN, (BCN, BDN) WSN) MDN) BDN) WSN)
5 split split - - - 2/2
1.83 1.66
6 split - redeploy - - - 1/2
1.83 1.84
7 - - - - redeploy redeploy mirror - - 3/3
1.61 1.64 1.82
8 split split redeploy split - - - 2/4 1.83 1.66 1.84 1.85
9 split split - - redeploy redeploy mirror - - 5/5
1.83 1.66 1.61 1.64 1.82
10 split - redeploy - redeploy redeploy - redeploy redeploy 3/6
1.83 1.84 1.61 1.64 1.84 1.85
11 split - redeploy - redeploy redeploy mirror redeploy redeploy 4/7
1.83 1.84 1.61 1.64 1.82 1.84 1.85
12 split split redeploy split redeploy redeploy redeploy redeploy - 4/8
1.83 1.66 1.84 1.85 1.61 1.64 1.84 1.85
13 split split redeploy split redeploy redeploy mirror redeploy redeploy 5/9
1.83 1.66 1.84 1.85 1.61 1.64 1.82 1.84 1.85
The precision of variations #5, #7, and #9, is equal to 1, because for each detected CPS occurrence there exists at least a refactoring action that removes the antipattern occurrence and satisfies the requirement. The variation with the highest precision among the ones that detect at least one occurrence of both the Blob an the CPS antipatterns, i.e., variation #9, is also the one with the lowest recall, i.e., 5/9, because that variation detects exactly the only two Blobs and the only three CPS whose removal leads to a response time that satisfies the requirement for the
MakePurchaseservice (1.83 seconds). Variations from #10 to #13 have a precision in the interval [0.5, 4/7], because for all detected CPS occurrences there does not exists a refactoring action that removes the antipattern occurrence and satisfies the requirement for theMakePurchaseservice.
6
Discussion
Several observations regarding the antipattern detection and refactoring derive from our experi-mentation.
Thresholds vs. antipatterns removal -If a refactoring action refers to a threshold related to a design feature (e.g., number of connections), we can ensure that its application leads to
5 For the sake of table readability, we use acronyms to name components involved in Blob occurrences: MCofor
the removal of the antipattern occurrence. On the other hand, if a refactoring action refers to a threshold related to a performance index (e.g., hardware nodes utilization or throughput, ser-vice response time, etc.), we cannot ensure that its application leads to the actual removal of the antipattern occurrence. A further performance analysis step for the refactored model is needed. For example, in Table 15 (see variation #5), we have shown that the refactoring action refer-ring to a threshold related to a performance index (i.e., redeploy) worsen (4.47 seconds) the
MakePurchaseresponse time, hence the antipattern is not actually removed. On the contrary, the refactoring action referring to a threshold related to a design feature (i.e.,split) improves (1.66 seconds) theMakePurchaseresponse time and the antipattern is actually removed.
Because the specification of some antipatterns only contains thresholds related to performance indices, we have experienced that it is more difficult to refactor such antipatterns rather than the ones referring also to design features.
Furthermore, the value of thresholds related to design features (e.g., number of connections) influences the refactoring actions to put in place to remove an antipattern. For example,T hmaxConnects
refers to the maximum number of connections for software components, thus its value induces thesplitrefactoring action to generate a specific number of new components that can be deployed according to different deployment strategies.
Recall vs. precision -In our experimentation, we found that the highest precision is achieved with thresholds values leading to the lowest recall (i.e., variation #3 in Tables14 and15, vari-ation #4 in Tables16 and17, and variation #9 in Tables18 and19). This precision is due to the set of detected antipatterns that may contain occurrences whose removal is not helpful for requirement(s) fulfillment. For example, in Tables16and17, we observe that: (i) variation #9 detects five of nine occurrences (recall = 5/9) that satisfy the requirement (precision = 1); (ii) variation #13 detects all the nine occurrences (higher recall, equal to 1), but the new ones are not beneficial (lower precision, equal to 5/9).
Restrictions in refactoring applicability -The application of refactorings can be restricted by functional or non-functional requirements. Example of functional requirements may be legacy components that might restrict the set of applicable refactoring actions. In our example, let us suppose thatMoviesController cannot be refactored because it is a legacy component, then the
splitaction on that component cannot be applied anymore and we can only apply theredeploy
action, that does not result in a requirement fulfillment. Example of non-functional requirements may be budget limitations that do not allow to adopt an antipattern solution due to its extremely high cost. Many other examples can be provided of requirements that (implicitly or explicitly) may affect the antipattern solution activity.
7
Conclusion
In this paper, we have analyzed the influence of numerical thresholds on the capability and effec-tiveness of detecting and refactoring performance antipatterns. In particular, we have defined the recall and precision of detection rules and refactoring actions respectively and we have applied them to a case study in the e-commerce domain.
characteristics could be also exploited for this goal, because they may have an impact on thresh-old values.
We also intend to introduce confidence values that may be associated to antipattern occur-rences to quantify the probability that numerical threshold values support the actual antipattern presence. Furthermore, some fuzziness can be introduced for the evaluation of the threshold values [Mar04,OKAG10,SCK02] thus to make antipattern detection rules more flexible.
Acknowledgements: This work has been partially supported by the European Office of Aero-space Research and Development (EOARD), Grant/Cooperative Agreement (Award no. FA8655-11-1-3055), and by the VISION European Research Council Starting Grant (ERC-240555).
Bibliography
[AC13] D. Arcelli, V. Cortellessa. Software model refactoring based on performance anal-ysis: better working on software or performance side? In Buhnova et al. (eds.),
FESCA. EPTCS 108, pp. 33–47. 2013.
[ACT12] D. Arcelli, V. Cortellessa, C. Trubiani. Antipattern-based model refactoring for soft-ware performance improvement. In ACM SIGSOFT International Conference on Quality of Software Architectures (QoSA). Pp. 33–42. 2012.
[BDC02] M. Bernardo, L. Donatiello, P. Ciancarini. Stochastic Process Algebra: From an Al-gebraic Formalism to an Architectural Description Language. InPerformance Eval-uation of Complex Systems: Techniques and Tools, Tutorial Lectures, Performance. Pp. 236–260. 2002.
[BDIS04] S. Balsamo, A. Di Marco, P. Inverardi, M. Simeoni. Model-Based Performance Pre-diction in Software Development: A Survey.IEEE Trans. Software Eng.30(5):295– 310, 2004.
[BKR09] S. Becker, H. Koziolek, R. Reussner. The Palladio component model for model-driven performance prediction.Journal of Systems and Software82(1):3–22, 2009.
[CDDT12] V. Cortellessa, M. De Sanctis, A. Di Marco, C. Trubiani. Enabling Performance Antipatterns to arise from an ADL-based Software Architecture. In Joint Confer-ence on Software Architecture and European ConferConfer-ence on Software Architecture, WICSA/ECSA. 2012.
[CDE+10] V. Cortellessa, A. Di Marco, R. Eramo, A. Pierantonio, C. Trubiani. Digging into UML models to remove performance antipatterns. In ICSE Workshop Quovadis. Pp. 9–16. 2010.
[CM02] V. Cortellessa, R. Mirandola. PRIMA-UML: a performance validation incremental methodology on early UML diagrams.Sci. Comput. Program.44(1):101–129, 2002.
[CMI11] V. Cortellessa, A. D. Marco, P. Inverardi.Model-Based Software Performance Anal-ysis. Springer, 2011.
[CS11] G. Casale, G. Serazzi. Quantitative system evaluation with Java modeling tools. In
Proceedings of the 2nd ACM/SPEC International Conference on Performance engi-neering. ICPE ’11, pp. 449–454. ACM, New York, NY, USA, 2011.
doi:10.1145/1958746.1958813
http://doi.acm.org/10.1145/1958746.1958813
[FB92] W. B. Frakes, R. Baeza-Yates (eds.).Information retrieval: data structures and al-gorithms. Prentice-Hall, Inc., Upper Saddle River, NJ, USA, 1992.
[HT07] M. Harman, L. Tratt. Pareto optimal search based refactoring at the design level. In
Proceedings of the 9th annual conference on Genetic and evolutionary computation. GECCO ’07, pp. 1106–1113. ACM, New York, NY, USA, 2007.
doi:10.1145/1276958.1277176
http://doi.acm.org/10.1145/1276958.1277176
[Jai91] R. Jain. The Art of Computer Systems Performance Analysis: Techniques for Ex-perimental Design, Measurement, Simulation, and Modeling.SIGMETRICS Perfor-mance Evaluation Review19(2):5–11, 1991.
doi:http://doi.acm.org/10.1145/122564.1045495
[KPGA12] F. Khomh, M. D. Penta, Y.-G. Gu´eh´eneuc, G. Antoniol. An exploratory study of the impact of antipatterns on class change- and fault-proneness.Empirical Software Engineering17(3):243–275, 2012.
[KVGS11] F. Khomh, S. Vaucher, Y.-G. Gu´eh´eneuc, H. A. Sahraoui. BDTEX: A GQM-based Bayesian approach for the detection of antipatterns.Journal of Systems and Software
84(4):559–572, 2011.
[LKGS84] E. Lazowska, J. Kahorjan, G. S. Graham, K. Sevcik.Quantitative System Perfor-mance: Computer System Analysis Using Queueing Network Models. Prentice-Hall, Inc., 1984.
[Mar04] R. Marinescu. Detection Strategies: Metrics-Based Rules for Detecting Design Flaws. InInternational Conference on Software Maintenance (ICSM). Pp. 350–359. 2004.
[MGDM10] N. Moha, Y.-G. Gu´eh´eneuc, L. Duchien, A.-F. L. Meur. DECOR: A Method for the Specification and Detection of Code and Design Smells.IEEE Trans. Software Eng.
[MKBR10] A. Martens, H. Koziolek, S. Becker, R. Reussner. Automatically improve software architecture models for performance, reliability, and cost using evolutionary algo-rithms. In WOSP/SIPEW International Conference on Performance Engineering. Pp. 105–116. 2010.
[MPN+12] N. Moha, F. Palma, M. Nayrolles, B. J. Conseil, Y.-G. Gu´eh´eneuc, B. Baudry, J.-M. J´ez´equel. Specification and Detection of SOA Antipatterns. InInternational Confer-ence on Service-Oriented Computing (ICSOC). Pp. 1–16. 2012.
[Obj05] Object Management Group (OMG). UML 2.0 Superstructure Specification. 2005. OMG Document formal/05-07-04.
[Obj09] Object Management Group (OMG). UML Profile for MARTE. 2009. OMG Docu-ment formal/08-06-09.
[OC08] M. O’Keeffe, M. ´ı Cinn´eide. Search-based refactoring for software maintenance.J. Syst. Softw.81(4):502–516, Apr. 2008.
doi:10.1016/j.jss.2007.06.003
http://dx.doi.org/10.1016/j.jss.2007.06.003
[OKAG10] R. Oliveto, F. Khomh, G. Antoniol, Y.-G. Gu´eh´eneuc. Numerical Signatures of An-tipatterns: An Approach Based on B-Splines. InEuropean Conference on Software Maintenance and Reengineering (CSMR). Pp. 248–251. 2010.
[PZ12] R. Peters, A. Zaidman. Evaluating the Lifespan of Code Smells using Software Repository Mining. InEuropean Conference on Software Maintenance and Reengi-neering (CSMR). Pp. 411–416. 2012.
[RRPK12] D. Romano, P. Raila, M. Pinzger, F. Khomh. Analyzing the Impact of Antipatterns on Change-Proneness Using Fine-Grained Source Code Changes. InWorking Con-ference on Reverse Engineering (WCRE). Pp. 437–446. 2012.
[SCK02] S. S. So, S. D. Cha, Y. R. Kwon. Empirical evaluation of a fuzzy logic-based soft-ware quality prediction model.Fuzzy Sets Syst.127(2):199–208, Apr. 2002.
doi:10.1016/S0165-0114(01)00128-2
http://dx.doi.org/10.1016/S0165-0114(01)00128-2
[Smi07] C. U. Smith. Introduction to Software Performance Engineering: Origins and Out-standing Problems. In Bernardo and Hillston (eds.), SFM. Lecture Notes in Com-puter Science 4486, pp. 395–428. Springer, 2007.
[SSB06] O. Seng, J. Stammel, D. Burkhart. Search-based determination of refactorings for improving the class structure of object-oriented systems. In Proceedings of the 8th annual conference on Genetic and evolutionary computation. GECCO ’06, pp. 1909–1916. ACM, New York, NY, USA, 2006.
doi:10.1145/1143997.1144315
[SW03] C. U. Smith, L. G. Williams. More New Software Antipatterns: Even More Ways to Shoot Yourself in the Foot. InInternational Computer Measurement Group Confer-ence. Pp. 717–725. 2003.
[TK11] C. Trubiani, A. Koziolek. Detection and solution of software performance antipat-terns in palladio architectural models. InInternational Conference on Performance Engineering (ICPE). Pp. 19–30. 2011.
[TSFB99] G. Travassos, F. Shull, M. Fredericks, V. R. Basili. Detecting defects in object-oriented designs: using reading techniques to increase software quality. In ACM SIGPLAN conference on Object-oriented programming, systems, languages, and ap-plications. Pp. 47–56. 1999.
[WFP07] C. M. Woodside, G. Franks, D. C. Petriu. The Future of Software Performance En-gineering. In Briand and Wolf (eds.),FOSE. Pp. 171–187. 2007.
[Xu12] J. Xu. Rule-based automatic software performance diagnosis and improvement. Per-form. Eval.69(11):525–550, 2012.