Research Article
a
October
2017
Computer Science and Software Engineering
ISSN: 2277-128X (Volume-7, Issue-10)
Quality of Service Issues in Wireless Voice over Internet
Protocol
Oladunni Abosede Daramola
Department of Computer Sciences, The Federal University of Technology, Akure, Nigeria
Abstract: Voice over Internet Protocol (VoIP) is a significant application of the converged network principle where the voice traffic is routed over Internet Protocol shared traffic networks. VoIP traffic was modelled over wireless network and a simulation of the traffic was transmitted over the network.E-model technique was used to analyzethe traffic dataand also to rate VoIP QoSparameters. The result achieved was mapped to the Mean Opinion Scale to determine the Quality of Service of VoIP over wireless networks. The results shows that QoS in the VoIP communications is significantly impacted by these parameters and the impact varies according to the parameters and also the communication aspects selected for the VoIP traffic analysis.
Keywords: VoIP, QoS, Wireless, E-Model and Mean Opinion Scale
I. INTRODUCTION
Voice over Internet Protocol, also referred to as VoIP or Internet telephony or IP telephony, is a technology that facilitates routing of voice conversations over the Internet or any IP-based network instead of traditional telephone networks that uses Circuit Switched networks [1].Voice over IP uses packet switched networks which allows the transmission of data in small blocks, called Packets. Packet Switching allows the transmission of multiple calls to make use of the space used by only one call in circuit switched networks. VoIP converts analog audio signals into digital audio signals to allow for the transmission over the internet. Interconnected VoIP services also allow the making and receiving of calls to and from traditional landline numbers, some VoIP services require a computer or a dedicated VoIP phone, while others allow the use of land phones to place VoIP calls through a special adapter([1],[2]).
Quality of Service (QoS), refers to the capability of a network to provide managed bandwidth and better service to preferential network traffic. It is also a set of techniques used to manage network resources to assure that delay-sensitive information travels the network in a timely manner [3]. For VoIP, Quality of Service means prioritizing voice packets over the network to avoid delay and packet loss. It is possible to configure the hardware and software on one's network to achieve more predictable service by: supporting dedicated bandwidth, avoiding and managing network congestion, shaping network traffic. Quality of Service also provides reliability and predictability, eliminates poor quality voice transmission, together with missing syllables and crackles that relinquish the call satisfactory [3].
In Wireless VoIP system, voice streams sometimes have to traverse wireline networks before they reach the access point, which is the conjunction point of a wireline network and the wireless channel. As the voice packets are sent over IP networks, they incur variable delay and possibly loss. There are many correlated impairment factors that may seriously affect the quality of service of Wireless VoIP. From literature, the main impairment factors are packet losses, bit errors, end-to-end delays, jitters and coding ([4],[5]).Despite its costs saving benefits, providing acceptable quality of service is the key for the success of VoIP service. The speech quality of VoIP in wireless/mobile IP networks is more aggravated, because of the unreliability of wireless channel performance and the uncertainty of the mobility of wireless handsets. This paper analyzes the QoS of VoIP calls in a wireless network environment with the aim of determining the effect of some parameters on the VoIP Quality of Service.
II. VoIP AND ITS APPLICATION IN WIRELESS INTERNET VoIP can be achieved using any of the following:
i. COMPUTER-TO- COMPUTER - The requirements include, an internet connection, soundcard, microphone, speakers, and software.
ii. TELEPHONE-TO-TELEPHONE - Using gateways, VoIP users using a telephone can connect through the IP-based network with another telephone in the world.
ISSN(E): 2277-128X, ISSN(P): 2277-6451, pp. 57-64
iv. COMPUTER-TO-TELEPHONE - VoIP users can call a telephone from a computer. The requirements include an internet connection and a software on the computer.
The protocol stack of transmitting VoIP traffic in wireline and wireless network is presented in the Figure below.
Application Layer
Transport Layer
Network Layer
Data Link Layer
Figure 1: VoIP Protocol Architecture [6].
RTP provides a way to deliver delay-sensitive real-time data. The services provided by RTP include payload type identification; sequence numbering; timestamping and delivery monitoring. RTP Applications typically runs on top of UDP, which does not guarantee Quality of Service (QoS) but requiring lower overhead. RTCP (Real-time Control Protocol) is the control protocol associated with RTP. RTCP monitors the quality of service and conveys information about the participants in an on-going session. After voice sample is compressed and digitized, then it is packed as the payload of an IP packet, along with an IP address for the purposes of routing in IP networks. In the data link layer, IP packets with speech data are encapsulated in frames and supported by IEEE 802.3 or 802.11 for wireline network and wireless network respectively. Both of these link layer protocols provide services such as framing, error control, flow control [6].All these processes of digital transmitting of voice impact greatly on the quality of the received voice, this work presents an analysis of the performance of VoIP, the Analysis involves the identification of the QoS parameters relevant to VoIP communications.
III. QoS MEASUREMENTS
Measurement methods of telecommunication networks can be divided into probing, tracing and monitoring, each of these methodscan be classified aspassiveand/or active. Tracing is an active measurement and the essence is usually to find out the performance of a certain route hop by hop. Monitoring, on the other hand is passive, where information about the existing network traffic passing through some nodes is collected. Probing can be either active or passive. The Active probing measures the effects of specially generated test flows while the passive probing collects information about the effects of existing network traffic [7].The basic idea of QoS measurements is illustrated in the Figure below.
Figure 2: The basic principle of QoS measurements [13] RTP RTCP
UDP
IP
IEEE 802.3 IEEE 802.11X
Measurement point (Network node) QoS real time monitor
or database
Measurement point (Network node)
Traffic measurement tool
Traffic measurement tool
ISSN(E): 2277-128X, ISSN(P): 2277-6451, pp. 57-64
IV. WIRELESS VOIP DESIGN AND ANALYSIS
In this work, a wireless VoIP environment was set up in order to monitor the traffic and collect data for the QoSmeasurements.To set up the wireless VoIP environment, the following tools and technologies were employed
i. X-Lite: Is a proprietary freewareVoIPsoft phone that uses the Session Initiation Protocol (SIP).The X-Lite was installed on the system and used to make VoIP calls.
ii. 3CX IP PBX: Is a Windows based software PBX (Private Branch eXchange) that offers a vast assortment of customizable options and settings. It was also installed on the system that serves as the server so as to initiate and end call sessions.
iii. Wireless Access Point (Radio): Wireless access points (APs or WAPs) are specially configured nodes on wireless local area networks (WLANs). Access points act as a central transmitter and receiver of WLAN radio signals.
iv. Switch.
v. Power over Ethernet (PoE) Hub.
vi. .NET Framework: Platform on which the 3CX IP PBX software is installed.
To evaluate the quality of service of the designed wireless VoIP system, Wireshark was used. Wireshark is a software that understands the structure of different networking protocol i.e. it analyses the network and tells what protocol runs more on the network. It allows the user to see the data travelling across the network, all the traffic on the network and also what ports a program is using. Wireshark has sophisticated wireless protocol analysis support to help administrators troubleshoot wireless networks. With the appropriate driver support, Wireshark can capture traffic and decode it into a format that helps to track down issues that are causing poor performance, intermittent connectivity, and other common problems.
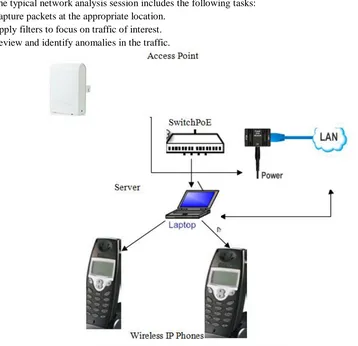
The typical network analysis session includes the following tasks: i. Capture packets at the appropriate location.
ii. Apply filters to focus on traffic of interest. iii. Review and identify anomalies in the traffic.
Figure 3: The Wireless VoIP System Architecture.
To set up a wireless VoIP network, a wireless network and a telephony system are setup
A. Wireless Network Design Setup
ISSN(E): 2277-128X, ISSN(P): 2277-6451, pp. 57-64
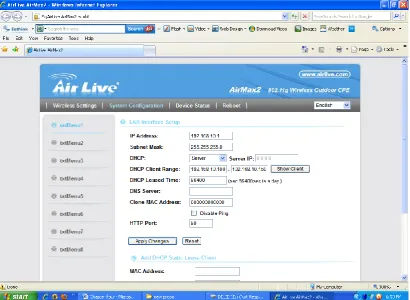
The access point is configured (usually via a web browser)to been seen by the existing network. The client computers are configured with the appropriate network settings required to be able to communicate with the access point.
Figure 4: Configuration of the Access Point.
Figure 5: Assigning of IP address to the Access Point.
B. Wireless VoIP System Design Setup:
ISSN(E): 2277-128X, ISSN(P): 2277-6451, pp. 57-64
callsan accountis created on the phone. The "Authorization user name" and "Password" is required for authentication with the SIP server. At this point, the SIP server is started up if it is not already running, the phone will attempt to register the server. A successfully registered phone says "Ready" in the window’.
V. ANALYZING VoIP CALLS
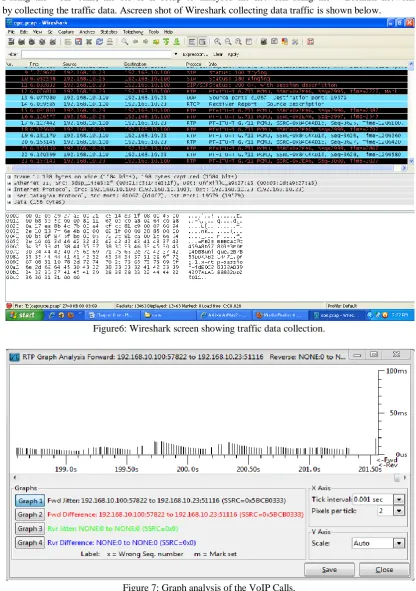
During the VoIP calls, the server is setup to analyses the network using the Wireshark network protocol analyzer by collecting the traffic data. Ascreen shot of Wireshark collecting data traffic is shown below.
Figure6: Wireshark screen showing traffic data collection.
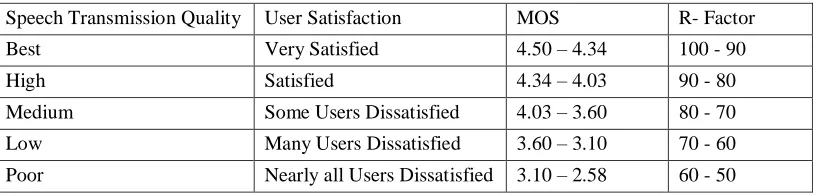
Figure 7: Graph analysis of the VoIP Calls.
VI. QoS EVALUATIONS
ISSN(E): 2277-128X, ISSN(P): 2277-6451, pp. 57-64
to 5 (excellent) as presented in Table 1. There are number of measurements methods available to measure quality of service of a VoIP system. Basically, quality of service measurements can be divided into two categories namely, Subjective measurements and Objective measurements [14],[15]. Subjective quality of service measurement requires a large group of people involved to attend the test. It is timeconsuming, unrepeatable and expensive. Objective tests are repeatable, automatic and do not suffer from environment effects compared with subjective tests.
The most popular objective measurements are Perceptual Evaluation of Speech Quality (PESQ) and E-model. PESQ is also categorized as a kind of intrusive speech quality measurement, as it requires the original speech signal with the degraded one to perform the quality evaluation. PESQ does not consider the effect of delay on voice communications and neither MOS nor PESQ can be used for real-time on-line quality estimation [8]. E-model is categorized as one of the non-intrusive speech quality measurement, as it is parameter-based and does not require help or original speech signal.
Table 1 Mean Opinion Scale [12].
The E-Model is a computational model, standardized by ITU-T. It uses transmission parameters to predict the subjective speech quality of packetized voice. E-Model has proven to be useful as a transmission-planning tool, for assessing the combined effects of variations in several transmission parameters that affect conversational quality of telephony. The primary output from the E- Model is the "Rating Factor" R, and R can be further transformed to give estimates of customer opinion by mapping it to the MOS scale.
The E-Model Equation for “Rating Factor” is
R = R0 – Id – Is – Ie + A
This equation results in an R factor between 0 and 100. The components of R are: R0 base R value (noise level); Id, representing the effects of impairments occurring simultaneously with the speech signal; Is, representing the effects of impairments occurring simultaneously with the speech signal; Ie, representing the effects of "equipment” such as DCME or Voice over IP networks; A, the advantage factor, used to compensate for the allowance users make for poor quality when given some additional convenience (e.g. 0 for wireline and 10 for GSM).
The E-model is an analytic model defined in the ITU-T recommendations it provides a framework for an objective on-line quality estimation based on network performance measurements (e.g., delay and loss) and application level factors (e.g., low bit rate codecs). The result of the E-model is the calculation of the R-factor (ranging from a best case of 100 to a worst case of 0) [9].
VII. E-MODEL IMPLEMENTATION
The E-Model is a well-established voice transmission quality prediction and measurement model for telephone networks. It provides an objective method of assessing the end-to-end transmission quality of a telephone connection and is intended to assist telecommunication service providers with network planning and performance monitoring [8].The primary output of the Model calculations is a quality rating value known as R (Transmission Rating Factor). The E-Model is based on a mathematical algorithm, with which the individual transmission parameters are transformed into different individual "impairment factors" that are assumed to be additive on a psychological scale. The result of the E-model is the calculation of the R-factor (ranging from a best case of 100 to a worst case of 0). R is given by the equation [10]
R = R0- Is - Id - Ie+ A ………. (1)
Where R0 groups the effects of noise, Isincludes the effect of other impairments related to the quantization of the
voice signal, Idrepresents the impairment caused by delay, Ie covers the impairments caused by low bit rate codecs and
packet losses. The advantage factor A compensates for the above impairments under various user conditions. For mobile telephony Ais given to be 10 and is 0 in the case of VoIP. The R-factor can be further translated into MOS scale through this expression:
MOS = 1 + 0.035R + 7*10-6R(R - 60) (100 - R) ……….. (2)
The Table below shows the quality classes and corresponding values of Mean Opinion Score (MOS) and R-factor. Quality Scale Score Listening Effort Scale
Excellent 5 No effort required
Good 4 No appreciable effort required
Fair 3 Moderate effort required
Poor 2 Considerable effort required
ISSN(E): 2277-128X, ISSN(P): 2277-6451, pp. 57-64
Table 2 Speech transmission quality and correspondent MOS and rating factor R values Source: [11].
Speech Transmission Quality User Satisfaction MOS R- Factor
Best Very Satisfied 4.50 – 4.34 100 - 90
High Satisfied 4.34 – 4.03 90 - 80
Medium Some Users Dissatisfied 4.03 – 3.60 80 - 70
Low Many Users Dissatisfied 3.60 – 3.10 70 - 60
Poor Nearly all Users Dissatisfied 3.10 – 2.58 60 - 50
From the wireshark analysis above the following parameters are obtained as follows: Ro - 87.69
Id – 9.62ms Is – 9.36ms
Ie - Codecs impairment and Packet loss impairments. The Codec used here is G.711 and it has a value of 0 (ITU-T (2004)). That is Ie= 0 + 0.01ms
A– 0 (for VoIP)
Therefore, R = 87.69 – 9.62 – 9.36 – 0.01 R = 68.70.
From the value of R obtained, the value of MOS is computed using equation (2) MOS = 1 + 0.035(68.70) + 7 * 10-6 * 68.70(68.70 – 60) (100 – 68.70)
MOS = 1 + 2.4045 + 7 * 10-6 * 68.70 (8.70) (31.30) MOS = 3.4045 + 7 * 10-6 * 18946.773
MOS = 3.4045 + 0.000007 * 18946.773 MOS = 3.4045 + 0.1326274
MOS = 3.5371274.
The MOS obtained above can be approximated to 3.54 and using table 2 above, this indicates that the VoIP calls made and analyzed is of Medium Speech Transmission quality and it indicates that some users are dissatisfied with its quality.
VIII. CONCLUSIONS AND RECOMMENDATIONS
Quality of Service is crucial for the success of Wireless VoIP, the impairment factors to the quality of service of a Wireless VoIP system can be summarized as packet loss, end-to-end delay, jitter, bit error andcoding. Here, voice calls was made using soft phones(X-lite) installed on systems in a wireless network to analyze the quality of service parameters. E- Model allows the prediction of VoIP calls quality by obtaining the value of the R-factor from the impediment parameters and the mapping it to the MOS Scale.The provision of voice services with guaranteed quality is one of the basic requirements which the communications networks realizing VoIP should meet. In addition, end user needs should be satisfied for various types of services.Someadditionaleducation on quality of service issues may also be required for Organizations that use VoIP. The training will provide a thorough understanding of voice quality issues and how impairments can be eliminated.
REFERENCES
[1] Rahul C. Vaidya and S.S. Kulkarni (2012) “Voice over IP Mobile Telephony Using WIFI“ International Journal of Scientific & Engineering Research Volume 3, Issue 12, December-2012
[2] Kuhn M., “UNDERSTANDING VOICE OVER IP”
URL:http//www.compassconsulting.com/articles/voipintro.html. Date accessed (7 April. 2011).
[3] Shenker, S., Patridge,C., Guerin, R. (1997) “ Specification of Guaranteed Quality of Service.”. URL:ftp//ftp.rfc-editor.org/in-notes/rfc2212.txt Date accessed (14 March 2011).
[4] Bellalta B., (2007) Flow-level QoS guarantees in IEEE 802.11e EDCA-based WLANs. PhD Thesis, UniversitatPompeuFabra.
[5] Hoene C., Carreras I., Wolisz A., (2001), Voice over IP: Improving the Quality over Wireless LAN by Adopting a Booster Mechanism – An Experiment Approach. Proc. SPIE - Voice over IP (VoIP) Technology, pp. 157- Denver, Colorado, USA.
ISSN(E): 2277-128X, ISSN(P): 2277-6451, pp. 57-64
[7] Paxson V, “Measurements and Analysis of End-to-End Internet Dynamics,” Ph.D. dissertation, University of California, Berkeley, 1997
[8] Clark A. D., (2003) Modeling the Effects of Burst Packet Loss and Recency on Subjective Voice Quality. IPtel Workshop.
[9] ITU-T (2004) E-Model Tutorial.
[10] ITU-T (2006) ITU-T Recommendation G.107: The E-model, a computational model for use in transmission planning.
[11] ITU-T (1999) Recommendation G.109: Definition of categories of speech transmission quality. [12] ITU-T (2003b) ITU-T Recommendation P.800.1: Mean Opinion Score (MOS) Terminology.
[13] END TO END QOS: “Challenges and Practical Solutions.” (http://www.riverstonenet.com/pdf/qos.pdf). Date Accessed (5 May, 2011).
[14] Li Z., Sun L., Qiao Z. and Ifeachor E., (2003). Perceived Speech Quality Driven Retransmission Mechanism for Wireless VoIP, Proc. IEE 3G pp395-399, London, UK.
[15] Manner J., (2003) “Provision of Quality of Service in IP-based Mobile Access Networks”,
![Figure 1: VoIP Protocol Architecture [6].](https://thumb-us.123doks.com/thumbv2/123dok_us/7812050.2086236/2.595.86.421.128.242/figure-voip-protocol-architecture.webp)