THE CHANGING SPATIAL EPIDEMIOLOGY OF MALARIA IN THE DEMOCRATIC REPUBLIC OF THE CONGO
Molly Deutsch-Feldman
A dissertation submitted to the faculty at the University of North Carolina at Chapel Hill in partial fulfillment of the requirements for the degree of Doctor of Philosophy in the Department
of Epidemiology.
Chapel Hill 2020
Approved by: Steven Meshnick Jessie Edwards Michael Emch
Emily Gower Jonathan Juliano
Ó 2020
ABSTRACT
Molly Deutsch-Feldman: The Changing Spatial Epidemiology of Malaria in the Democratic Republic of the Congo
(Under the direction of Steven R. Meshnick and Emily W. Gower)
Malaria remains a significant public health problem worldwide, and especially in the Democratic Republic of the Congo (DRC), where approximately 12% of global cases occur. Despite this burden, very few national malaria studies have been conducted in the DRC, particularly amongst adults. Because of this, critical questions, such who is at highest risk and where transmission is highest, remain under-studied. This information is needed to tailor
interventions to individuals and areas in which they will be most effective. We aimed to fill this gap in the literature using data from the population based, nationally-representative Demographic and Health Surveys (DHS) conducted in the DRC.
Overall, this dissertation highlights the high prevalence of infections amongst adults and the need for massively scaled up malaria control efforts. The findings identify individuals and areas that most need attention. These findings will help the DRC Ministry of Health plan future malaria control programs and help ensure that such programs are maximally effective. This dissertation also underscore the importance of studying malaria amongst individuals of all ages.
ACKNOWLEDGEMENTS
There are, of course, many people to thank. No one makes it through a PhD program alone. First, to my advisors, Steve and Emily. Steve, you were the first person at UNC that I ever spoke to and the reason that I came to Gillings. You have supported me and my goals since day one and for that, I cannot thank you enough. Emily, thank you for all your invaluable guidance and insights and helping me get to an actual finished dissertation. To the rest of my committee, Bob, Jess, Jon, and Mike, you are all wonderful people. I truly enjoyed working with you all and learning from you. I could not have asked for a better committee.
Throughout my time at UNC I have had the honor of being a part of the Infectious Disease Epidemiology and Ecology Lab (IDEEL). Every person in IDEEL, both in Chapel Hill and in the DRC, has at some point provided help or answered questions or even let me eat lunch in their office so I didn’t have to eat in the lab. I can only hope that in the future I find a group like IDEEL, one that chooses to go on a BYOB pirate cruise (in full pirate costumes) an hour before we are all supposed to be at an academic conference.
further away from you, has helped me more than I can ever say. Noa, thank you for putting up with me for three whole years and being such a wonderful roommate, one who watches The Bachelor with me both ironically and non-ironically. And to Clark – thank you for always listening to me when I needed to rant, calming me down when I was ready to drop out, and providing me with copious amounts of cheese and chocolate.
TABLE OF CONTENTS
LIST OF TABLES……….ix
LIST OF FIGURES………x
LIST OF ABBREVIATIONS………xi
CHAPTER ONE: SPECIFIC AIMS ………..1
CHAPTER TWO: BACKGROUND AND INNOVATION 2.1 Malaria Overview………...4
2.2 Global Burden of Malaria………...5
2.3 Malaria Interventions………..7
2.4 Spatial Epidemiology of Malaria………..10
2.5 Urbanization and Malaria………..11
2.6 Malaria in the DRC………....12
2.7 Risk Factors for Malaria in the DRC……….16
2.8 Interventions in the DRC………...17
2.9 Overview of Spatial Modeling………..18
2.10 Innovation ………...…..19
CHAPTER THREE: SPATIAL AND EPIDEMIOLOGICAL DRIVRES OF P. FALCIPARUM MALARIA AMONGST ADULTS IN THE DEMOCRATIC REPUBLIC OF THE CONGO 3.1 Introduction………....21
3.3 Results………..……..28
3.4 Discussion………..33
3.5 Conclusion ………....38
CHAPTER FOUR: INCREASED PATENT MALARIA IN THE DRC: GEOGRAPHIC AND EPIDEMIOLOGIC CHANGES FROM 2007 TO 2013-2014 4.1 Introduction ………...43
4.2 Methods ……….…....45
4.3 Results ………...51
4.4 Discussion ………...54
4.5 Conclusion………...58
CHAPTER FIVE: CONCLUSION 5.1 Review of Aims………...62
5.2 Conclusions ……….…………...63
5.3 Future Directions ………...…..…….65
APPENDIX A: CHAPTER THREE SUPPLEMENTARY MATERIALS………...68
APPENDIX B: CHAPTER FOUR SUPPLEMENTARY MATERIALS……..………….……..77
APPENDIX C: COMPARISON OF PREVALENCE ESTIMATES AMONGST ADULTS VERSUS CHILDREN IN THE 2013-2014 DHS.………..88
LIST OF TABLES
Table 2.1: Previously identified risk factors for malaria in the DRC ………...16 Table 3.1: Descriptive statistics of the study population by P. falciparum PCR status…………39 Table 3.2: Risk factor analysis results..……… ………....41 Table 4.1: Description of individuals included in the 2007 and 2013-2014 DHS Surveys …...59 Table 4.2: Proportion of pregnant women with patent infections by IPTp status in 2007
and 2013…….………...…60 Table 4.3: Results of territory-level multilevel models of LLIN use on change in patent
LIST OF FIGURES
Figure 2.1: 2016 global distribution of malaria worldwide……….……6
Figure 2.2: Estimated changes in malaria prevalence (as detected using RDTs) between 2000-2015 amongst children ages 2-10 ………...……….……7
Figure 2.3: PCR-detectable malaria prevalence estimates from 2007 amongst adults in the DRC….………..………14
Figure 2.4: Map of epidemiologic zones in the DRC………15
Figure 3.1: Sites of 2013-2014 DHS sampling clusters……….29
Figure 3.2: Flowchart of samples included in analysis………..29
Figure 3.3: Map of predicted P. falciparum PCR prevalence estimates.………...…………30
Figure 3.4: Results of the analysis comparing risk factor effects between urban versus rural areas…….………32
Figure 3.5: Effect of individual bed-net use by cluster-level malaria prevalence……….……….……….……….………....33
Figure 4.1: Sampling locations from the 2007 (left) and 2013-2014 (right) Demographic and Health Surveys………..………....48
Figure 4.2: Map of the territories within the DRC. ………...48
Figure 4.3: Map of patent infection prevalence in 2007 (left) and 2013 (right).………...52
LIST OF ABBREVIATIONS ACCM all-cause child mortality
CAR conditional auto-regressive DIC deviance information criteria DHS Demographic and Health Survey DRC Democratic Republic of the Congo ITN insecticide treated nets
IPTi Intermittent preventative therapy for infants IPTp Intermittent preventative therapy during pregnancy IRS Indoor residual spraying
LLIN long-lasting insecticide treated net LOD limit of detection
MAP Malaria Atlas Project MIP molecular inversion probe MOH Ministry of Health
PCA principal components analysis PCR polymerase chain reaction PMI President’s Malaria Initiative RDT rapid diagnostic test
SANRU Santé Rural
CHAPTER ONE: SPECIFIC AIMS:
Malaria remains a significant public health problem in the Democratic Republic of the Congo (DRC), with an estimated 25 million cases in 20181. Despite this burden, there have been very few national malaria studies conducted in the DRC, particularly amongst adults. Because of this, critical questions, such as who is at highest risk and where transmission is highest, remain under-studied. This information is needed to tailor interventions to individuals and areas in which they will be most effective. The objective of this study is to answer these questions using nationally representative data.
A comprehensive multi-level risk factor analysis for malaria infection in the DRC is needed in order to identify individuals who are at a higher risk for infection. No group has assessed risk factors for infection amongst adults in the DRC since the 2007. Several recent studies have demonstrated associations between various community-level factors and malaria risk amongst children in the DRC2,3. Thus, determining larger scale risk factors is critical for understanding malaria epidemiology, and an important part of creating intervention policies. Additionally, as several studies from across the world have demonstrated that malaria transmission dynamics differ between urban and rural areas, comparing risk factors between the two settings is another important element of targeting prevention efforts to be most effective4.
Health Surveys (DHS) Program indicate that the national prevalence of malaria amongst adults remained steady from 2007 to 2013, the longitudinal differences in prevalence were highly variable across the country. Some provinces experienced a drop in prevalence since 2007 while others exhibited an increase. Understanding how and why these patterns of transmission are changing over time is necessary for identifying regions most in need of interventions. No studies have comprehensively investigated how the geographic distribution of malaria infection amongst adults has changed since in the past decade or linked these changes in malaria prevalence with intervention implementation.
To address these gaps in knowledge we have formulated two Specific Aims for this study:
Specific Aim 1: A) Determine individual and cluster-level risk factors for Plasmodium falciparum infection amongst adults living in the DRC and B) evaluate whether the effects of these risk factors are modified by urban/rural settings. Data will be derived from the 2013 DHS. Plasmodium falciparum infection will be determined using a pfldh PCR assay. We will use the DHS data to build a multi-level model and estimate individual and community-level risk factors such as education or wealth index. Additionally, we will include the cluster-level proportion of drug resistant infections, determined by genetic sequencing, as a potential risk factor. Risk factors identified by this model will then be further assessed for modification by comparing strata specific risk estimates for both urban and rural areas (as designated in the DHS).
Specific Aim 2: A) Compare the spatial distribution of patent Plasmodium falciparum
malaria between 2007 and 2013 amongst adults in the DRC B) Assess the effects of
both the 2007 and the 2013 DHS, we will compare the prevalence and spatial distribution of patent Plasmodium falciparum infections (at least 100 parasites per uL of blood) amongst adults over time. We will create risk maps to identify whether province level prevalence increased or decreased between 2007 and 2013. Additionally, we will determine the effect of two malaria interventions, insecticide treated bed-nets and intermittent preventative therapy during
pregnancy, with increasing or decreasing malaria prevalence between the two survey time points using geospatial Bayesian modeling.
This proposal is innovative as it utilizes epidemiologic, genetic, and spatial data to determine risk factors for malaria infection. Additionally, it is the first study, to our knowledge, to evaluate longitudinal changes in national malaria prevalence amongst adults in the DRC, and to link these changes to specific interventions.
CHAPTER TWO: BACKGROUND AND INNOVATION Malaria Overview:
Malarial disease is caused by infection with the Plasmodium parasite, transmitted to humans through a bite from an infected female Anopheles mosquito. There are five Plasmodia species known to infect humans: P. falciparum, P. vivax, P. ovale, P. malariae, and P. knowlesi. Though most infections worldwide are caused by P. vivax, P. falciparum is responsible for the most deaths6,7. Symptoms usually manifest within 7-30 days after an infectious bite6. Typical symptoms of uncomplicated malaria include fever, chills, anemia and an enlarged spleen. However, some cases proceed to complicated malaria, which includes cerebral malaria and severe anemia6. Pregnant women can also develop placental malaria, potentially leading to premature delivery or a low birth weight baby6,8. Infections are treatable, although the available treatments depend on specific country policies.
malaria symptoms such as fever, anemia, or an enlarged spleen. PCR is a laboratory based method that detects Plasmodium DNA from a patient blood sample. Though the most sensitive diagnostic, PCR requires specialized equipment and laboratory materials9. Each method presents pros and cons; the purpose of the diagnostic data and available resources often dictate which method will be used.
General risk factors for malaria disease include both biological and behavioral factors. Biological factors that influence risk include: younger age, human genetic factors (such as sickle cell trait), or previous infection10. Behavioral/societal influences include: lower income,
agricultural exposure, and lack of proper housing10. While these factors are generally considered to be risk factors for disease, the relative effects of each of these may differ across populations. Studies from specific regions, as will be discussed further in the context of the Democratic Republic of the Congo, have also identified more individual and community-level risk factors2,3,5. Thus, findings from malaria studies tend to be specific to the specific context of study.
The Global Burden of Malaria:
Malaria remains a major public health problem worldwide. In 2018, there were
2017, the estimates from 2018 indicate that the number of cases globally has since dropped slightly (228 million cases in 2018 vs. 231 million in 2017)11,14.
Figure 2.1: 2018 global distribution of malaria worldwide. Countries in red reported at least one malaria case. Countries in yellow and blue reported zero cases in the past year (yellow) or previous three years (blue)11.
Africa16. MAP’s work highlights the enormous progress in malaria control over the past fifteen years, and identifies regions that will still need attention in the coming years.
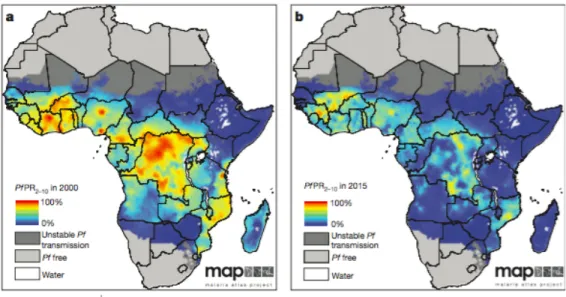
Figure 2.2: Estimated changes in malaria prevalence (as detected using RDTs) between 2000-2015 amongst children ages 2-1016.
The success of malaria control programs since 2000 are in large part due to significant increases in international investment. In the past two decades, there has been a nearly fifteen-fold increase in international spending on malaria control programs as well as research and
development15,17. Nearly 2 billion dollars were invested in malaria programs in the WHO Africa region in 2016, an increase from 960 million per year over the past decade18. In the next decade, a further scale up of investment is planned to help more countries achieve elimination19. Thus, despite the recent uptick of cases, international attention and effort is focused on reducing malaria burden.
Malaria Interventions:
three main groups: insecticide treated nets (ITNs), indoor residual spraying (IRS), and
chemoprevention20. ITNs work in two ways, providing a physical barrier between an individual and the mosquito to prevent biting and by killing the mosquito with insecticide21,22. Many nets used today, called long lasting insecticide treated nets (LLINs), are specifically engineered to have extended insecticide efficacy22,23. The second option, IRS, involves spraying the inside of a building with insecticide to kill mosquitos24. This method targets a subset of Anopheles species that rest inside after taking a blood meal25. Lastly, many countries use chemoprevention methods by providing individuals, usually vulnerable groups such as pregnant women or children, with anti-malarial medication to prevent infection. Intermittent preventative therapy during pregnancy (IPTp) with Sulfadoxine-pyrimethamine (SP) is recommended by the WHO in areas of moderate to high transmission26,27. IPTp consists of providing all pregnant women with three doses of SP regardless of whether the woman is infected. Similarly, intermittent preventative therapy for infants (IPTi) consists of providing infants with three doses of SP within the first year of life regardless of infection status28. Some countries also implement seasonal chemoprevention during months of high transmission29. For this, WHO recommends using SP and Amodiaquine29. Many studies have assessed the efficacy of these interventions, demonstrating a range of protective effects across various geographic areas and transmission settings16,30,31. The choice of which interventions to use depends largely on the specific entomological and epidemiological environment, as well as available resources.
implement the vaccine in three countries (Kenya, Ghana, and Malawi) for children under the age of 2 years old32,35. As this program progresses, we will learn more about the effectiveness of this vaccine and its potential to help reduce transmission worldwide. Additional on-going research is investigating alternative vaccines such as those that block transmission of the malaria parasite rather than preventing infection36,37. These vaccines are still in development but are a promising avenue of research.
Though these various intervention methods have all been shown to be generally
protective against malaria, new threats to intervention efforts are spreading. First among these is resistance to many commonly used anti-malarial drugs including SP (the drug used for IPTp and IPTi). The history of malaria control is marked by the introduction of novel therapeutics,
followed quickly by the development of resistance38. A recently completed study from our group using a subset of samples from children from the 2013 DRC Demographic and Health Survey estimated that 76% of the children with malaria had an infection with least one of the mutations shown to be linked with SP resistance39. Similarly, resistance to insecticides has led to decreased efficacy of LLINs and IRS40,41. Mutations of the mosquito genome block the insecticidal activity of the chemicals used to treat nets or used in IRS40. Though studies have shown that treated nets are still more protective than untreated nets in the presence of resistant mosquitos, rising
resistance may seriously impact malaria control efforts41. Other roadblocks for prevention efforts are non-use and misuse of LLINs. A study from Ethiopia found that while 91% of survey
concerning and indicate the need to monitor the effect of various interventions in preventing transmission.
Spatial Epidemiology of Malaria:
Like other infectious diseases, malaria exhibits a complex spatial epidemiology, with transmission intensity differing across regions43. Countries are often categorized based on the level of transmission, for example: sustained year-long transmission, seasonal transmission, or low transmission43. However, these categorizations often mask within country heterogeneity. Many countries have some regions of high transmission and others of seasonal or low
transmission5,44. In certain countries, this “micro-geographic” variation is observed even with a single city45. These heterogeneous dynamics are a result of various factors including differing vector populations across the country, ecological environments, and population density4,46–48. Different epidemiologic profiles within a single country indicate the need to study malaria on sub-national spatial scale.
Spatial patterns of malaria transmission are in part driven by human mobility patterns. Infected persons can introduce malaria to new areas by traveling from an endemic region to a non-endemic region49. A study from Kenya used mobile phone data to identify specific “source” areas of high transmission from which people travel to “sink” areas of low transmission49. Work from Zambia demonstrated that individuals move to and from areas of high transmission even on a daily basis50. These findings complicate malaria control efforts, as human mobility can be difficult to monitor and is not an avenue for easily implementing interventions.
Understanding population structure can help shed light on important questions, such as the degree of local versus national transmission. Recent studies have used genetic sequencing data to demonstrate that such structure does exist amongst P. falciparum populations in Southeast Asia51,52. The extent of this structure in sub-Saharan Africa is an area of active research as novel genetic and analytical tools are further developed53.
Mapping of malaria prevalence across the world has become a hotbed of research as new statistical methods are developed. Though maps of malaria have existed for many decades, modern computing power has allowed the development of new geostatistical models, particularly those that use a Bayesian framework16,54–56. These models, used by groups such as MAP, have deepened our understanding of malaria epidemiology and highlighted avenues for future
development16,55. Additional methods seek to link multiple types of data, such as parasite genetic sequencing data and cellphone records, to more accurately describe and predict local
transmission patterns54. Urbanization and Malaria:
Another element of the spatial epidemiology of malaria is the effect of urbanization. The growth of urbanization over the past century has helped contribute to the drop in malaria
are vastly different from rural areas in terms of the ecological landscape and demographics, both of which contribute to malaria risk61. However, urban malaria should not be discounted as transmission does occur within cities60. The differing epidemiology of malaria between urban and rural areas indicates that malaria control efforts must be tailored to specific settings.
The differences between urban and rural areas have also been shown to affect malaria control programs. A study from Myanmar demonstrated that ITN ownership and usage was higher amongst rural populations than urban62. Past work conducted in Liberia determined that the effects of bed-nets differed between the settings, with increasing community-level bed-net coverage being protective in urban areas but displaying no effect in rural areas63. The authors suggest that this difference could be due to a few reasons including: higher population density in urban areas (leading to increased density of nets), insecticide resistance in rural areas, or
insufficient community-level LLIN use in rural areas63. Other studies from across sub-Saharan Africa have demonstrated that the protective effect of nets is lower in areas of higher
transmission intensity, which is often true of rural areas64,65. These findings provide further evidence that control programs must be specific to each area as the effects of various interventions may differ by setting.
Malaria in the DRC:
The burden of malaria in the DRC is one of the highest in the world, with an estimated 25 million cases in 201766. This represents over 10% of cases worldwide1. Transmission is
Figure 2.3: PCR-detectable malaria prevalence estimates from 2007 amongst adults in the DRC5. Areas of darker color indicate areas of higher prevalence; estimates range from 0 to 82%.
Findings from genetic studies indicates that transmission within the DRC is complex and highly heterogeneous. The DRC, the second largest country in Africa, is considered a “melting-pot” of malaria transmission, connecting East, West, and Central Africa71–73. Previous analyses have shown that parasites from the DRC are genetically similar to strains from both West and East Africa, indicating transmission between the DRC and its neighboring countries71,73. Additionally, the evidence regarding parasite population sub-structure in the DRC is mixed. Some studies have found no evidence of structure71,72, though others suggest that drug resistant parasites cluster together spatially39,53. Thus, the details of local transmission dynamics remain unclear. However, the overall picture is one of a complex environment of high transmission.
with a very short transmission season, a tropical zone with high transmission during the rainy season, an equatorial region with high year-round transmission, and an urban zone with
heterogeneous transmission (includes only the capital city of Kinshasa) (Figure 2.4)20. As stated, prevalence estimates from 2007 range across regions from as high as 82% to as low as 0%5 (Figure 2.3). Additionally, there is evidence of heterogeneity between urban and rural areas, as the prevalence of infection amongst children living in rural areas was found to be higher than that amongst children in urban areas2. These dramatic differences make it more difficult to plan intervention programs, as different regions have vastly different needs. Understanding the drivers of these spatial differences is a key element of reducing transmission.
Risk factors for malaria in the DRC:
Given the high burden of malaria, determining risk factors for infection is critical for identifying individuals or groups more likely to become infected. Several studies have performed such analyses in the DRC, identifying both individual and community-level risk factors for infection (Table 2.1) 2,5,73. The most recent analysis of adults was conducted using data from the 2007 DHS; multiple analyses of children have been conducted more recently using data from the 2013 DHS.
Table 2.1: Previously identified risk factors for malaria in the DRC
Level Risk Factor Association Group studied Study year
Individual Age Older age is protective Adults and children
20075,
201174, 20133 Wealth Increasing individual
wealth is protective Adults 2007 5
Female Sex Found to be both protective (adults) and harmful (children)
Adults and
children 2007 5,73, 20133 Recent Fever Recent fever associated
with increased risk
Children 200773, 201174 Receiving
anti-malarial Receiving anti-malaria during last pregnancy is protective
Adults 200773
Bed-net use Individual bed-net use is protective
Adults and children
20075, 20132 Community Wealth Increasing community
wealth is protective against infection in general, found to be associated with increased prevalence of drug resistant infections
Adults and
children 2007
5, 201339
Education Increasing community education associated with increased prevalence of drug resistant infection
Adults and children
2007, 201339
Bed-net use Increasing community
These various factors highlight the multi-faceted nature of malaria and the many different forces that drive transmission. They also highlight potential inconsistencies in the literature (such as the effect of female sex or community-level wealth).
Interventions in the DRC:
In the DRC, bed-nets and IPTp are two main components of the malaria intervention program20. The Ministry of Health began a national ITN and LLIN rollout campaign in 200775. In 2008, the World Bank financed a program to distribute ITNs to Kinshasa specifically75. Reported ITN and LLIN ownership increased between 2007 and 2013 from 28% to 72% and 9% to 70%, respectively2,76. Additionally, IPTp using SP is recommended for all pregnant women, though estimates from 2013 indicated that only 14% of pregnant women reported receiving at least two doses of SP (three doses are recommended)20,26,77. These programs are supported by groups such as The World Bank as well as The President’s Malaria Initiative and Santé Rural, two health organizations working in the DRC20,78. As the burden of malaria remains high within the DRC, the actual protective effects of these intervention programs need to be investigated.
There is no current national IRS program in the DRC. Limited IRS programs are conducted by a few privately-owned mining companies located in the southern provinces; however, these are very localized programs79. In 2017, approximately 36,000 households were included in an IRS program carried out in Luabala province80. Future malaria control programs may include IRS, though this would require extensive entomological monitoring80.
Environmental Altitude Increasing altitude is protective
Adults and children
200773, 20133 Precipitation Increasing precipitation is
protective
Children 20133 Agriculture Increasing agricultural
land cover increases risk
Several studies from the DRC have demonstrated that community-level interventions are associated with reduced malaria risk more so than individual interventions. This has most clearly been demonstrated in the case of bed-nets, where increasing community bed-net coverage was associated with a larger individual protective effect than individual bed-net use amongst children2,3. A 2014 study of all-cause child mortality (ACCM) in seventeen African countries (including the DRC) found that the protective effects of individual ITN ownership depended on community-level ITN coverage; individual ITN ownership was only associated with decreased hazard of ACCM in areas with >30% community ITN use81. The same study found that
community ITN coverage above 50% was protective against malaria amongst children without ITNs within their households, though this specific analysis did not include the DRC81. The finding that one person’s protection helps protect others is not surprising, and has in fact been a part of intervention planning for many infectious diseases for many years. However, the extent to which community-level coverage of other interventions, such as IPTp, affect malaria risk
amongst adults in the DRC has not been explored.
Overview of spatial modeling:
spatially correlated observations violate this assumption. Luckily, the disciplines of geostatistics and spatial epidemiology specifically work to address this problem.
There are several approaches that have been developed to properly model spatial data and the literature on these topics is vast. A discussion of these methods could (and does) span
multiple textbooks, so here we will only briefly discuss the methods we used in our analyses. In this dissertation, I primarily utilized Conditional Auto Regressive (CAR) modeling. CAR models are useful in a setting in which data are aggregated to a set of non-overlapping areal units such as states, counties, or districts83. Data from areas that are neighbors are assumed to be more highly correlated than those from areas that are not. Multiple groups have proposed various
specifications of this type of model and specifics regarding the models used in this dissertation are provided in Chapter Four. Additional modeling methods that we explored, though ultimately did not include in the analysis, are Spatially Varying Coefficients (SVC) modeling. First laid out by Gelfand et al in 2003, SVC methods allow exposure/outcome associations to vary over space82,84. This not only more accurately estimates associations than non-spatial models, but also allows us to discern patterns of effects across space. For example, Wheeler et al demonstrated that the association between the number of alcohol outlets within a neighborhood and the violent crime rate changed considerably across the study area (the city of Houston), with increasing alcohol outlets displaying a protective effect in some neighborhoods but a harmful effect in others82. These methods are necessary to properly assess and address spatial autocorrelation, and the choice of proper methods is determined by the research question and available data.
Innovation:
CHAPTER THREE: SPATIAL AND EPIDEMIOLOGICAL DRIVERS OF P. FALCIPARUM MALARIA AMONG ADULTS IN THE DEMOCRATIC REPUBLIC OF
THE CONGO Introduction:
Malaria remains an important cause of morbidity and mortality in the Democratic Republic of the Congo (DRC), which is home to 12% of all cases globally85. Understanding malaria transmission in the DRC is critical for furthering efforts to eliminate malaria in sub-Saharan Africa. In addition to the high disease burden, there is evidence that the DRC acts as a bridge of transmission, connecting parasites from East and West Africa72,73,86. To combat transmission and reduce disease burden, it is important to determine risk factors for infection. These factors can be used to identify individuals or groups more likely to become infected and, therefore, more likely to benefit from programmatic interventions. Adult infections remain understudied, as most malaria deaths occur amongst children87,88. However, adults are frequently infected, often asymptomatically, and may serve as a reservoir for transmission68,69. Yet, we know very little about risk factors for infection in adults. In this study, we assessed malaria risk factors amongst adults using data from over 16,000 participants from the nationally
representative 2013-2014 Demographic and Health Survey (DHS) conducted in the DRC, the largest and most recent health survey conducted in the country.
were small and geographically limited74,89. A study of adults in the DRC conducted using data from the 2007 DHS identified several risk factors, such as younger age, male sex, and lower individual and community-level wealth5; however, no nationally representative risk factor studies of adults have been conducted since.
In this study we evaluated current individual, household, community, and environmental risk factors for malaria amongst adults. Additionally, because increasing antimalarial drug resistance is a growing concern in the DRC, we sought to understand the relationship between community-level resistance and infection prevalence39,53. Similarly, the association between increasing antimalarial use and malaria prevalence amongst adults has not been studied in the DRC. Understanding the role of these factors is critical for determining drivers of malaria infection. The different scales of the factors demonstrate the various levels at which malaria interventions can be targeted.
This study builds on previous work in the DRC by evaluating the role of urbanization on risk factors for infection. Understanding the effect of urbanization on malaria transmission is a critical part of intervention planning4,57,58. Unlike other infectious diseases, which thrive in cities due to increased population density, malaria transmission is often lower in urban areas as
assessing whether the effects of various risk factors for infection differed between individuals in urban versus rural areas.
The findings from this study can be used to identify individuals and communities at higher risk for malaria infection in the DRC. They also shed light on differences in the epidemiology of malaria between urban and rural settings.
Methods:
Study Population: The data for these studies were drawn from both the 2007 and the 2013-2014 Demographic Health Surveys (DHS) conducted in the Democratic Republic of Congo. The DHS Program, run by USAID in conjunction with local governments, carries out cross-sectional surveys in over 90 countries93. In the DRC, the DHS is conducted by several governmental ministries, using a nationally representative randomized cluster sampling
method76. First, sampling cluster sites were selected from a map of enumerated areas across the country with the probability of selection proportional to the size (number of households) of the cluster. Next, households were randomly selected for inclusion from within clusters94. Cluster sizes differ between urban and rural areas with approximately 5 – 15 more households included in rural areas94. To account for this nested cluster sampling strategy when analyzing the data, each cluster was assigned a sampling weight. DHS survey conductors visited selected
A total of 18,257 adults from 12,549 households were included in the 2013-2014 survey and asked to provide blood samples. This included 9,601 women (ages 15-49) and 8,656 men (ages 15-59). In addition, 9,790 children (ages 6 months to 5 years) were part of the survey. Although they were not included in this analysis, they have been examined previously2,3,9.
Risk factor selection and modeling: Potential risk factors P. falciparum infection were determined by consulting previous studies and based on biological plausibility. We selected individual, household, and cluster (community) level risk factors that have demonstrated
associations with malaria risk 2,3,5. Individual factors included age, biological sex, HIV infection status, education, and wealth index. The DHS Program calculates wealth index as a composite variable based on each household’s assets and housing materials95. Using Principal Components Analysis (PCA), participants were then grouped into wealth quintiles: poorest, poor, middle, rich, and richest95. We also assessed bed-net use, which was determined by whether the individual reported sleeping under a long lasting insecticide net (LLIN) the previous night. At the household level, we constructed a “net ratio” variable by dividing the number of total nets per household by the number of individuals within the household. This was then dichotomized into ratios of less than 0.5 versus those of 0.5 or higher (i.e.: at least one net for every two household members). We also created a composite “housing materials” variable, dichotomized as either traditional or modern, based on data from the roof, wall, and floor material variables (further details are available in Appendix A)96. A recent study from The Gambia demonstrated that metal roofs were protective against malaria infection97, thus we also assessed the
range in temperature (defined as the difference between the average temperature in January and average temperature in July) and the cluster vegetation index98.. Data were drawn from the DHS questionnaire as well as from the DHS Program, which collects a range of environmental and geological data98.
PCR diagnosis: The primary outcome for Aim 1 was P. falciparum malaria infection as determined by real-time PCR. In this Aim, malaria is defined as infection with P. falciparum parasites. PCR was performed on the blood-spots collected as part of the DHS survey. Whole blood collected by finger-prick was spotted onto Whatman filter paper, dried at ambient temperature, and initially stored with desiccant at -80C in Kinshasa until punching (one 6mm punch per subject) and shipment to UNC. DNA was extracted from the blood spots using a Chelex extraction assay and used for PCR testing99. The PCR assay detects the P. falciparum lactate dehydrogenase gene (pfldh) with a limit of detection of 5-10 parasites/mL100,101. The human beta-tubulin (HumTuBB) gene was used as a positive control, and any samples that failed to amplify HumTuBB were excluded. The duplexed pfldh and HumTuBB quantitative PCR assay was performed using reaction conditions, primers, and quality control measures for high-throughput PCR exactly as previously described101. All samples were run in duplicate. Samples that amplified pfldh in only a single replicate were considered negative if the cycle threshold value was higher than 38. All laboratory assays were completed at the University of North Carolina at Chapel Hill.
Using previously generated sequencing data from 1,065 children enrolled in the 2013-14 DRC DHS39,53, we assessed single nucleotide polymorphisms (SNPs) of the pfdhps (A437G, K540E, and A581G) and pfcrt (K76T) genes known to be associated with sulfadoxine-pyramethamine (SP) and chloroquine resistance, respectively53,102–104. We used these individual-level data to estimate cluster-level prevalence for each SNP using the PrevMap package in R, which fits a spatial model using a Gaussian Process105. We fit the model to generate estimates of the underlying allele frequency distribution using maximum likelihood and running 10,000 simulations. Further model details are available in Appendix A.
Modeling and statistical analyses: All analyses were performed using the R statistical platform v. 3.5.2111. We assessed the relationship between each risk factor and PCR detectable malaria infection using bivariate log-binomial regression models (i.e. not adjusted for other variables) to estimate prevalence ratios. We fit models incorporating sampling weights using the survey package in R, which uses weighted generalized estimating equations to properly account for the multi-level sampling scheme and correlation between individuals in the same sampling cluster112,113. This allowed us to assess individual and cluster-level factors simultaneously. As most households had only one adult member, we did not need to account for within-household correlation. We used bivariate models as the aim was to assess marginal associations, not causal relationships114.Each identified risk factor was then further assessed to determine if the
association with malaria prevalence differed by urban/rural status by including the urban variable and an interaction term between each factor and the urban variable in the model. As done
previously for MIP genetic data, we generated spatially smoothed prevalence and standard error estimates using the PrevMap package (Appendix A)105.
Results:
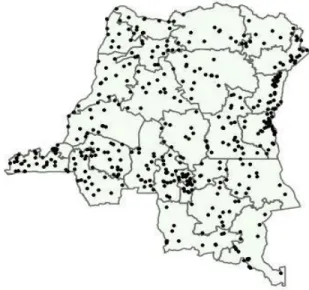
Our analysis included 16,126 adults from the original 18,257 initially selected for inclusion in the DHS. Individuals were sampled from 533 geographically dispersed clusters; GPS data were missing for 44 clusters, resulting in 489 clusters for analysis (Figure 3.1). Characteristics describing the individuals with missing GPS data are available in Supplemental Table A2. After final data processing, 16,363 individuals had complete PCR and DHS covariate data. Two-hundred and thirty-seven individuals were not considered “du jure” (members of the sampled household, rather than visitors who slept in the household the previous night115) and, thus, were not included in the analysis, resulting in a final data set of 16,126 individuals (Figure 3.2). Overall PCR prevalence of P. falciparum infection was 30.3% (SE = 1.1). The results of the PrevMap analysis demonstrated the high spatial heterogeneity of infection; community
prevalence estimates ranged from 0-76% (Figure 3.3). The map of the model standard errors indicated low variance in the estimates across the DRC (Supplementary Figure A1). Prevalence estimates by province ranged from 6.7% in Nord-Kivu to 58.3% in Bas-Uele (Supplementary Table A1).
Figure 3.1: Sites of 2013-2014 DHS sampling clusters
Figure 3.3: Map of predicted P. falciparum PCR prevalence estimates. Smoothed prevalence estimates, incorporating the sampling weights, were generated using the PrevMap package in R39. Predicted proportions range from 0-0.76.
Risk factor analysis: Several covariates were associated with prevalence of malaria infection (Table 3.2). Individual protective factors included: increasing age, female sex,
increasing education, and increasing wealth index. Protective household factors included living in a house made of modern housing materials and having a metal roof. At the cluster-level, increasing median wealth index was protective. Higher use of SP amongst pregnant women at the cluster-level was also found to be associated with lower prevalence of malaria. Drug-resistance mutations were more common in low-prevalence clusters. Increasing average
temperature was associated with increased prevalence of infection as was increasing vegetation. A larger range in average monthly temperature was associated with lower malaria prevalence. Full risk factor modeling results are available in Table 3.2.
We found a modest protective association of individual LLIN use and no effect of
level, a net ratio greater than 0.5 (i.e. at least one net per two household individuals) was
protective, compared to households with a lower ratio. When we stratified individual net use by insecticide type, we observed a protective effect of deltamethrin-treated nets and a signal for protection with alphacypermethrin nets. There was no significant protective effect of permethrin-treated nets, a finding that has been previously reported for children in the DRC2. Restricting LLIN use to only those who had reported using a net treated with deltamethrin or
alphacypermethrin, we found a slight protective effect of increasing community-level net use. The sensitivity analysis of net use showed no differences between measurement options or the coding choice for net use (Supplemental Figure A1). Additionally, the sensitivity analysis showed no difference in the association when restricting “net-use” to only nets under 3 years old. A comparison of individual LLIN net use between adults and children included in the 2013-2014 DHS indicated similar protective effects (Supplementary Table A4).
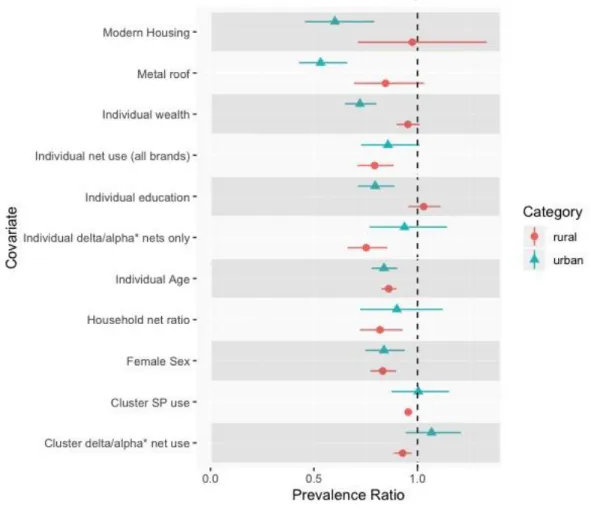
Analysis of Associations by Urban/Rural status: There were several socioeconomic-related risk factors whose association varied by urban/rural status (Figure 3.4). These included individual-level wealth, with increasing wealth showing a protective effect in urban areas but not rural. A similar trend was observed for increasing individual-level education. Additionally, both modern housing and metal roofs were protective in urban areas but not in rural areas. Cluster-level wealth demonstrated problematically high collinearity with urbanicity and thus could not be modeled. Full numeric results from this analysis are presented in Supplemental Table A3.
Overall, urbanicity did not impact the association between LLIN use and malaria
nets were more protective in rural areas than in urban areas. Similarly, the analysis of LLIN use by cluster-level prevalence found that individual net use was more protective in areas of higher overall malaria prevalence (Figure 3.5).
The correlation between the urban/rural categories generated for this analysis and the original DHS categories was 0.75.
Figure 3.4: Results of the analysis comparing risk factor effects between urban versus rural areas.
Figure 3.5: Effect of individual bed-net use by cluster-level malaria prevalence. We used previously published data from children included in the 2013-2014 Demographic and Health Survey in order to determine cluster-level prevalence9. Individual bed-net use was more protective in clusters with higher malaria prevalence. The null value (Prevalence Ratio = 1) is indicated with a horizontal dashed line.
Discussion:
included in the 2013-2014 DHS, indicating similar underlying spatial processes116. Similarly, the prevalence map displays similar a pattern to that from adults included in the 2007 DHS5. The areas of high versus low prevalence are likely driven by several factors such as altitude and urbanicity. The mountainous regions of Kivu in the northeast have very little malaria, while the mining districts in southern DRC have higher prevalence.
The national prevalence estimate of 30% amongst adults is similar to that from the 2007 DHS, suggesting a need for increased investment in malaria control in the DRC and further understanding of drivers of transmission5,85. We observed that the prevalence is unchanged from 2007 despite increases in LLIN coverage and the number of individuals being tested and treated for infection85. Thus, understanding malaria risk factors in all age groups remains critical for the design and implementation of effective interventions. Several risk factors identified in an
analysis of the 2007 DHS data were also associated with increased infection prevalence in this study, highlighting their continued importance in the epidemiology of malaria. These include younger age, male sex, and lower community-level wealth5. The factors identified in this study, many of which have also been identified in other countries10,117,118, are particularly important for identifying infected individuals in the DRC, as many adult infections are asymptomatic and often go undetected68. Thus, targeting malaria interventions towards younger adults, men, and poorer communities could maximize their impact.
In this study, we found that individuals living in households with a bed-net ratio greater than 0.5, i.e.: at least one net for every two household members, had lower prevalence of malaria. This ratio is recommended by the WHO in order to ensure a sufficient number of nets for
knowledge. Our findings demonstrate the importance the number of nets within a household and support the WHO recommendation. However, only 24% of households in 2013-2014 DHS had a net ratio of 0.5 or higher. The 2019 WHO World Malaria Report estimated that currently,
approximately 50% of households in the DRC have at least one net for every two people11. Thus, the DRC is making progress towards achieving the WHO recommendation; however, there is still a lot of work to be done to make sure all households meet the recommendation. It is critical that future bed-net distribution campaigns ensure that enough nets are provided to each
household.
In this analysis we did not observe the overall protective effect of community bed-net use that has been previously demonstrated amongst children in the DRC, though there was a
protective effect of increasing community use of deltamethrin and alphacypermethrin treated nets2. As mentioned, we did see a protective effect of increasing within household net coverage, which may be a more important factor for reducing infection than community net use. Our findings of greater protection from nets in higher prevalence areas and in rural areas are supported by a recent meta-analysis that found increasing community malaria prevalence
associated with a greater protective effect of LLIN use (OR = 0.80) 119. Thus, bed-net distribution campaigns may be more successful in rural or generally higher prevalence areas than in cities.
consider additional malaria control programs such as improved community testing for malaria and targeted mass drug administration122–124.
The findings from the genetic analysis of mutations associated with SP and chloroquine resistance indicate that areas of higher prevalence of drug resistance had lower prevalence of malaria infection. While this is a marginal association and does not reflect a causal relationship, this could be due to the amount of anti-malarial drug use, leading to lower overall prevalence of malaria but increased resistance through increased selective pressure. Future studies should aim to investigate the causal effect of increasing community-level drug resistance on malaria risk; however, this was not the primary aim of this study. Additionally, cluster-level SNP prevalences were modeled estimates generated using data from children and thus may not be representative of overall community-level prevalence.
Modern housing and metal roofing were both associated with lower prevalence of malaria, though the association was more pronounced in urban areas than in rural areas. The effect of metal roofing agrees with findings from a recent study conducted in the Gambia, which found 38% lower mosquito survival and lower malaria prevalence amongst villages with higher proportions of metal roofs125. The authors of the study propose that this is due to the higher temperatures of metal roofs during the day, leading to lower mosquito survival. The present findings suggest that housing improvements may help reduce malaria risk, either directly as proposed by the Gambian study, or indirectly through overall improvements in living conditions and socioeconomic status.
rural areas. This may be a result of increased access to prevention and treatment methods in urban areas, as has been observed in other countries. A study from Equatorial Guinea found individuals in rural areas waited longer to seek treatment for malaria infections compared to those in urban areas, and were more likely to be treated at home rather than in a health facility126. These results also agree with findings from previous studies that poor individuals living in urban areas have similar health risks to the general rural population58. Thus, in urban areas, the malaria positive population is poorer and less educated than those infected in rural areas. Malaria control programs should take these differences in high-risk populations into account, targeting poorer or less educated individuals in cities and ensuring that interventions are accessible for these
populations. Conversely, interventions in rural areas need to be more widespread and accessible to a more diverse population.
This study has several strengths. First, it uses nationally-representative, population-based data from over 16,000 individuals, the largest health survey conducted in the DRC. This allows us to make inferences regarding the country as a whole. Other recent malaria risk factor studies have fewer individuals or are conducted in a smaller geographic area74,89. Second, we determined malaria infection using high-throughput real-time PCR, the most sensitive method for diagnosing infection9. Third, it leverages country-wide drug resistance genotyping data to inform
The findings from this study are subject to limitations. Several of the covariates included in the study were obtained from self-reports, including LLIN usage. While self-reported data are subject to recall bias, the DHS questionnaire asks multiple questions regarding net use that allowed us to assess bias. The sensitivity analysis comparing these questions indicated no difference in modeling results between the questions, providing confidence that bias from self-reports is minimal. Secondly, this analysis evaluated marginal associations and thus the findings cannot be interpreted as causal effects. However, the associations are useful for identifying and targeting interventions to higher risk individuals and groups such as younger, less educated men. Additionally, as the DHS is a cross-sectional survey, we did not assess the effects of seasonality. Finally, we could not directly assess the epidemiology of symptomatic malaria in the DRC as DHS surveys do not sample health facilities.
Conclusion:
This study evaluated risk factors for P. falciparum infection amongst adults in the DRC using data from the nationally representative, population based DHS survey. Overall prevalence of infection was high, 30%, and grossly unchanged from the prior 2007 survey. We observed high spatial heterogeneity across the country and identified individual, household, and
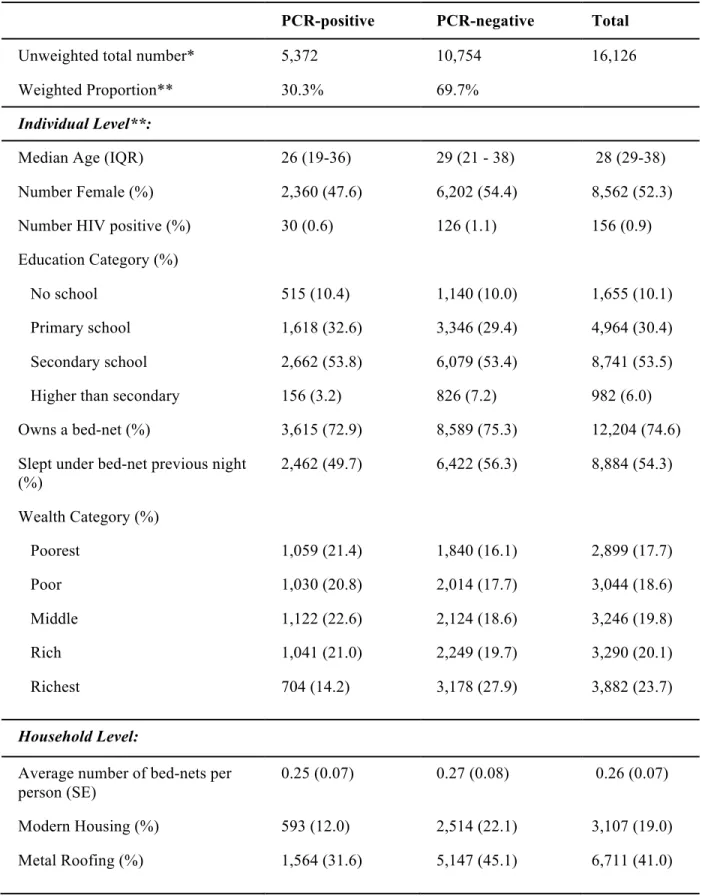
Table 3.1: Descriptive statistics of the study population by P. falciparum PCR status
PCR-positive PCR-negative Total
Unweighted total number* 5,372 10,754 16,126
Weighted Proportion** 30.3% 69.7%
Individual Level**:
Median Age (IQR) 26 (19-36) 29 (21 - 38) 28 (29-38)
Number Female (%) 2,360 (47.6) 6,202 (54.4) 8,562 (52.3)
Number HIV positive (%) 30 (0.6) 126 (1.1) 156 (0.9)
Education Category (%)
No school 515 (10.4) 1,140 (10.0) 1,655 (10.1)
Primary school 1,618 (32.6) 3,346 (29.4) 4,964 (30.4)
Secondary school 2,662 (53.8) 6,079 (53.4) 8,741 (53.5)
Higher than secondary 156 (3.2) 826 (7.2) 982 (6.0)
Owns a bed-net (%) 3,615 (72.9) 8,589 (75.3) 12,204 (74.6)
Slept under bed-net previous night (%)
2,462 (49.7) 6,422 (56.3) 8,884 (54.3)
Wealth Category (%)
Poorest 1,059 (21.4) 1,840 (16.1) 2,899 (17.7)
Poor 1,030 (20.8) 2,014 (17.7) 3,044 (18.6)
Middle 1,122 (22.6) 2,124 (18.6) 3,246 (19.8)
Rich 1,041 (21.0) 2,249 (19.7) 3,290 (20.1)
Richest 704 (14.2) 3,178 (27.9) 3,882 (23.7)
Household Level:
Average number of bed-nets per person (SE)
0.25 (0.07) 0.27 (0.08) 0.26 (0.07)
Modern Housing (%) 593 (12.0) 2,514 (22.1) 3,107 (19.0)
Cluster-level**:
Median Age (IQR) 30.0 (28.5 – 31.3) 29.7 (28.2 – 31.0) 30.0 (28.6- 31.6)
Urban (%) 1,329 (26.8) 4,297 (37.7) 5,626 (34.4)
Median Education (IQR) 2 (1-2) 2 (1-2) 3 (2-3)
Median Wealth Score (IQR) 3 (2-4) 3 (2-5) 3 (2-4)
Average Annual Centimeters of Precipitation (SE)
152.2 (1.4) 149.9 (1.7) 150.6 (1.4)
Average Temperature (SE) 24.7 (0.1) 23.7 (0.2) 24.0 (0.2)
Vegetation Index*** 3934.5 (52.6) 3660.7 (69.5) 3734.6 (58.7)
% Drug Resistance****:
Any pfdhps 92.2 (0.7) 95.1 (0.4) 94.2 (0.5)
pfdhps K540E 23.5 (1.7) 32.9 (2.5) 30.1 (2.1) pfdhps A581G 1.8 (0.1) 3.9 (0.4) 3.2 (0.3) pfcrt K76T 56.0 (2.3) 64.8 (1.9) 62.1 (1.8)
% Net Ownership (SE) 73.7 (1.3) 75.0 (1.5) 74.6 (1.3)
% Net Usage (SE) 52.7 (1.4) 54.6 (1.6) 54.0 (1.4)
% SP use amongst pregnant women (SE)
25.3 (1.3) 28.0 (1.1) 27.2 (1.1)
*These are unweighted raw numbers and do not represent the sum of the subsequent values in the table as subsequent values incorporate sample weights
**Proportions and numbers with sampling weights applied
Table 3.2: Risk factor analysis results
Variable Prevalence Ratio 95% Confidence
Interval
p-value†
Individual Level:
Age (scaled) 0.86 0.83 – 0.89 <0.001
Female Sex 0.83 0.78 –0.88 <0.001
HIV positive 0.63 0.38 - 1.03 0.067
Education Category:
No school (REF) -- -- --
Primary school 1.05 0.92 – 1.18 0.473
Secondary school 0.98 0.85 – 1.13 0.761
Higher than secondary 0.51 0.38 – 0.70 <0.001
Wealth Category:
Poorest (REF) -- -- --
Poor 0.93 0.83 – 1.04 0.189
Middle 0.95 0.85 – 1.06 0.330
Rich 0.87 0.73 – 1.02 0.088
Richest 0.50 0.40 – 0.61 <0.001
Owns a Net 0.92 0.82 – 1.03 0.138
Slept under LLIN 0.83 0.76 – 0.91 <0.001
Net type:
No net (REF) -- -- --
Permethrin 0.94 0.78 – 1.12 0.477
Alphacypermethrin 0.68 0.38 – 1.22 0.198
Deltamethrin 0.81 0.73 – 0.91 <0.001
Household level:
Net ratio* 0.85 0.76 - 0.95 0.003
Metal Roofing 0.66 0.58 - 0.75 <0.001
Cluster Level:
Urban 0.70 0.37 - 0.83 <0.001
LLIN ownership** 0.97 0.93 – 1.00 0.058
LLIN usage** 0.98 0.92 – 1.04 0.457
LLIN usage (deltamethrin and alphacypermethrin nets only)**
0.95 0.90 - 1.00 0.040
Education 0.91 0.79 – 1.04 0.174
Wealth 0.87 0.83 – 0.92 <0.001
Precipitation (scaled) 1.06 0.97 – 1.17 0.179
Temperature (scaled) 1.32 1.23 - 1.42 <0.001
Temperature range (scaled) 0.91 0.85 – 0.98 <0.001
Vegetation Index (scaled) 1.18 1.09 – 1.27 <0.001
SP†† use amongst pregnant women**
0.92 0.89 - 0.96 <0.001
Drug Resistance Prevalence**
Pfdhps A437G 0.88 0.85 – 0.91 <0.001
pfdhps K540E 0.95 0.93 – 0.98 <0.001
pfdhps A581G 0.89 0.85 – 0.94 <0.001
pfcrt K76T 0.93 0.91 – 0.96 <0.001
† P- value of the test of the null hypothesis that the PR = 1 †† Sulfadoxine/pyrimethamine
CHAPTER FOUR: INCREASED PATENT MALARIA IN THE DRC: GEOGRAPHIC AND EPIDEMIOLOGICAL CHANGES FROM 2007 TO 2013-2014
Introduction:
As worldwide efforts to reduce malaria transmission have stalled, there is an increasing need to evaluate the effects of malaria control programs87. Despite increased investment in malaria control, there are a number of growing threats to progress. These include increasing insecticide resistance to pyrethroids, an insecticide used to treat many long-lasting insecticide treated nets (LLINs),128 and resistance to many commonly used anti-malaria therapeutics53,103,127. Specifically, mutations of the Plasmodium falciparum dhps gene are associated with failure of sulfadoxine-pyrmethamine (SP); the drug provided to pregnant women to prevent infection during pregnancy4,6. Considering these threats, monitoring the effectiveness of interventions is critical for ensuring the success of malaria control programs.
Understanding the effects of intervention programs is particularly important in the Democratic Republic of the Congo (DRC), which has the second highest malaria burden in the world87. With an estimated 25 million cases of malaria in 2017, the DRC is home to 12% of cases worldwide11,87. Additionally, multiple studies have demonstrated that parasites from the DRC are genetically related to parasites from both East and West Africa, indicating that the DRC acts as a bridge of transmission across the continent72,86. These findings, along with the large size and population of the country, highlight the particular importance of reducing transmission in the DRC.
were approximately 23,620,000 total cases in 2006 and 23,378,784 in 2013, demonstrating that prevalence remained relatively steady between these two years11,129. However, recent WHO estimates also reported an increase of more than 500,000 infections in the DRC between 2016 and 201714. Additionally, the proportion of hospitalizations due to malaria increased from 46% in the 2005 – 2007 period to 55% in the 2011 – 2014 period20. Similarly, a recent study found that the number of reported malaria cases increased between 2005 and 2014. However, the authors hypothesize that this is due to an increase in detection and improved diagnostics rather than an increase in transmission130. These findings indicate that the state of malaria over the past decade remains unclear. In this study, we aimed to assess changes in malaria prevalence amongst adults using the most recently collected nationally representative, population-based data.
In this study, we aimed to understand differences in the spatial distribution of malaria between 2007 and 2013 and determine the impact of the LLIN and IPTp programs. As malaria is known to demonstrate high spatial heterogeneity, we sought to understand changes in prevalence on a sub-national scale3,16. Evaluating the effects of the intervention programs will help the MoH plan future intervention programs and ensure that control efforts are maximally effective. Methods:
Study populations: This analysis utilized data drawn from the 2007 and 2013-2014 Demographic Health Surveys (DHS). A full description of the DHS is provided in Chapter Three.
Intervention and covariate data: Data regarding LLIN and IPTp use were drawn from the DHS. The DHS asks several questions regarding LLIN use; for this analysis, we determined LLIN use by whether the individual reported sleeping under an LLIN the previous evening. A previous sensitivity analysis discussed in Chapter Three demonstrated no difference between the choice of LLIN use measurement between the different questions132. The DHS also collected data regarding the LLIN brand, which we used to determine the insecticide with which the net was treated. Questions regarding IPTp use asked women whether they received SP during their most recent pregnancy and if so, how many doses. The DHS questionnaire asks all women if they are pregnant at the time of the survey as well as whether they have been pregnant in the previous five years.
all adults). We also included an urbanicity score, a composite variable based on multiple factors with a demonstrated relationship to urbanicity. The method for constructing this variable has been previously described in Chapter Three132.
Molecular Diagnosis of Patent Infections: The outcome for this study was patent malaria infection, defined as at least 100 parasites per microliter of blood. In both 2007 and 2013, we used quantitative Polymerase Chain Reaction (qPCR) to determine malaria infection. However, the qPCR assays used to detect the presence of malaria parasites differed between surveys, making a direct PCR comparison difficult. The 2007 assay targeted the 18S region of Plasmodia ribosomal DNA133, while the 2013 assay targeted the P.f. lactase dehydrogenase gene (pfldh), as previously described101. For the 2007 survey, DNA was extracted from blood spots using a QIAamp 96 DNA blood kit (Quiagen, Germantown Maryland); DNA was extracted from blood spots from the 2013 survey using Chelex extraction. All samples were run in duplicate.
Spatial analysis: The sampling clusters used in the 2007 DHS changed for the 2013 DHS. In 2007, 300 clusters were selected, while a set of 536 new clusters were selected in 2013 (Figure 4.1). These changes prohibit a direct comparison of cluster-level malaria prevalence across time. To address this issue, we aggregated the cluster-level data to the 26 provinces of the DRC (Figure 4.1), incorporating the survey sampling weights.
Within the boundaries of the 26 provinces, the DRC is further divided into 150 territories (Figure 4.2). To assess changes in prevalence on a smaller spatial scale, we also aggregated the data to the territory level. There were seven territories that did not have a DHS sampling cluster in 2013, and 36 with no sampling clusters in 2007. We imputed missing covariate data using ordinary kriging with the sp package in R135. We did not impute outcome data for the seven territories without prevalence data from 2013; these territories were not included in the models.
Figure 4.1: Sampling locations from the 2007 (left) and 2013-2014 (right) Demographic and Health Surveys. A total of 300 sampling clusters were included in 2007; 536 clusters were included in 2013-2014. Province boundaries are indicated in black.
Figure 4.2: Map of the territories within the DRC. The 150 territories of the DRC are outlined in black; the 26 provinces are outlined in red.
To assess overall uptake of IPTp, we evaluated IPTp use amongst women who reported a pregnancy in the previous five years. Women were categorized as having received any IPTp, at least two doses of IPTp, or not receiving IPTp. To assess the relationship between IPTp use and patent infections, we evaluated only women who were pregnant at the time of the DHS survey (when the malaria testing was conducted). We assessed the proportion of pregnant women with patent infections who received IPTp versus those who did not receive IPTp using chi-squared tests. We also used Fisher’s exact tests if any category had fewer than five women.
LLIN Modeling: As we aggregated data to the territory-level, we chose to use area-level models. These models assessed the relationship between territory-level LLIN use and the change in patent infection prevalence between 2007 and 2013. We fit both standard non-spatial
multilevel models including a random effect for province, and models with a spatial random effect in order to incorporate the data’s spatial dependence. We compared model fit using the Deviance Information Criterion (DIC) and selected the final models based on the lowest DIC.
We fit models with a spatial random effect using the CARBayes package in R83. The models had the following form:
Yk = XTk 𝞫 + ɸk
details provided in the Appendix B). The model was fit using Markov chain Monte Carlo and run with 100,000 iterations. Details regarding model priors are provided in Appendix B.
For both sets of models, the primary exposure was the proportion of individuals reporting LLIN use. We assessed the effect of all LLIN use, and use of nets treated with deltamethrin or alphacypermethrin only. We subset to these insecticides as they were the only insecticides that demonstrated efficacy in previous studies2. The outcome from the models was the difference in territory-level prevalence between 2013 and 2007. We also fit both crude and adjusted models in order to account for confounders of the effect of LLIN use on malaria prevalence. All
proportions were logit transformed.
As a secondary analysis, we also estimated the effect of individual LLIN use and assessed differences in the effects between provinces. To accomplish this, we fit non-spatial multilevel models. These models assumed a binomial distribution with a random intercept for province and a random slope for LLIN use. This allowed the effect of LLIN use to vary between provinces. However, these models did not account for the data’s spatial dependence. We fit the models using the lme4 package in R138 and determined standard errors for random effects using the merTools package139. The full model specification is presented in Appendix B.
We determined confounders of the LLIN association with malaria infection based on the literature, biological plausibility, and constructing Directed Acyclic Graphs. Potential
confounders of the LLIN-malaria relationship were: age, wealth index, education level, degree of urbanicity, community-level net use in 2007, and patent infection prevalence in 2007. As