IMPROVING THE COLLECTION AND CALIBRATION OF VOLTAMMETRIC MEASUREMENTS OF STRIATAL DOPAMINE RELEASE
Nathan Thomas Rodeberg
A dissertation submitted to the faculty at the University of North Carolina at Chapel Hill in partial fulfillment of the requirements for the degree of Doctor of Philosophy in the Department of Chemistry.
Chapel Hill 2017
ii
2017
iii ABSTRACT
Nathan Thomas Rodeberg: Improving the Collection and Calibration of Voltammetric Measurements of Striatal Dopamine Release
(Under the direction of R. Mark Wightman)
Fast-scan cyclic voltammetry (FSCV) enables rapid and sensitive measurements of
electroactive neurochemicals in a variety of organisms, including rodents, non-human primates,
and most recently, humans. Many FSCV recordings have focused on the role of the
neurotransmitter dopamine, which is implicated in a wide host of different behavioral and
pathological states. Experiments using FSCV in conscious rodents have corroborated previous
electrophysiology studies that demonstrated dopamine plays a key role in learning,
reward-seeking behavior, and the actions of drugs of abuse.
The first half of this dissertation concerns studies delving into the role of phasic
dopamine release during intracranial self-stimulation (ICSS). In ICSS, subjects are trained to
self-administer electrical stimulation of the brain in a manner akin to self-administration of drugs
of abuse. Unsurprisingly, given the established role of dopamine in reward-seeking, histological
and pharmacological studies have implicated dopamine as a key mediator of this task.
However, direct measurements of dopamine release on a timescale relevant to behavior were
elusive until the development of FSCV. Early FSCV studies suggested a dissociation between
phasic dopamine release and ICSS responding, which stood in stark contrast to evidence from
previous reports. Chapter 2 revisits this original finding with the use of more sensitive FSCV
measurements and improved calibration methodology, while Chapter 3 extends the study with
behavioral and pharmacological manipulations to further probe the relationship between
iv
The second half of this dissertation pertains to the recent development of
chronically-implanted fused-silica microelectrodes (CFMs) for longitudinal FSCV measurements. While
these electrodes permit recordings over unprecedented timescales in single recording locations,
experimental and practical limitations have required changes in calibration compared to
previously established techniques with acutely-implanted glass CFMs. Chapter 4 investigates
the potential pitfalls of one approach to calibration, which uses universal models to analyze
collected data. Chapter 5 is a collaborative review written with the developers of these
electrodes, which addresses similarities and differences between experiments using acutely- or
chronically- implanted CFMs, while Chapter 6 describes further characterization and
comparison of these two electrode designs. Altogether, the studies in this dissertation suggest
v
ACKNOWLEDGEMENTS
While it takes a village to raise a child, it took a small army to develop me as a scientist.
First, I would like to thank my advisor Dr. Mark Wightman for his steadfast support during
graduate school. You taught me that strong science can tell compelling stories, and much of my
development as a scientist and as a scientific communicator has been through your mentorship.
I would also like to acknowledge several people at Concordia College that set me on my current path. Dr. Chopper Krogstad first introduced me to scientific research, and though I’m sure he
would hardly call anything I describe in this dissertation as chemistry, he was invaluable in
setting off the spark that keeps the cogs turning through the day-to-day ups and downs of
academic research. Dr. Darin Ulness and Dr. Julie Mach first introduced me to neuroscience and its deep ties to chemistry and, along with Dr. Mark Jensen’s teaching of analytical chemistry
(which I originally thought would be tremendously boring), I’m not sure where I would be without
them.
The work presented in this dissertation is the end product of collaboration with several
lab mates and a couple different research groups. Chapter 2 involved collaboration with Dr.
Beth Bucher and Justin Johnson. Dr. Michael Saddoris, Dr. Courtney Cameron, and Justin
Johnson contributed data and/or data analysis to Chapter 4, which also included important
intellectual contributions from Dr. Gina Carelli. Chapter 5 was a highly collaborative work, with
major input and guidance from Dr. Paul Phillips and Dr. Stefan Sandberg at the University of Washington – Seattle, in addition to discussion and editing by Justin Johnson. Lastly, Chapter 6
vi
contributions from several motivated undergraduate students over the years, including Laura
Kim, Isaac Studebaker, Nathaniel Swofford, Marc Gonzalez, Devon Martin, and Aki Min.
Lastly, I would like to give personal thanks to several people who have made graduate
school as bearable as possible. Dr. Beth Bucher taught me nearly everything I know about
voltammetry and in vivo experiments, and was one of the earliest and strongest driving forces behind me feeling at home in my new environment at UNC. Now that I’m older than you were
when I started, I mildly regret all of my jokes about your advanced age. Dr. Nina
Owesson-White helped me keep my sanity during freely-moving experiments, and her unexpected gifts of
sour patch kids fueled many needed revitalizations. Several close friends in my department,
including Robert Soto, Mac Gilliland, and (now labmate) Caddy Hobbs helped me get through
the first year(s) of course work, both in and outside of the classroom. Justin Johnson, my
electronics TA turned good lab mate and friend, was a great collaborator and sounding board,
even when my questions only became slightly less obnoxious after electronics had ended. The ‘Rodeberg-Johnson’ series certainly got much further than I thought it would.
Outside of the lab, I was lucky to have a great support system, spearheaded by my
loving parents and family. Thank you for unconditionally supporting me throughout my
education, as well as reading and passing along my work even when it must have sounded like
complete gibberish. I was fortunate to move to Chapel Hill with a familiar face, my long time
buddy and (former) roommate Taylor. Thank you for all of the memories formed in Chapel Hill
(and elsewhere), and making graduate school much less bleak than it could have been. And
last, but not at all least, I would like to acknowledge my soon-to-be-wife Deirdre. I am incredibly
lucky you swapped seats at TRU, and I look forward to sharing a long life and career in science
vii
TABLE OF CONTENTS
LIST OF TABLES ... xii
LIST OF FIGURES ... xiii
LIST OF ABBREVIATIONS AND SYMBOLS ... xv
CHAPTER 1: FAST-SCAN CYCLIC VOLTAMMETERY FOR THE MONITORING OF ELECTROACTIVE NEUROCHEMICALS ... 1
Introduction ... 1
Fast-scan cyclic voltammetry: the basics ... 3
Electrochemical measurements ... 3
Carbon-based microelectrodes ... 5
Analytical merits of fast-scan cyclic voltammetry ... 7
Sensitivity ... 7
Temporal resolution ...13
Chemical selectivity & resolution ...14
Accuracy ...19
Conclusions & future directions ...23
References ...24
CHAPTER 2: DOPAMINE DYNAMICS DURING CONTINUOUS INTRACRANIAL SELF-STIMULATION: EFFECT OF WAVEFORM ON FSCV DATA ...34
Introduction ...34
Experimental ...36
Animals ...36
Surgery ...37
viii
FSCV...38
Data analysis ...39
Statistical analysis ...40
Flow Cell analysis ...40
Results ...41
Anodic limit and stimulated release in anesthetized animals ...41
Phasic dopamine concentrations during continuous ICSS ...45
Sensitivity determines ability to consistently monitor dopamine ...50
Effect of biofouling on continuous measurements ...52
Temporal resolution determines ability to reliably quantitate rapidly spaced transients ...53
Balance of temporal resolution and sensitivity determine ability to monitor dopamine dynamics ...57
Discussion ...60
References ...64
CHAPTER 3: DEPLETION OF RELEASABLE DOPAMINE DRIVES DISSOCIATION BETWEEN PHASIC DOPAMINE RELEASE AND CONTINUOUS ICSS ...68
Introduction ...68
Experimental ...71
Animals ...71
Surgery ...71
Behavior ...72
FSCV recordings ...73
Drug administration ...74
Data analysis ...74
Statistics ...75
Results ...76
Yoked ICSS ...76
ix
Cocaine and amphetamine administration ...82
Correlation of behavior and dopamine levels ...88
Discussion ...91
References ...96
CHAPTER 4: CONSTRUCTION OF TRAINING SETS FOR VALID CALIBRATION OF IN VIVO FSCV DATA BY PRINCIPAL COMPONENT ANALYSIS ... 100
Introduction ... 100
Experimental ... 102
Animals ... 102
Surgery ... 103
Behavior ... 103
ICSS ... 104
FSCV... 105
Data analysis ... 105
Results & discussion ... 107
FSCV measurements during behavior consist of multiple physiologically relevant components ... 107
Training sets from natural rewards ... 109
PCR and training sets from separate electrodes ... 112
Residual analysis ... 118
Standard training sets constructed from multiple electrodes ... 121
Conclusions ... 125
References ... 128
CHAPTER 5: HITCHHIKER’S GUIDE TO VOLTAMMETRY: ACUTE AND CHRONIC ELECTRODES FOR IN VIVO FAST-SCAN CYCLIC VOLTAMMETRY ... 131
Techniques for monitoring molecules in neuroscience ... 131
Development of FSCV for freely-moving animals ... 133
Experimental considerations ... 135
x
Experimental design for FSCV recordings in freely-moving animals ... 138
In vivo electrode positioning ... 139
Reference electrodes ... 143
Signal stability ... 143
Chemometric data analysis ... 147
Principal Component Regression ... 148
Additional diagnostics to test the quality of training sets ... 155
PCR with residual analysis in practice ... 156
Conclusions and perspectives ... 162
References ... 165
CHAPTER 6: CHARACTERIZATION OF FUSED-SILICA ELECTRODES FOR LONGITUDINAL MEASUREMENTS OF STRIATAL DOPAMINE RELEASE ... 177
Introduction ... 177
Experimental ... 180
Animals ... 180
Electrode Construction ... 180
FSCV... 182
Flow-Cell Analysis ... 182
Surgery ... 183
In vivo recordings ... 184
Data analysis ... 185
Statistics ... 186
Results ... 186
In vitro comparison of electrode designs ... 186
Acute in vivo comparison of electrode designs ... 191
Effect of prolonged use of carbon-fibers on electrode sensitivity... 194
Failure of electrical stimulation to track potential sensitivity changes in vivo ... 197
xi
Changes in background current following long-term implantation ... 202 Discussion ... 205
xii
LIST OF TABLES
Table 2.1. Comparisons of [DA]max, rise time, and t1/2 between different waveforms ...42
Table 2.2. The post-implantation sensitivity for different implantation durations ...54
Table 2.3. The total number (and percentage) of transients that were quantifiable
across waveforms ...59
Table 3.1. Comparison of dopamine profiles during dual session ICSS on FR1 and
FI5 paradigms. ...81
Table 4.1. Characteristics of dopamine K-matrices for various subjects for two
different training set construction methods ... 111
Table 4.2. Training sets built in different subjects predict different peak dopamine
concentrations than training sets built within subject ... 116
Table 4.3. Key parameters from the K-matrices for dopamine and pH changes ... 117
Table 4.4. The number of transients that failed residual analysis during various
training set misapplications ... 120
Table 6.1. The sensitivity, noise levels, and temporal response over repeated cycling
of FS CFMs ... 196
Table 6.2. The background amplitudes at chronically-implanted CFMs before and
after long-term implantation... 203
Table 6.3. Changes in background amplitude over repeated cycling of FS CFMs in
xiii
LIST OF FIGURES
Figure 1.1. Background subtraction with fast-scan cyclic voltammetry. ... 4
Figure 1.2. Diagram of carbon paste and carbon fiber microelectrodes ... 6
Figure 1.3. Electrode modifications for FSCV measurements ...11
Figure 1.4. Principal component regression to remove influence of pH from dopamine concentration predictions ...16
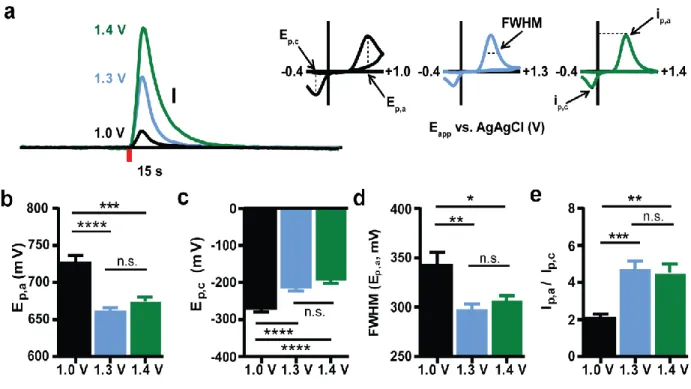
Figure 2.1. Differences in cyclic voltammogram characteristics across waveforms ...44
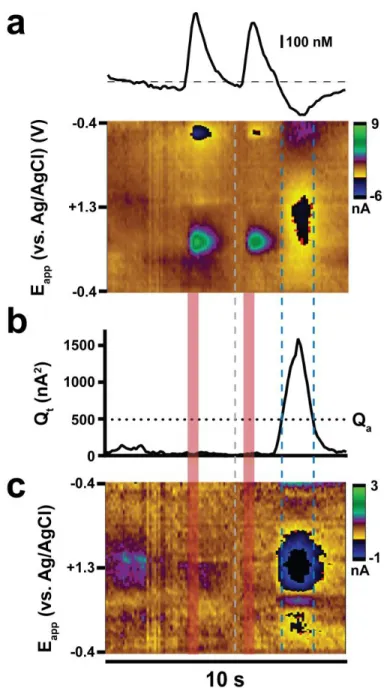
Figure 2.2. Depiction of ICSS data analysis ...46
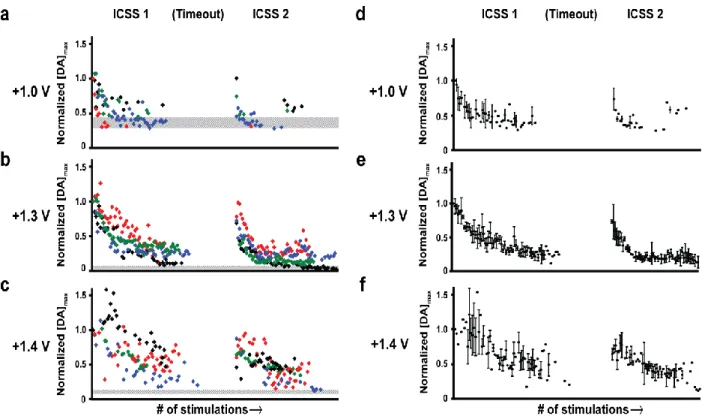
Figure 2.3. The amplitude of individual dopamine transients during and across ICSS sessions with different waveforms ...48
Figure 2.4. Dopamine concentration versus time traces for representative measurements on each waveform before, during, and after the first intracranial self-stimulation session ...51
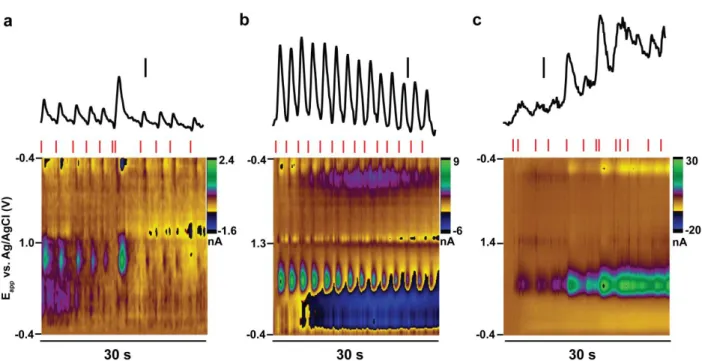
Figure 2.5. Temporal resolution is diminished with extended anodic limits ...56
Figure 2.6. Temporal resolution and its dependence on pressing rate differ across waveforms ...58
Figure 3.1. Electrically-evoked dopamine release during yoked-ICSS (FR1) stimulation pattern. ...77
Figure 3.2. Fixed-interval 5 (FI5) paradigm for ICSS. ...79
Figure 3.3. Comparison of the decline in electrically-evoked dopamine release between FR1 and FI5 ICSS ...80
Figure 3.4. The effects of cocaine and amphetamine on electrically-evoked dopamine release. ...84
Figure 3.5. The effect of cocaine and amphetamine on dopamine release during FI5 ICSS. ...86
Figure 3.6. Phasic dopamine release patterns during drug-treated FI5 ICSS. ...87
Figure 3.7. Comparison of response rates and dopamine concentrations between and across treatments. ...89
Figure 4.1. pH changes depend on reinforcer identity and order ... 108
Figure 4.2. Training set construction with naturally evoked transients ... 110
xiv
Figure 4.4. Training sets built in different subjects predict different dopamine
transient concentrations ... 115
Figure 4.5. Residual analysis with different training sets ... 119
Figure 4.6. K-Matrices from composite training sets built with standards collected at different carbon-fiber microelectrodes ... 122
Figure 4.7. Parameters of interest for composite generalized training sets ... 123
Figure 4.8. K-matrices for composite training sets constrained to two principal components ... 124
Figure 5.1. The designs of borosilicate glass and fused silica CFMs ... 137
Figure 5.2. Comparison of concentrations measured at acute and chronic CFMs without optimization for dopamine release sites ... 141
Figure 5.3. Dopamine transients at chronically implanted CFMs ... 142
Figure 5.4. An example of the use of principal component analysis to analyze cocaine-induced dopamine transients ... 149
Figure 5.5. Training sets built with data from separate electrodes could capture qualitative information ... 160
Figure 6.1. Environmental scanning electron micrographs of fused-silica and borosilicate glass carbon-fiber microelectrodes ... 187
Figure 6.2. In vitro characterization of FS and BSG elecrodes ... 189
Figure 6.3. Acute in vivo comparison of BSG and FS electrodes ... 193
Figure 6.4. The effect of prolonged cycling of CFMs on sensitivity towards dopamine ... 195
Figure 6.5. Temporal distortion in the electrically-evoked dopamine signal at chronically-implanted CFMs ... 199
xv
LIST OF ABBREVIATIONS AND SYMBOLS
* probability less than 0.05
** probability less than 0.01
*** probability less than 0.001
[X] concentration of analyte X
[DA]max peak concentration of dopamine transients
C degrees Celsius
α confidence interval
AA ascorbic acid
Ag/AgCl silver/silver chloride
AMPA α-amino-3-hydroxy-5-methyl-4-isoxazolepropionic acid
AP anterior-posterior
ATP adenosine triphosphate
BSG borosilicate glass
CaCl2 calcium chloride
CFM carbon-fiber microelectrode
CNT carbon nanotube
CS conditioned stimuli
CV cyclic voltammogram
DA dopamine
dB decibels
DOQ dopamine-ortho-quinone
DV dorsal-ventral
Eapp applied potential
xvi ECP electrochemical pretreatment
ET electron-transfer
FI5 fixed-interval 5
FR1 fixed-ratio 1
FS fused silica
FSCV fast-scan cyclic voltammetry
g grams
HCl hydrochloric acid
H2O2 hydrogen peroxide
HDCV High-Definition Cyclic Voltammetry
hr hours
Hz Hertz
i.p. intraperitoneal injection
IACUC Institutional Animal Care and Use Committee
ICSS intracranial self-stimulation
ip,a peak anodic current
ip,c peak cathodic current
KCl potassium chloride
kg kilograms
KHz kilohertz
L liters
LOD limit of detection
A microamperes
m micrometer
xvii
s microseconds
mA milliamperes
M-ENK met-enkephalin
MFB medial forebrain bundle
mg milligrams
MgCl2 magnesium chloride
min minutes
ML medial-lateral
mL milliliters
mm millimeters
mM millimolar
ms milliseconds
MSN medium spiny neuron
mV millivolts
n number of samples
N2 molecular nitrogen
nA nanoamperes
Na2SO4 sodium sulfate
NAc nucleus accumbens
NaCl sodium chloride
NaH2PO4 monobasic sodium phosphate
NaOH sodium hydroxide
nm nanometer
nM nanomolar
NR no reward
xviii
p probability
PC principal component
PCA principal component analysis
PCR principal component regression
PEDOT polyethylenedioxythiophene
Qα residual threshold at significance interval α
Qt sum of the squares residual at time t
r2 coefficient of determination
RMS root mean square σ standard deviation
s second
SEM standard error of the mean
SN substantia nigra
t time
t1/2 decay time from 100-50% max value
TRIS tris(hydroxymethyl)aminomethane
UEI universal electrochemical instrument
UNC University of North Carolina at Chapel Hill
V volts
1
CHAPTER 1: FAST-SCAN CYCLIC VOLTAMMETERY FOR THE MONITORING OF ELECTROACTIVE NEUROCHEMICALS
INTRODUCTION
The existence of chemical signaling between nerves was first proposed by Otto Loewi
following experiments in beating heart muscle of anesthetized frogs (Loewi, 1921). Later
investigation, largely by Henry Dale and colleagues, validated this theory for much of the
peripheral nervous system (Dale et al., 1936). However, this hypothesis emerged amid
controversy, as it was at odds with the prevailing theory that signal transduction occurred solely
via electrical impulses across gap junctions between cells. As such, it took decades of
experiments and debates between neurophysiologists and pharmacologists before chemical
transmission was accepted as standard for communication within both the peripheral and
central nervous system (Valenstein, 2002).
While much information regarding neurotransmission has been elucidated since these
original discoveries, chemical signaling within the brain still appears to be extremely complex. In
addition to the large number of molecules that have been proposed to act as neurotransmitters
or neuromodulators, it is common for each species to act at a wide host of receptors that can
differ both in their substrate affinities and downstream consequences following activation
(Beaulieu & Gainetdinov, 2011; Monaghan et al., 1989; Waldhoer et al., 2004). Moreover,
neurotransmitters can exert different effects by signaling at different time scales. For example, dopamine neurons have been shown to exhibit two patterns of cellular activity: “tonic firing”,
which is characterized by slow, rhythmic firing, and “phasic firing”, which consists of irregular,
high frequency bursts (Schultz, 1998). The former is thought to produce low ambient
2
termed ‘transients’, that can temporarily activate high affinity receptors. These two modes of
transmission have been demonstrated to carry different neurobiological and behavioral signals
(Floresco et al., 2003; Grace, 1991; Schultz, 1998). Therefore, development of techniques that
can accurately monitor these molecules for physiologically relevant concentrations and time
scales is an important endeavor. Moreover, these techniques should be compatible with
experiments in conscious subjects so that relationships between neurotransmitter signaling and
behavior can be revealed.
While there have been several techniques used to measure neurochemicals in real time
(Bucher & Wightman, 2015; Robinson et al., 2008), there are two main methods used today.
The most established procedure is microdialysis, which utilizes a probe enclosed in a
permeable membrane that interfaces with the surrounding brain tissue. Any molecule that can
diffuse across this membrane, in accordance to its concentration gradient with respect to the
dialysate, can be collected for downstream analysis. Thus, the sensitivity and selectivity of this
technique are predominately determined by the detection method employed (Kennedy, 2013).
However, the time needed for adequate equilibrium of analytes across the membrane, as well
as the minimum sample volume needed for detection, limit its temporal resolution to the order of
tens of seconds to minutes.
The focus of this chapter will be on an alternative technique, fast-scan cyclic
voltammetry (FSCV), which uses an applied potential at an electrode to oxidize and reduce
analytes of interest. Though limited to electroactive molecules, the high temporal resolution of
FSCV permits measurements of rapid release events on a behaviorally relevant time scale. The
3
FAST-SCAN CYCLIC VOLTAMMETRY: THE BASICS
Electrochemical measurements
The first electrochemical techniques for monitoring neurochemicals in brain tissue
included linear sweep voltammetry (Kissinger et al., 1973; Wightman et al., 1976), differential
pulse voltammetry (Ewing et al., 1983; Gonon et al., 1980), and chronoamperometry (Ewing, et
al., 1983; Gerhardt et al., 1984). While these techniques were sufficient to detect faradaic
currents corresponding to electroactive molecules in vivo, they were seldom able to see through the ‘mud’ to detect their neurotransmitters of interest due to the comparatively large ambient
concentrations of other easily oxidized species in the brain, such as ascorbic acid (AA) and
neurotransmitter metabolites (Parsons & Justice, 1992). Indeed, it has been demonstrated that
the electrochemical signal arising from slow voltage sweeps in brain tissue is dominated by AA
(Ewing et al., 1981). Moreover, these techniques lacked adequate sensitivity to measure
smaller, but physiologically relevant, neurotransmitter concentrations.
A significant step forward came with the development of FSCV, in which potentials are
swept at high scan rates (>100 V/s) in triangular ramps to oxidize and reduce electroactive
analytes within a given potential window (Armstrong-James et al., 1980; Millar et al., 1985;
Stamford et al., 1984). High scan rates have two primary benefits. First, this process increases
the redox current, which enables higher sensitivity (Bard & Faulkner, 2001). Second, this allows
each sweep to be completed on the order of milliseconds, which permits sub-second
measurements of neurotransmitter release. These advances enabled the first
chemically-resolved, real-time measurements of electrically-evoked dopamine transients (Kuhr &
Wightman, 1986; Stamford et al., 1986).
Traditional electrochemists avoid rapid scan rates for a good reason; non-faradaic
current arising from charging of the double layer scales proportionally with scan rate, and easily
dwarfs out the analytical signal. As a result, rapid voltage sweeps in the brain do not produce
4
5
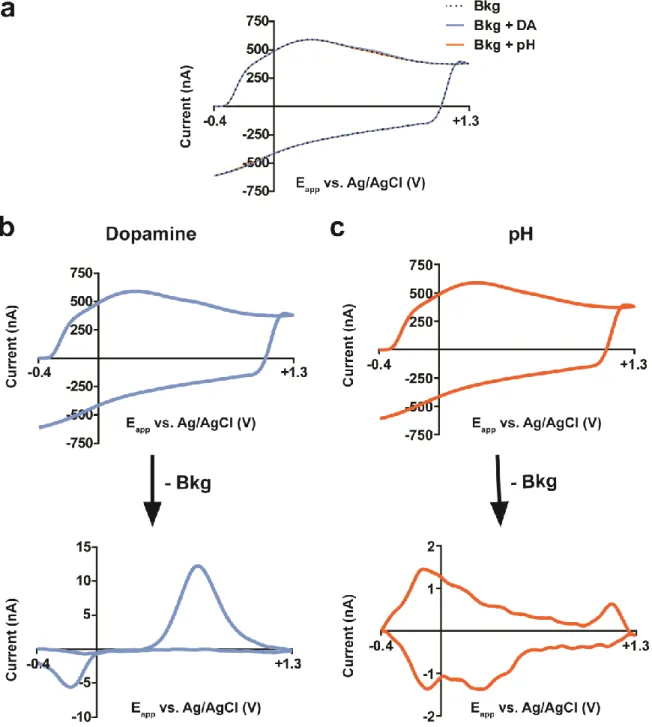
background signal is relatively stable over the course of the measurement window, background CVs preceding the ‘event’ of interest can be digitally subtracted out, with any remaining signal
reflecting changes in the surrounding environment (e.g. release of neurotransmitters, pH
changes) (Howell et al., 1986; Millar, et al., 1985) (Figure 1.1b-c). Unfortunately, this renders
FSCV a differential technique that is unsuitable for measurements of ambient levels of
neurochemicals in the brain.
Carbon-based microelectrodes
A technique can be only as good as its tools. The development of in vivo
electrochemistry was made possible by the simultaneous development of microelectrodes,
which were so small compared to their macroelectrode predecessors that detailed
characterization was necessary (Cheng et al., 1979). This characterization revealed that these
miniature probes have a number of electrochemical advantages. First, their small dimensions
enhance mass transfer to electrode surface via radial diffusion, which allows steady-state
measurements at sufficiently slow scan rates (Wightman, 1981). Second, the low area, and thus
capacitance, of these electrodes allows them to respond rapidly to changes in potential; scan
rates up to 106 V/s have been used, with the fastest speeds ultimately determined by the
bandwidth of instrumentation (Amatore et al., 1987; Wipf & Wightman, 1988). Third,
microelectrodes generate sufficiently small currents that any distortion that arises from ohmic
drop is minimal, which enables measurements in resistive media (Howell & Wightman, 1984).
Fourth, these small currents introduce minimal polarization of the reference electrode, which
supports the use of two electrode designs (Fitch & Evans, 1986). Last, these small currents
reduce concern with toxicity of electrogenerated products in vivo, particularly with the use of
cyclic voltammetry (Wightman, 1981).
While several different electrode materials have been used to construct microelectrodes,
6
7
substrates, such as gold, carbon has a wider potential window and exhibits less biofouling,
though it displays slower electron-transfer (ET) kinetics (Zachek et al., 2008). Carbon
microelectrodes are also inexpensive and easy to fabricate, and are amenable to a wide
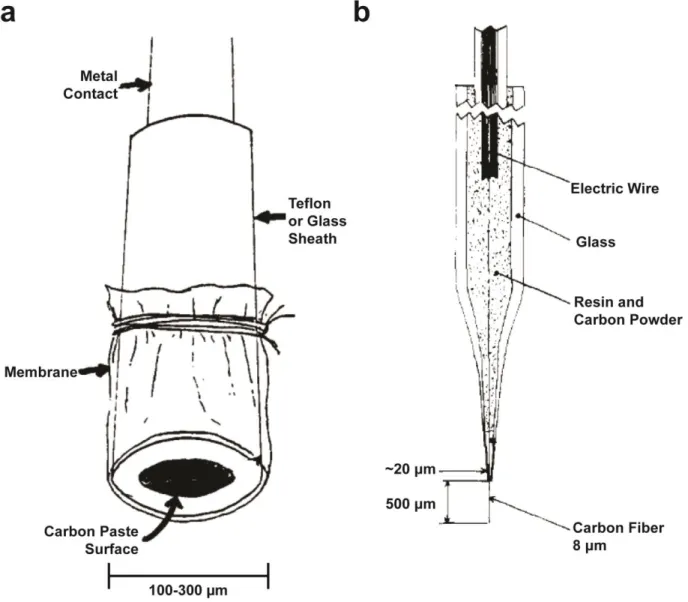
number of surface modifications for tunable electrochemistry. The first types of microelectrodes
used in vivo were constructed with carbon paste and were 100 to 300 µm in diameter (Figure
1.2a) (Cheng, et al., 1979; Conti et al., 1978; Kissinger, et al., 1973). While these probes were
much smaller than standard macroelectrodes, they did not provide advantages over
microdialysis in either spatial resolution or avoidance of tissue damage. An attractive alternative
emerged with the development of carbon-fiber microelectrodes (CFMs) (Figure 1.2b)
(Armstrong-James & Millar, 1979; Gonon et al., 1978). These probes vary from 5 to 15 μm in
diameter, and are therefore capable of making highly localized measurements in the brain. For
example, spacing between dopamine terminals in the striatum has been estimated to be around ~1 μm (Wightman, 1981), which allows these sensors to sample heterogeneity in this brain
region (Wightman et al., 2007; Wightman et al., 1988). Moreover, it has shown that acute
implantation of these sensors does not significantly damage the surrounding tissue (Peters et
al., 2004), especially compared to microdialysis probes (Jaquins-Gerstl & Michael, 2009).
ANALYTICAL MERITS OF FAST-SCAN CYCLIC VOLTAMMETRY
Sensitivity
An important aim for in vivo measurements is the ability to monitor physiologically
relevant concentrations of neurotransmitters. Strategies for enhancing sensitivity for FSCV at
CFMs generally fall into three camps: waveform modifications, electrode pre-treatment and
electrode coatings. While the focus of this section will be on promoting sensitivity towards
dopamine, the most commonly measured analyte with FSCV, many of the same principles in
8 Waveform Modification
The first waveforms used for in vivo FSCV had potential limits of ± 700-1000 mV and
holding potentials of 0 V, with 1.5 cycles of each potential sweep carried out at 300 V/s
(Armstrong-James, et al., 1980; Millar, et al., 1985). While this waveform was sufficient to detect
dopamine concentrations approaching 10-6 M, prolonged electrical stimulation (10 s) was
required to evoke measurable concentrations in vivo (Millar, et al., 1985). Therefore,
improvements in sensitivity were essential to make measurements under more physiological
conditions.
Waveform modifications to enhance sensitivity towards dopamine rely on the fact that
dopamine adsorbs to the electrode surface (Bath et al., 2000; Baur et al., 1988). Adsorption of
dopamine appears to be necessary for both reliable detection (Bath et al., 2001; DuVall &
McCreery, 1999) and fast ET kinetics (DuVall & McCreery, 2000). The amine side chain, which
is protonated at physiological pH, appears to be critically important for adsorption (Baur, et al.,
1988; Michael & Justice, 1987). Consequently, holding at negative potentials between scans
promotes electrostatic attraction of dopamine to the electrode surface. This introduces a
dependency of sensitivity on the waveform application frequency, as higher repetition rates
provide less time for dopamine to accumulate at the surface between measurements (Bath, et
al., 2000; Kile et al., 2012). While the use of a negative holding potential is a simple and widely
used approach, it has limitations; holding potentials lower than -600 mV can result in unstable
results (Heien et al., 2003), and negative holding potentials may promote the generation of
hydrogen peroxide (Dengler et al., 2015), which could have deleterious effects in brain tissue.
Modification of the anodic limit of the waveform, specifically its extension to more positive
potentials, can also increase sensitivity towards dopamine (Hafizi et al., 1990; Heien, et al.,
2003; Rodeberg et al., 2016). This process generates surface oxide groups on the carbon
surface (Roberts et al., 2010) that are critically important for adsorption of dopamine (Bath, et
9
enhanced sensitivity to be maintained over the course of measurements (Takmakov et al.,
2010b). Routine measurements using negative holding potentials and extended anodic limits at
untreated CFMs have an in vivo limit of detection around 20 nM (Heien, et al., 2003; Rodeberg,
et al., 2016).
The current for adsorbing species, including dopamine, is directly proportional to the
scan rate (Bard & Faulkner, 2001; Bath, et al., 2000). Therefore, increasing the scan rate is
another viable tactic for increasing sensitivity. Scan rates in excess of 2,000 V/s have been
used for measurements of dopamine, with a corresponding in vitro limit of detection around 1
nM (Keithley et al., 2011). The use of large scan rates also amplifies non-faradaic current, as
well as current arising from redox of surface moieties on the CFM surface. While these
contributions can be removed digitally through background subtraction, sufficiently high scan
rates can generate background currents that saturate the digital-to-analog converter. In these
cases, analog background subtraction can be used to eliminate its contribution (Hermans et al.,
2008; Keithley, et al., 2011).
Electrode pre-treatment
Pre-treatment of the electrode surface generally serves three goals:, increasing surface
oxide content (Alsmeyer & McCreery, 1991), cleaning the electrode surface (Bath, et al., 2000),
and/or enhancing the edge/basal plane ratio (Wightman et al., 1984), as edge planes have been
demonstrated to be the most reactive sites for electron transfer on carbon surfaces (Banks et
al., 2005). The first widespread approach for CFMs was electrochemical pre-treatment (ECP) (Feng et al., 1987; Gonon et al., 1981), which facilitates adsorption and ‘cracks’ the electrode
surface, increasing the effective surface area for electron transfer (Kovach et al., 1986; Swain &
Kuwana, 1991). Though ECP enhances sensitivity, it has a limited lifespan in vivo and can
induce temporal distortion during measurements (Feng, et al., 1987; Marcenac & Gonon, 1985).
10
while simultaneously increasing the sensitivity per unit area (Strand & Venton, 2008). In contrast
to ECP, the temporal response at these electrodes appears faster compared to untreated
carbon fibers. Flame-etched CFMs have an in vivo limit of detection around 10 nM, and are
sufficient to detect dopamine release following single pulse electrical stimulation. However, it is
unknown whether flame etching suffers from the same short lifespan in vivo as ECP. Another,
more simple approach is soaking the CFM in isopropyl alcohol spiked with activated carbon
(Bath, et al., 2000). This likely serves the dual purpose of cleaning the surface and facilitating
the formation of surface oxides. This treatment increases sensitivity approximately four fold at
cylindrical CFMs for measurements with a modest (+1.0 V) anodic limit. However, it is unclear
whether these significant advantages hold with extended waveforms that naturally renew the
electrode surface and generate oxygen-containing functional groups.
Electrode coatings
The development of electrode coatings for microelectrodes has often been tackled with
the primary goal of enhancing electrode selectivity towards particular analytes (see Chemical
Selectivity & Resolution section below). However, these coatings often provide the added
benefit of enhanced sensitivity due to preconcentration of analytes at the electrode surface. The
first common electrode coating for in vivo electrochemistry was the perfluorinated polymer
Nafion (Gerhardt, et al., 1984; Kristensen et al., 1987). The negative charge within the Nafion
structure promotes accumulation of cationic species, such as dopamine, resulting in a roughly
two to five fold enhancement of sensitivity (Gerhardt, et al., 1984). However, this increase in
sensitivity comes at the expense of temporal resolution, as Nafion coatings can cause
noticeable distortion of the FSCV signal (Kristensen, et al., 1987). Nafion can be either
dip-coated or electrodeposited on the electrode surface, though the latter approach is preferred for
11
12
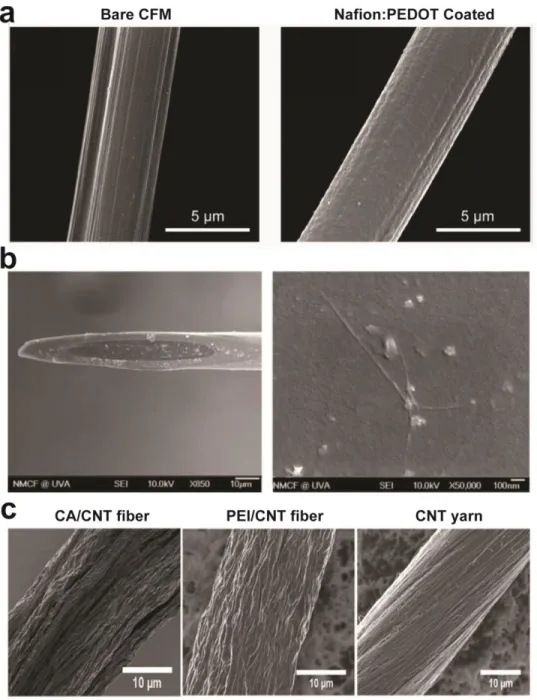
A recently developed coating uses the conductive polymer polyethylenedioxythiophene
(PEDOT) as a component in stable electrode films (Figure 1.3a) (Vreeland, et al., 2015) (The
positive charge of PEDOT acts with Nafion as a counterion for stable deposition of films on CFM
surfaces via (slow-scan) cyclic voltammetry, obviating the concern of irreproducibility with
regular Nafion coatings. The chemistry of this polymer pairingwas found to be tunable; low
density PEDOT:Nafion (i.e. low [PEDOT]) doubled sensitivity towards dopamine, while high
density coatings quadrupled sensitivity at the expense of temporal resolution. Both preparations
resulted in limits of detection around 5 nM. PEDOT has also been combined with graphene
oxide (GO) in lieu of Nafion for FSCV measurements (Taylor et al., 2017). Electrodeposition of
PEDOT:GO for 50 s was sufficient for a 10-fold enhancement of sensitivity. Unfortunately,
PEDOT:GO is vulnerable to overoxidation, so this film is only compatible with waveforms
without extended anodic limits.
Carbon nanotubes (CNT) have also been used to modify CFMs for more sensitive
measurements (Jacobs et al., 2010; Swamy & Venton, 2007a; Xiao & Venton, 2012) (Figure
1.3b). Electrode modifications with CNTs differ in a few distinct ways from other coatings. First,
CNT-modified CFMs do not appear to suffer from the same temporal distortion as
polymer-coated electrodes (Xiao & Venton, 2012), which allows more sensitive measurements to be
made more rapidly. Second, CNT deposition can enhance ET kinetics towards dopamine and
other analytes (Jacobs, et al., 2010). Third, CNT modification tends to increase redox current
for all measured species, rather than solely cationic species (Xiao & Venton, 2012). This
renders CNT-CFMs less selective than other coated electrodes. Similar to other electrode
modifications, reproducibility of fabrication can be an issue (Swamy & Venton, 2007a), though
improvements have been made via self-assembly (Xiao & Venton, 2012). An alternative use of
CNTs is its direct use as the electrode substrate (Figure 1.3c). CNT electrodes display the same
advantages as CNT-modified CFMs and have limits of detection approaching 10 nM (Jacobs et
13
combined with other electrode pretreatments to augment results (Yang, et al., 2016) and
engineered using different substrates to produce different electrochemical characteristics (Yang,
et al., 2017).
Temporal resolution
In addition to the requirement for adequate sensitivity, a reliable technique for monitoring
neurotransmission in vivo must have sufficient temporal resolution to resolve rapid
neurotransmitter release events. Due to the small area, and thus capacitance, of CFMs, FSCV
is capable of voltage sweeps at high scan rates (>100 V/s), which enables subsecond
measurements (Wightman, 1981). The main determinant of the temporal resolution is the
application frequency of the voltammetric waveform. To allow the diffusion layer to settle
between measurements, a holding time of ten times the length of the voltage sweep is
suggested (Howell, et al., 1986; Kawagoe et al., 1993). For standard in vivo measurements with
scans between -0.4 V and +1.3 V at 400 V/s, this amounts to ~85 ms between scans, which
results in a desirable application frequency of ~10 Hz. While measurements at higher sampling
frequencies are possible at bare CFMs, they have reduced sensitivity towards dopamine, likely
due to less time for adsorption between scans (Kile, et al., 2012). Curiously, this effect is not
seen at CNT yarn electrodes, which has been attributed to slower desorption kinetics for the
oxidized form of dopamine, dopamine-ortho-quinone (DOQ) (Jacobs, et al., 2014). This enables
measurements at up to 500 Hz without significant loss of sensitivity.
Adsorption and desorption kinetics also affect the temporal response of CFMs.
Voltammetric measurements exhibit slower responses to dopamine boluses than constant
potential amperometry (Venton et al., 2002) and respond more quickly to freely diffusing species
(e.g. AA) than predominately adsorbing species (e.g. dopamine) (Bath, et al., 2000).
14
come at the expense of temporal resolution. In particular, extended anodic limits dramatically
increase adsorption of dopamine to the CFM surface while blunting the temporal response
(Heien, et al., 2003), which can impact interpretation of data collected in freely-moving animals
with narrowly-spaced stimuli (Rodeberg, et al., 2016). It has been demonstrated that these
effects can be removed via deconvolution (Venton, et al., 2002). However, care must be taken
to delineate the effects of adsorption on the signal to separate it from other effects that could
alter signal duration, including proximity to dopamine terminals (Venton et al., 2003b), long-term
implantation (Clark et al., 2010), and overfiltering (Atcherley et al., 2013).
Chemical selectivity & resolution
In the words of Ralph Adams, ‘no amount of instrumental cajoling can provide
discrimination between competing oxidation reactions at the electrode surface’ (Adams, 1990).
Indeed, a major limitation of electrochemistry is its relatively poor resolving power. Early
measurements with in vivo electrochemistry were plagued with uncertainty of signal identity;
particularly, dopamine was difficult to resolve from other easily oxidizable species present in
brain tissue (Adams, 1976; Kovach et al., 1984). This ambiguity often led to discrepancies
between research reports, including contrasting results during amphetamine (Wightman, 1981)
and cocaine administration (Garris & Wightman, 1995; Gratton & Wise, 1994). Two of the
principal interfering species in vivo, AA and dopamine metabolite dihydroxyphenylacetic acid
(DOPAC) are anionic at physiological pH. Therefore, the first step to enhance selectivity was the
use of anion-excluding polymers (Gerhardt, et al., 1984; Kristensen, et al., 1987). Coating
electrodes with Nafion results in the signal from AA and DOPAC contributing <1% of the signal
from equivalent concentrations of dopamine (Gerhardt, et al., 1984).
The use of FSCV provides an additional level of selectivity over slow-scan techniques,
as molecules can be separated by their ET kinetics in addition to their half-wave potentials. For
15
oxidation wave occurring at more positive potentials (Baur, et al., 1988). The use of electrode
coatings with FSCV further enhances selectivity (Baur, et al., 1988; Kristensen, et al., 1987),
which is particularly important for measurements of serotonin, which competes with substantial
interference from its metabolite 5-hydroxyindoleacetic acid (5-HIAA) (Dankoski & Wightman,
2013; Jackson et al., 1995). Recent improvements to electrode coatings include PEDOT:Nafion
composite films that measure over 1500-fold higher current for dopamine over AA, an order of
magnitude enhancement over dip-coated Nafion (Vreeland, et al., 2015).
The main interference in typical in vivo measurements of dopamine arises from pH
changes, which occur in the brain as an effect of metabolism and blood flow during cellular
activity (Venton, et al., 2003b). pH changes in the environment surrounding CFMs can alter
redox of pH-sensitive surface functionalities, such as quinone groups, and modify the
background current; therefore, as a consequence of background subtraction, pH changes
produce distinctive CVs (Dengler, et al., 2015; Takmakov et al., 2010a). These CVs can overlap
with dopamine CVs; therefore, the use of univariate analysis (i.e. direct conversion of current at
the peak oxidation potential of dopamine to concentration) can allow pH changes to interfere
with reliable assignment of faradaic current (Jones et al., 1994). One approach to minimize this
effect is to alter the surface of the electrode to reduce sensitivity to pH (Runnels et al., 1999).
Another approach is to use the current arising from pH changes at potentials with minimal
dopamine contribution (e.g. ~+0.2 V on the anodic scan) to extrapolate the pH contribution at
the peak potential for dopamine (~+0.6 V) (Cheer et al., 2004). In this way, the contribution from
pH can be manually subtracted out to reduce interference.
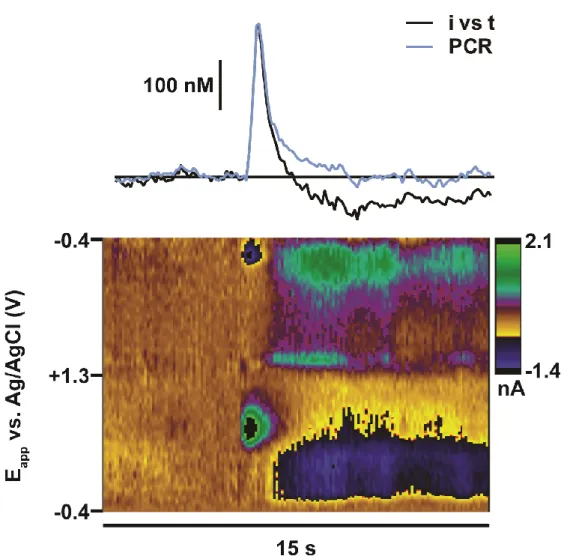
A more rigorous practice is the use the multivariate calibration techniques, such as
principal component regression (PCR), to analyze data with overlapping currents from multiple
analytes (Figure 1.4) (Heien et al., 2004; Heien et al., 2005). With this technique, the calibration model is built using a collection of CVs, termed a ‘training set’, that represents individual
16
17
contributions from each species contained in the training set. The applicability of the model can be tested through residual analysis in which current uncaptured by the model (‘residual’) is
compared to a tolerance level specific to each training set, which is based on estimations of
noise levels (Keithley et al., 2009). Failure of residual analysis indicates that the model is
insufficient for calibration, and the corresponding data is discarded. While PCR cannot provide
chemical identification (i.e. it does not alter selectivity at the electrode surface), its ability to
monitor multiple analytes, as well as its ability to statistically validate the reliability of the model,
gives it a substantial advantage over univariate techniques.
Waveform modifications
Modifications to the voltammetric waveform can also alter selectivity between different
species at bare CFMs. Indeed, waveform customization has long been used to expand the
chemical toolbox of FSCV. The first notable instance of this was the development of a
waveform for monitoring O2 changes in vivo, which sweeps to a negative potential (-1.4 V)
to reduce oxygen to hydrogen peroxide (Zimmerman & Wightman, 1991). The concurrent use of
positive anodic limits (+0.8 V) also permits detection of catecholamines, and simultaneous
measurements of norepinephrine, O2 , and pH changes have been conducted in vivo (Bucher et
al., 2014).
Waveforms have been adapted to detect other non-traditional analytes with FSCV. One
example is adenosine, which exhibits redox properties at high overpotentials (>1.2 V vs.
Ag/AgCl) (Swamy & Venton, 2007b). Because these potentials approach the limit of the
potential window in vivo, redox peaks for adenosine typically occur near the switching potential,
where there are significant contributions from non-faradaic currents, in addition to faradaic
currents from other analytes. As a result, specificity is a major issue for these measurements.
Venton and coworkers have demonstrated that a brief holding time (1 ms) at the switching
18
adenosine, adenosine triphosphate (ATP), and hydrogen peroxide (Ross & Venton, 2014). With
PCR, these dissimilarities were sufficient to allow the three analytes to be resolved, though
some misassigned current persisted in vitro.
Another target molecule that requires waveform modification for detection is
met-enkephalin (M-ENK), a peptide involved in the endogenous opioid system in the brain (Schmidt
et al., 2014). The electrochemical properties of M-ENK primarily arise from its electroactive
amino acid residues, tyrosine and methionine. Measurements with a standard voltammetric
waveform, sweeping between -0.4 V and +1.4 V, are inadequate to monitor M-ENK reliably, as
there is significant contribution from other species (e.g. dopamine) and M-ENK tends to foul the
electrode surface over successive measurements. Sombers and colleagues addressed these
problems in two distinct ways. First, a lower scan rate (100 V/s) was used from -0.2 V to +0.6 V
in regions to reduce sensitivity towards dopamine and AA. Second, a holding time (3 ms) at the
switching potential (+1.2 V) was used to weaken adsorption of M-ENK products to the electrode
surface, thereby reducing subsequent biofouling. While these measurements of M-ENK appear
to have sufficient chemical resolution from dopamine and AA, a systematic comparison of
M-ENK signals to other analytes that contribute near +1.2 V (e.g. adenosine, ATP, hydrogen
peroxide) has yet to be attempted. Moreover, other tyrosine-containing peptides have peaks
similar to M-ENK, which could make separation of different peptides a difficult task (Schmidt, et
al., 2014).
Additional criteria for chemical specificity
Ultimately, some species cannot be efficiently resolved with FSCV, even with the use of
PCR. For example, dopamine and norepinephrine have nearly identical CVs when employing
traditional voltammetric waveforms (Heien, et al., 2003). Therefore, careful practice of FSCV
requires the use of additional identification criteria in vivo (Millar, et al., 1985; Phillips &
19
verification. First, pharmacological manipulation with analyte-specific drugs can confirm signal
identity. In particular, routine norepinephrine measurements utilize both dopamine- and
norepinephrine-specific drugs to ensure the measurements do not arise from mixed
catecholamine signals (Fox et al., 2017; Park et al., 2011). Second, different brain regions
express different neurotransmitter content and release (Fox & Wightman, 2017; Nicola &
Malenka, 1998); therefore, anatomical specificity can be provided when measurements are
made in regions where one neurotransmitter dominates (Park et al., 2010; Park et al., 2013).
Accuracy
Phasic dopamine signals measured with FSCV have been shown to be dependent on
burst firing of dopaminergic neurons (Sombers et al., 2009). During impulse-dependent release,
more than 90% of dopamine spills out of the synapse within <100 µs (Garris et al., 1994).
Correspondingly, measurements in the extracellular space depend on a balance of dopamine
release, diffusion, and uptake, rather than directly representing synaptic concentrations (which
are three to six orders of magnitude higher) (Cragg & Rice, 2004; Garris, et al., 1994). However,
these signals have functional relevance, as a significant population of dopamine receptors and transporters is found outside of the synaptic cleft, supporting the role of dopamine as a ‘volume
neurotransmitter’ (Caille et al., 1996; Levey et al., 1993; Sesack et al., 1994). Therefore, the
chemoanalytical power of FSCV to transduce neurochemical measurements into analyte
concentrations is valuable, and the determination of accurate concentrations with FSCV is an
important experimental aim.
The accuracy of determined concentrations depends primarily on two factors: 1) the
ability of PCR to extract analyte current reliably from complex data and 2) the suitability of the
20 Accuracy of PCR signal extraction
Before concentrations of neurotransmitter can be reliably estimated, its faradaic current
must be separating from other interferents in the signal (e.g. pH, noise). The standard means of
achieving this is through the use of PCR (Heien, et al., 2005; Rodeberg et al., 2017). PCR
requires accurate knowledge of the CV characteristics for each analyte in the training set. Therefore, ‘pure’ analyte CVs are typically collected post-experiment with electrical stimulation,
a process known to evoke both neurotransmitter release and pH changes. (Fox, et al., 2017;
Heien, et al., 2005; Venton et al., 2003a). Moreover, the use of CVs from the same recording
environment (i.e. same electrode, brain environment, and equipment) allows reasonable
estimations of noise levels for the recording session, which is an important parameter for model
validation (Johnson et al., 2016; Keithley, et al., 2009).
However, there are a few limitations to the use of PCR. Training sets may vary between
experimenters and labs, as the selection of CV standards for the training set involves a degree of subjectivity (Keithley et al., 2010). Additionally, the use of ‘unrepresentative’ CVs in the
training set can impede model performance. The development of chronically-implanted
microelectrodes, with the aim of longitudinal measurements over weeks to months of recording,
has required modifications to PCR use due to experimental limitations (Clark, et al., 2010;
Rodeberg, et al., 2017). Post-experiment electrical stimulation is not typically feasible at these
electrodes, due to both concerns with long-term functionality of the stimulating electrode and the
potential impact of electrical stimulation on sustained behavior (Rodeberg, et al., 2017). The most widely used solution is to build ‘standard’ training sets at separate electrodes to analyze all
subsequent data. However, the application of these types of training sets appears to
systematically underestimate concentrations, which suggests that signal extraction (and thus
concentration estimation) is impaired with these models (Johnson, et al., 2016; Keithley &
Wightman, 2011; Rodeberg et al., 2015). Current investigations are underway to improve
21 Accuracy of external calibration factors
After analyte concentrations are extracted, they are converted to concentrations using a
calibration factor obtained in vitro (i.e. a flow cell); therefore, the accuracy of FSCV
measurements is also tied to the similarity of in vivo and in vitro conditions. In comparison to
constant-potential amperometry, the diffusion layer of FSCV measurements is very small (~3
µm) due to its rapid scan rates. As a result, measurements in flow cell are flow-rate
independent, which permits in vitro measurements to be representative of efflux in vivo
(Kawagoe, et al., 1993; Venton, et al., 2002).
Nonetheless, there are other issues with estimation of calibration factors. CFMs have
been demonstrated to lose sensitivity after implantation into brain tissue (Logman et al., 2000).
Consequently, postcalibration (i.e. generation of calibration curves following implantation) is
standard for in vivo measurements. Ideally, this calibration is done for each individual CFM to
capture variability between different electrodes. However, in some cases the CFM is
deliberately destroyed with a high electrolytic current to create lesions for precise marking of the
recording location(Bucher, et al., 2014; Fox, et al., 2017). In these cases, an average
postcalibration factor obtained from several electrodes is used, with the assumption that it is
representative of all in vivo measurements. While this undoubtedly adds imprecision in
comparisons between different electrodes, it is unlikely to affect interpretation of measurements
made within single recording sessions, as previous work has suggested that the majority of this
sensitivity loss occurs immediately upon insertion into tissue (Capella et al., 1990; Ewing, et al.,
1981; Michael et al., 1987) with no significant differences in sensitivity seen between
subsequent implant durations (Clark, et al., 2010; Rodeberg, et al., 2016; Singh et al., 2011).
Notably, electrode coatings measurements have been suggested to prevent this loss of
sensitivity in vivo (Cahill et al., 1996; Singh, et al., 2011; Vreeland, et al., 2015). In either case,
postcalibration sensitivity also depends on treatment of the electrode post-removal from the
22
sensitivity, but likely makes these measurements less representative of the tissue environment
in which measurements were made.
Fouling of the electrode surface is not the only factor that can alter sensitivity at CFMs.
Application of voltammetric waveforms, particularly ones with high anodic limits, has been
shown to generate surface oxide groups that augment sensitivity towards dopamine and other
species (Hafizi, et al., 1990; Heien, et al., 2003; Roberts, et al., 2010). Common practice is to therefore ‘cycle’ waveforms at high repetition frequencies to hasten the conditioning of the
electrode surface to promote CFM stability over the course of subsequent measurements.
Long-term stability of the CFM sensitivity is of particular concern for chronically-implanted
CFMs, which are used for weeks to months of recordings (Clark, et al., 2010; Rodeberg, et al.,
2017). Extended anodic limits have been shown to regenerate the CFM surface (Takmakov, et
al., 2010b). While this process should maintain sensitivity by replacing damaged surface
functional groups, this process is concomitant with loss of carbon from the surface. Therefore,
surface area is deteriorated over prolonged use; for the standard in vivo dopamine waveform
(-0.4 V to +1.3 V), the carbon fiber completely disappears after approximately 1.4 x 10⁷ scans
(Takmakov, et al., 2010b). Assuming one hour of cycling (60 Hz) before measurements and 90
min of recording (10 Hz) for each CFM measurement, this means approximately 52 sessions
can be carried out before complete CFM degradation. While standard measurements with
chronic CFMs seldom approach this limit, it is probable that a gradient of sensitivity loss exists
as the CFM is etched away. Therefore, methods to track sensitivity over time at a CFM in vivo
would be extremely valuable. The two contemporary methods that attempt to address this
concern involve tracking the magnitude of the background current, which is also proportional the
surface area of the CFM (Roberts et al., 2013), and using a proven stimulus (e.g. unexpected
food reward) to evoke dopamine release and track its magnitude over time, which rests on the
23
Rodeberg, et al., 2017). Future studies using more rigorously controlled stimuli (i.e. optogenetic
stimulation) could test the stability of CFMs over prolonged use more meticulously.
CONCLUSIONS & FUTURE DIRECTIONS
Fast-scan cyclic voltammetry is an attractive tool for the real-time monitoring of
neurochemicals in vivo. It has been demonstrated to have sufficient sensitivity and temporal
resolution to track rapid signaling events on a timescale relevant to behavior. Moreover, the
technique is flexible, due to the ease of CFM modification and the ability to customize
voltammetric waveforms for enhanced sensitivity and/or selectivity. Nonetheless, the resolving
power and accuracy of this technique are areas for continued improvement.
A few current and future innovations may increase the widespread use of FSCV. The
introduction of chronically implanted CFMs has allowed measurements of dopamine over
previously unattainable timescales during behavioral and disease-based models (Clark, et al.,
2013; Clark, et al., 2010; Covey et al., 2016). Multimodal measurements that combine FSCV
with iontophoresis and electrophysiology recordings at the same CFM have permitted
unprecedented insights into dopamine signaling (Belle et al., 2013; Kirkpatrick et al., 2016;
Owesson-White et al., 2016). Lastly, past and current development of carbon-based arrays
permits multiplexed FSCV recordings collection from several sites in vivo, which could cultivate
unique knowledge regarding signaling and pharmacological heterogeneity in single brain
structures (Parent et al., 2017; Schwerdt et al., 2017; Zachek et al., 2010). These advances will
24
REFERENCES
Adams, R. N. (1976). Probing brain chemistry with electroanalytical techniques. Anal Chem, 48(14), 1126A-1138A.
Adams, R. N. (1990). In vivo electrochemical measurements in the CNS. Prog Neurobiol, 35(4), 297-311.
Alsmeyer, Y. W., & McCreery, R. L. (1991). Surface enhanced Raman examination of carbon electrodes: effects of laser activation and electrochemical pretreatment. Langmuir, 7(10), 2370-2375.
Amatore, C., Jutand, A., & Pflüger, F. (1987). Nanosecond time resolved cyclic voltammetry: Direct observation of electrogenerated intermediates with bimolecular diffusion controlled decay using scan rates in the megavolt per second range. J Electroanal Chem, 218(1-2), 361-365.
Armstrong-James, M., & Millar, J. (1979). Carbon fibre microelectrodes. J Neurosci Methods, 1(3), 279-287.
Armstrong-James, M., Millar, J., & Kruk, Z. (1980). Quantification of noradrenaline iontophoresis. Nature, 288(5787), 181-183.
Atcherley, C. W., Vreeland, R. F., Monroe, E. B., Sanchez-Gomez, E., & Heien, M. L. (2013). Rethinking data collection and signal processing. 2. Preserving the temporal fidelity of electrochemical measurements. Anal Chem, 85(16), 7654-7658.
Banks, C. E., Davies, T. J., Wildgoose, G. G., & Compton, R. G. (2005). Electrocatalysis at graphite and carbon nanotube modified electrodes: edge-plane sites and tube ends are the reactive sites. Chem Commun (Camb)(7), 829-841.
Bard, A. J., & Faulkner, L. R. (2001). Electrochemical methods: Fundamentals and applications (2nd ed.). New York: Wiley.
Bath, B. D., Martin, H. B., Wightman, R. M., & Anderson, M. R. (2001). Dopamine Adsorption at Surface Modified Carbon-Fiber Electrodes. Langmuir, 17(22), 7032-7039.
Bath, B. D., Michael, D. J., Trafton, B. J., Joseph, J. D., Runnels, P. L., & Wightman, R. M. (2000). Subsecond adsorption and desorption of dopamine at carbon-fiber microelectrodes. Anal Chem, 72(24), 5994-6002.
Baur, J. E., Kristensen, E. W., May, L. J., Wiedemann, D. J., & Wightman, R. M. (1988). Fast-scan voltammetry of biogenic amines. Anal Chem, 60(13), 1268-1272.
Beaulieu, J.-M., & Gainetdinov, R. R. (2011). The physiology, signaling, and pharmacology of dopamine receptors. Pharmacol Rev, 63(1), 182-217.
25
Brazell, M. P., Kasser, R. J., Renner, K. J., Feng, J., Moghaddam, B., & Adams, R. N. (1987). Electrocoating carbon fiber microelectrodes with Nafion improves selectivity for electroactive neurotransmitters. J Neurosci Methods, 22(2), 167-172.
Bucher, E. S., et al. (2014). Medullary norepinephrine neurons modulate local oxygen concentrations in the bed nucleus of the stria terminalis. J Cereb Blood Flow Metab, 34(7), 1128-1137.
Bucher, E. S., & Wightman, R. M. (2015). Electrochemical analysis of neurotransmitters. Annu Rev Anal Chem, 8, 239-261.
Cahill, P. S., Walker, Q. D., Finnegan, J. M., Mickelson, G. E., Travis, E. R., & Wightman, R. M. (1996). Microelectrodes for the measurement of catecholamines in biological systems.
Anal Chem, 68(18), 3180-3186.
Caille, I., Dumartin, B., & Bloch, B. (1996). Ultrastructural localization of D1 dopamine receptor immunoreactivity in rat striatonigral neurons and its relation with dopaminergic innervation. Brain Res, 730(1-2), 17-31.
Capella, P., Ghasemzadeh, B., Mitchell, K., & Adams, R. N. (1990). Nafion‐coated carbon fiber electrodes for neurochemical studies in brain tissue. Electroanalysis, 2(3), 175-182.
Cheer, J. F., Wassum, K. M., Heien, M. L., Phillips, P. E., & Wightman, R. M. (2004). Cannabinoids enhance subsecond dopamine release in the nucleus accumbens of awake rats. J Neurosci, 24(18), 4393-4400.
Cheng, H.-Y., Schenk, J., Huff, R., & Adams, R. (1979). In vivo electrochemistry: behavior of micro electrodes in brain tissue. J Electroanal Chem, 100(1-2), 23-31.
Clark, J. J., Collins, A. L., Sanford, C. A., & Phillips, P. E. (2013). Dopamine encoding of Pavlovian incentive stimuli diminishes with extended training. J Neurosci, 33(8), 3526-3532.
Clark, J. J., et al. (2010). Chronic microsensors for longitudinal, subsecond dopamine detection in behaving animals. Nat Methods, 7(2), 126-129.
Conti, J., Strope, E., Adams, R., & Marsden, C. (1978). Voltammetry in brain tissue: chronic recording of stimulated dopamine and 5-hydroxytryptamine release. Life Sci, 23(27-28), 2705-2715.
Covey, D. P., Dantrassy, H. M., Zlebnik, N. E., Gildish, I., & Cheer, J. F. (2016). Compromised Dopaminergic Encoding of Reward Accompanying Suppressed Willingness to Overcome High Effort Costs Is a Prominent Prodromal Characteristic of the Q175 Mouse Model of Huntington's Disease. J Neurosci, 36(18), 4993-5002.
Cragg, S. J., & Rice, M. E. (2004). DAncing past the DAT at a DA synapse. Trends Neurosci, 27(5), 270-277.
26
Dankoski, E. C., & Wightman, R. M. (2013). Monitoring serotonin signaling on a subsecond time scale. Front Integr Neurosci, 7, 44.
Dengler, A. K., Wightman, R. M., & McCarty, G. S. (2015). Microfabricated Collector-Generator Electrode Sensor for Measuring Absolute pH and Oxygen Concentrations. Anal Chem, 87(20), 10556-10564.
DuVall, S. H., & McCreery, R. L. (1999). Control of Catechol and Hydroquinone Electron-Transfer Kinetics on Native and Modified Glassy Carbon Electrodes. Anal Chem, 71(20), 4594-4602.
DuVall, S. H., & McCreery, R. L. (2000). Self-catalysis by Catechols and Quinones during Heterogeneous Electron Transfer at Carbon Electrodes. J Am Chem Soc, 122(28), 6759-6764.
Ewing, A. G., Bigelow, J. C., & Wightman, R. M. (1983). Direct in vivo monitoring of dopamine released from two striatal compartments in the rat. Science, 221(4606), 169-171.
Ewing, A. G., Dayton, M. A., & Wightman, R. M. (1981). Pulse voltammetry with microvoltammetric electrodes. Anal Chem, 53(12), 1842-1847.
Feng, J. X., Brazell, M., Renner, K., Kasser, R., & Adams, R. N. (1987). Electrochemical pretreatment of carbon fibers for in vivo electrochemistry: effects on sensitivity and response time. Anal Chem, 59(14), 1863-1867.
Fitch, A., & Evans, D. H. (1986). Use of microelectrodes for the study of a fast chemical step in an electrode reaction. J Electroanal Chem, 202(1-2), 83-92.
Floresco, S. B., West, A. R., Ash, B., Moore, H., & Grace, A. A. (2003). Afferent modulation of dopamine neuron firing differentially regulates tonic and phasic dopamine transmission. Nat Neurosci, 6(9), 968-973.
Fox, M. E., Rodeberg, N. T., & Wightman, R. M. (2017). Reciprocal Catecholamine Changes during Opiate Exposure and Withdrawal. Neuropsychopharmacology, 42(3), 671-681.
Fox, M. E., & Wightman, R. M. (2017). Contrasting Regulation of Catecholamine Neurotransmission in the Behaving Brain: Pharmacological Insights from an Electrochemical Perspective. Pharmacol Rev, 69(1), 12-32.
Garris, P. A., Ciolkowski, E. L., Pastore, P., & Wightman, R. M. (1994). Efflux of dopamine from the synaptic cleft in the nucleus accumbens of the rat brain. J Neurosci, 14(10), 6084-6093.
Garris, P. A., & Wightman, R. M. (1995). Distinct pharmacological regulation of evoked dopamine efflux in the amygdala and striatum of the rat in vivo. Synapse, 20(3), 269-279.
27
Gonon, F., Buda, M., Cespuglio, R., Jouvet, M., & Pujol, J.-F. (1980). In vivo electrochemical detection of catechols in the neostriatum of anaesthetized rats: dopamine or DOPAC? Nature, 286(5776), 902-904.
Gonon, F., et al. (1978). Mesure électrochimique continue de la libération de dopamine réalisée in vivo dans le néostriatum du rat. CR Acad. Sci. Paris, 286, 1203-1206.
Gonon, F., Fombarlet, C., Buda, M., & Pujol, J. F. (1981). Electrochemical treatment of pyrolytic carbon fiber electrodes. Anal Chem, 53(9), 1386-1389.
Grace, A. (1991). Phasic versus tonic dopamine release and the modulation of dopamine system responsivity: a hypothesis for the etiology of schizophrenia. Neuroscience, 41(1), 1-24.
Gratton, A., & Wise, R. A. (1994). Drug- and behavior-associated changes in dopamine-related electrochemical signals during intravenous cocaine self-administration in rats. J Neurosci, 14(7), 4130-4146.
Hafizi, S., Kruk, Z. L., & Stamford, J. A. (1990). Fast cyclic voltammetry: improved sensitivity to dopamine with extended oxidation scan limits. J Neurosci Methods, 33(1), 41-49.
Heien, M. L., Johnson, M. A., & Wightman, R. M. (2004). Resolving neurotransmitters detected by fast-scan cyclic voltammetry. Anal Chem, 76(19), 5697-5704.
Heien, M. L., et al. (2005). Real-time measurement of dopamine fluctuations after cocaine in the brain of behaving rats. Proc Natl Acad Sci U S A, 102(29), 10023-10028.
Heien, M. L., Phillips, P. E., Stuber, G. D., Seipel, A. T., & Wightman, R. M. (2003). Overoxidation of carbon-fiber microelectrodes enhances dopamine adsorption and increases sensitivity. Analyst, 128(12), 1413-1419.
Hermans, A., Keithley, R. B., Kita, J. M., Sombers, L. A., & Wightman, R. M. (2008). Dopamine detection with fast-scan cyclic voltammetry used with analog background subtraction.
Anal Chem, 80(11), 4040-4048.
Howell, J. O., Kuhr, W. G., Ensman, R. E., & Wightman, R. M. (1986). Background subtraction for rapid scan voltammetry. J Electroanal Chem, 209(1), 77-90.
Howell, J. O., & Wightman, R. M. (1984). Ultrafast voltammetry and voltammetry in highly resistive solutions with microvoltammetric electrodes. Anal Chem, 56(3), 524-529.
Jackson, B. P., Dietz, S. M., & Wightman, R. M. (1995). Fast-scan cyclic voltammetry of 5-hydroxytryptamine. Anal Chem, 67(6), 1115-1120.
Jacobs, C. B., Ivanov, I. N., Nguyen, M. D., Zestos, A. G., & Venton, B. J. (2014). High temporal resolution measurements of dopamine with carbon nanotube yarn microelectrodes. Anal
Chem, 86(12), 5721-5727.