Chimeric antigen receptor (CAR) T cells have shown great promise in the treatment of hematologic malig-nancies but more variable results in the treatment of solid tumors and the persistence and expansion of CAR T cells within patients has been identified as a key correlate of antitumor efficacy. Lack of immunological “space”, functional exhaustion, and deletion have all been pro-posed as mechanisms that hamper CAR T-cell persis-tence. Here we describe the events following activation of third-generation CAR T cells specific for GD2. CAR T cells had highly potent immediate effector functions without evidence of functional exhaustion in vitro, although reduced cytokine production reversible by PD-1 blockade was observed after longer-term culture. Significant activation-induced cell death (AICD) of CAR T cells was observed after repeated antigen stimulation, and PD-1 blockade enhanced both CAR T-cell survival and promoted killing of PD-L1+ tumor cell lines. Finally,
we assessed CAR T-cell persistence in patients enrolled in the CARPETS phase 1 clinical trial of GD2-specific CAR T cells in the treatment of metastatic melanoma. Together, these data suggest that deletion also occurs in vivo and that PD-1-targeted combination therapy approaches may be useful to augment CAR T-cell effi-cacy and persistence in patients.
Received 16 December 2015; accepted 23 March 2016; advance online publication 19 April 2016. doi:10.1038/mt.2016.63
INTRODUCTION
Chimeric antigen receptor (CAR) T cells are a promising new technology in the field of cancer immunotherapy. Early clini-cal data in patients with hematologic malignancies has been
encouraging,1,2 however CAR T-cell treatment of patients with
solid tumors has had limited success.3–5 More work is needed to
optimize CAR T-cell therapy in general, and how best to ensure the antitumor efficacy of CAR T cells in solid tumor patients is less clear. For B-cell malignancies, a systematic review has identified preconditioning chemotherapy and CD19-specific CAR T-cell
persistence as positively influencing progression-free survival.6
In neuroblastoma patients receiving first-generation GD2-specific CAR T cells, better clinical outcomes were observed in those
patients with CAR T cells detectable in blood beyond 6 weeks.4,7
These findings indicate that CAR T-cell persistence is essential for positive patient outcomes.
Lack of CAR T-cell persistence has been attributed to several factors. In early clinical trials of CAIX-, CD19-, or CD20-specific CAR T cells, limited persistence postinfusion was observed, and
suggested that immune-mediated deletion may have occurred.5,8,9
Other groups have identified activation-induced cell death
(AICD) resulting from IgG CH2CH3 region-derived spacer
ele-ments of the CAR binding the Fc-receptor on innate immune cells as a factor in lack of CAR T-cell persistence in preclinical
models.10–12 AICD of tumor-specific T cells may also occur in the
absence of Fc-receptor-engaging chimeric antigen receptors when
T cells encounter cognate antigens.13,14 Although these processes
are central to T-cell homeostasis, they may also limit CAR T-cell therapies that induce potent T-cell activation via multiple
intra-cellular signaling domains.15,16,17
Suppression or exhaustion of T cells can also contribute to failure of CAR T-cell expansion and persistence, and may partly be mediated by PD-1/PD-L1 interactions, which attenuate T-cell
responses after antigen18–20 encounter.18–20 Preclinical studies in a
Her2+ mouse tumor model have indicated that PD-1 is
upregu-lated on CAR T cells in vivo and can contribute to a lack of
effi-cacy.21 In one recent paper, exhaustion resulting from tonic CAR
1135
1149
Activation-induced Cell Death in GD2-specific CAR T Cells
Molecular Therapy 10.1038/mt.2016.63
00
jun2016
24
6
16December2015
23March2016
© The American Society of Gene & Cell Therapy
Correspondence: Tessa Gargett, Centre for Cancer Biology, SA Pathology, and University of South Australia, Level 4 Hanson Institute Building, Frome
Road, Adelaide, SA, 5000, South Australia. E-mail: [email protected]
GD2-specific CAR T Cells Undergo Potent
Activation and Deletion Following Antigen
Encounter but can be Protected From
Activation-induced Cell Death by PD-1 Blockade
Tessa Gargett
1, Wenbo Yu
1, Gianpietro Dotti
2,3, Eric S Yvon
2,4, Susan N Christo
5, John D Hayball
5,6,7,
Ian D Lewis
7, Malcolm K Brenner
2and Michael P Brown
1,7,81Translational Oncology Laboratory Centre for Cancer Biology, SA Pathology, and University of South Australia, Adelaide, South Australia; 2Center for Cell
and Gene Therapy, Baylor College of Medicine, Texas Children’s Hospital, and Houston Methodist Hospital, Feigin Center, Houston, Texas, USA; 3 Department
of Microbiology and Immunology and Lineberger Comprehensive Cancer Center, University of North Carolina, Chapel Hill, North Carolina, USA;
4 Department of Stem Cell Transplantation and Cellular Therapy, The University of Texas MD Anderson Cancer Center, Houston, Texas, USA; 5 Experimental
signaling was identified in GD2-specific CAR T cells, although this may be specific to both the single chain variable fragment (scFv) in question (14g2a) and the intracellular signaling domains of the CAR, with CD28 promoting, and 41BB reducing, CAR
T-cell exhaustion.22
Thus, the relative importance of factors that can limit CAR T-cell persistence remains unclear. Among these factors, functional exhaustion and AICD have been identified in preclinical in vitro and in vivo models, and CAR-specific immune responses not perform-ing prior lymphodeletion have been found to reduce CAR T-cell persistence in patients. Hence, we considered it important to fully
define the effects of our third-generation CAR encoding CD3ζ,
CD28, and OX40 on T-cell activation, viability, and function in vitro in order to identify factors that may influence CAR T-cell per-sistence in patients. Importantly, our vector incorporates both the
14g2a scFv and the problematic IgG CH2CH3 spacer identified by
others as discussed above. Accordingly, we used samples obtained in preparation of and during the conduct of the CARPETS trial, a phase 1 clinical trial of third-generation GD2-specific, iCasp9-expressing, autologous peripheral blood CAR T cells (GD2-iCAR-PBT) in patients with metastatic melanoma, to better understand the events that occur during GD2-iCAR PBT activation.
Here, we show that GD2-iCAR T cells undergo rapid acti-vation after antigen stimulation; demonstrate potent effector functions and only transient expression of markers of T-cell exhaustion. While we did not observe CAR tonic signaling lead-ing to significant functional exhaustion, we did find clear evidence of reduced cytokine secretion and AICD after repeated stimula-tion. In this report, we also aimed to identify practical ways of improving the effectiveness of CAR T cells and so we tested the recently approved melanoma therapeutic, pembrolizumab, an anti-PD-1 monoclonal antibody (mAb), for its ability to promote CAR T-cell survival and function. Importantly, PD-1 blockade was able to preserve cytokine secretion and prevent CAR T-cell AICD in vitro. We have also monitored CAR T-cell persistence and immune phenotype in four CARPETS trial patients. The data presented here offer a strong scientific rationale for an anti-PD-1/ CART-cell combination therapy approach in clinical trials of GD2-specific CAR T-cell therapy.
RESULTS
GD2-specific CAR T cells do not constitutively express PD-1 or LAG-3 and are not functionally exhausted
To understand what occurs to the GD2-iCAR T cells when they encounter antigen, we first analyzed markers of activation and exhaustion after stimulation in vitro. We tracked these markers during each step of the GD2-iCAR T-cell manufacturing process: initial activation of peripheral blood mononuclear cells (PBMC), retroviral transduction of the activated T cells with the
vec-tor SFG.iCasp9.2A.14g2a.CD28.OX40.ζ, subsequent expansion
of the CAR T-cell product in IL-7 and IL-15.23 We also assessed
marker expression after cryopreservation, and upon restimula-tion of the thawed CAR T-cell product (Figure 1). GD2-iCAR T cells manufactured by this process had a predominately effector or effector memory phenotype, with smaller proportions of naive
or central memory T cells.23 Further experiments described in
this paper use patient-matched PBMC and nontransduced T cells
(NT T cells) as controls. NT controls were subject to the same expansion conditions as CAR T cells and have a similar effector memory phenotype, whereas PBMC have been gradient-puri-fied but are otherwise unmanipulated. We observed high levels of CD25, CD69, PD-1, and LAG3 expression during the initial activation, but only low levels of these markers on resting CAR T cells. CD25, CD69, PD-1, and LAG3 were upregulated again following restimulation of CAR T cells after cryopreservation, but to a lesser extent. Interestingly, direct restimulation of the CAR T cells via the CAR with the 1A7 anti-idiotypic antibody produced higher and more sustained levels of PD-1 expression on the cul-tured T cells for Patients 101 and 102, compared to stimulation via CD3 and CD28 endogenous receptors (Figure 1d). This suggests that a more exhausted or less functional phenotype is induced by CAR signaling and although CAR T cells are not exhausted upon administration, they may become so after antigen encounter in vivo. Minimal TIM-3 expression was detected on CAR T cells during expansion or restimulation (data not shown).
The use of the term “exhausted” to describe T cells expressing markers such as PD-1 remains controversial and may instead
rep-resent T cells undergoing chronic antigen stimulation.24,25 A better
measure of whether T cells are truly exhausted is their functional
capacity after stimulation.18 CAR T cells demonstrate potent
effec-tor functions including cytokine secretion, particularly of IFNγ and
TNFα, cytotoxic activity and proliferative functions following a
3-day stimulation (Figure 2, see Supplementary Figure S2) and thus
show no evidence of functional exhaustion. Others have reported decreased function of CAR T cells following longer-term cultures and so we rested CAR T cells for 4 days and then stimulated for a fur-ther 3 days with anti-CAR or anti-CD3/CD28 antibodies. On day 10,
there were significantly reduced levels of IFNγ and TNFα, IL-6 and
IL-10 production, and a complete loss of IL-2 production. Inclusion of pembrolizumab (anti-PD-1 mAb) in the repeated stimulation
cultures was able to restore IFNγ and TNFα production, although
IL-2 production was not rescued (Figure 2a–f). Reduced cytokine production following repeated stimulation was also observed for NT control T cells, and thus was not an intrinsic function of CAR sig-naling but rather a global effect resulting from long-term culture of
T cells (see SupplementaryFigure S2a). Cytotoxic T Lymphocyte
(CTL) activity, on the other hand, was not significantly reduced after culture and restimulation, and the inclusion of anti-PD-1 mAb pro-vided only modest enhancement (Figure 2g,h). Likewise,
prolifera-tion was not enhanced by PD-1 blockade (SupplementaryFigure
S2b,c). Thus GD2-iCAR T cells are not functionally exhausted, and
do not become so after long-term culture and repeated stimulation. However, they do lose some of their functional capacity for multiple cytokine secretion suggestive of a more terminally differentiated phenotype, and PD-1 blockade partially restores this function.
Observations of long-term (>7 days) culture also revealed that GD2-iCAR T-cell proliferation required either exogenous cytokine or stimulation of CD3/CD28 or CAR and was not
constitutive, as has been reported for other CAR constructs.26
Following CAR-specific stimulation, the proportion of viable CAR-expressing cells decreased, the proportion of nonviable CAR-expressing cells increased and the remaining viable popula-tion had lower levels of CAR expression as measured by 1A7-PE
GD2-specific CAR T cells have basal levels of activation, and CAR engagement results in a rapid induction of downstream signaling events
To better understand the events following GD2-iCAR T-cell activa-tion, we compared CAR T cells stimulated either by their CAR or CD3/CD28 molecules with NT controls and normal PBMC from the
same patient (Figure 3 and SupplementaryFigure S3). As reported
previously,27 we observed distinct differences in the levels and timing
of calcium flux, with flux occurring immediately after CAR engage-ment without the requireengage-ment for cross linking (Figure 3a–c). We also found that CAR stimulation resulted in more rapid ERK phos-phorylation, which was detectable at levels above unstimulated back-ground by 6 hours in stimulated CAR T cells compared to 48 hours for stimulated NT controls or PBMC (Figure 3d,e). Stimulated CAR
T cells were also more highly pERK+ when compared to stimulated
controls. Likewise, AKT was also more rapidly phosphorylated in
CAR T cells and pAKT was detectable at higher frequency in stimu-lated CAR T cells compared to controls (Figure 3f,g). There were also higher basal levels of phosphorylation for these two signaling molecules in unstimulated CAR cells, which suggests some level of
basal activation as identified by others.22 Conversely, peaks in
phos-phorylated Stat5 and 6 appeared at the same time after stimulation for CAR, NT controls, and PBMC although a greater percentage of
CAR T cells were pStat6+ and a lower percentage were pStat5+,
com-pared to controls (Figure 3h,i). Finally, the active form of caspase 3 was detected at 12 hours poststimulation for CAR T cells and NT controls, compared to 24 hours for PBMC (Figure 3j,k). Thus, the
CD28, OX40 and CD3ζ domains of the third-generation CAR result
in rapid activation and calcium flux of GD2-iCAR T cells without receptor cross-linking, and GD2-iCAR T cells have higher basal levels of activation that may make them more susceptible to AICD in vivo. Importantly, NT T-cell controls also displayed higher basal
Figure 1 Markers of activation and exhaustion on GD2-iCAR and paired nontransduced T cells in vitro. Patient peripheral blood mononuclear cells were activated, transduced with GD2-iCAR retroviral vector and expanded for 14 days before cryopreservation. Chimeric antigen receptor (CAR) T cells and nontransduced (NT) T-cell controls were manufactured from four patients with metastatic melanoma. Cells were then thawed and
restimu-lated. (a) CD25 and CD69 expression during culture. (b) PD-1 expression during culture. (c) LAG-3 expression during culture. (d) Difference in PD-1
expression after restimulation with 1A7 or -anti-CD3/CD28 antibodies. Representative data are shown for patient 101. All samples were analyzed in
duplicate, with graphs displaying mean ± standard error of the mean. The gating strategy is shown in Supplementary Figure S1.
100
80
% CD25+ and/or CD69+ T cells
60
40
20
0
100
80
% of PD-1+ T cells
60
40
20
0
0 3 7 10 14 0 3 7 10
Day
100
80
% of PD-1+ LAG-3+ T cells
60
40
20
0
100
80
% PD-1+ 1A7+ T cells
60
40
20
0
0 3 7 10 14 0 3 7 10 0 3 7 10 14 0 3 7
Day
Media only anti-CD3/CD28 anti-CAR (1A7) 10 14 0 3 7 10 14 Day
0 3 7 10 14 0 3 7 10
Day CD25 and CD69 expression
Activation of PBMC
Transduction Cryo-preservation
Thaw and restimulation
Activation of PBMC
Transduction Cryo-preservation
Thaw and restimulation
Activation of PBMC
Transduction Cryo-preservation
Thaw and restimulation PD-1 expression
LAG-3 expression PD-1 expression post re-stimulation
Anti-CD3/CD28
0
Count
0
Count
0 102
103 Comp-BV421-A: PD-1
PD-1 subset PD-1 subset
104 105
0 102 103 Comp-BV421-A: PD-1
104 105 GD2-iCAR 101
GD2-iCAR 102 GD2-iCAR 201 NT 101 NT 102 NT 201
GD2-iCAR 101 GD2-iCAR 102 GD2-iCAR 201 NT 101 NT 102 NT 201
Day 0 Day 3 Day 7 Day 10 Day 14 GD2-iCAR 101 GD2-iCAR 102 GD2-iCAR 201 NT 101 NT 102 NT 201
Anti-CAR (1A7)
a b
levels of pAKT than PBMC controls, as well as a more rapid activa-tion of caspase 3 poststimulaactiva-tion, which suggests that the activated phenotype is also due to the expansion culture conditions and not solely to CAR signaling. As previously noted, the culture conditions
generate a majority of effector/effector memory T cells.23
GD2-specific CAR T cells undergo AICD after repeated antigen stimulation
Given that CAR engagement with an anti-idiotypic antibody-induced marker of AICD, we wished to further explore the events following antigen encounter by CAR T cells, however
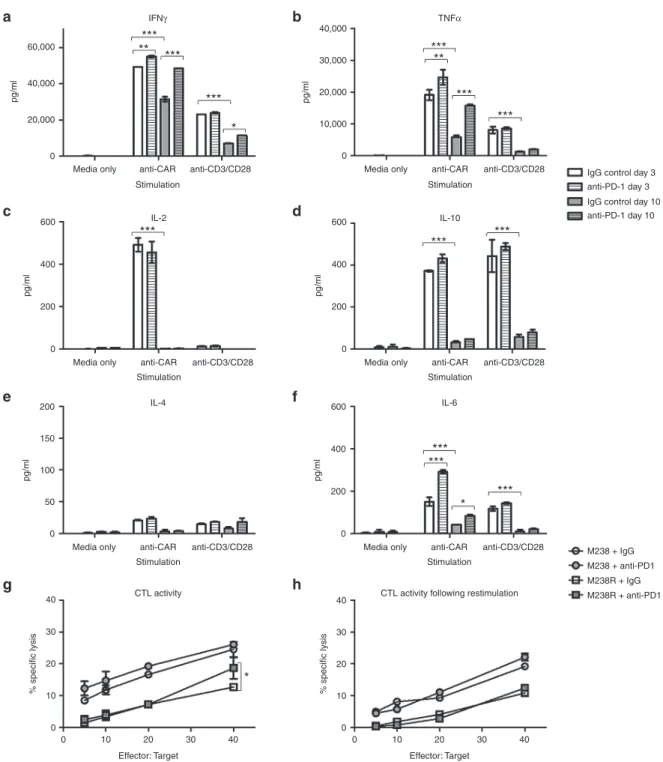
Figure 2 Functional capacity of GD2-iCAR T cells in vitro with or without PD-1 blockade. Thawed chimeric antigen receptor (CAR) T cells were stimulated via CD3/CD28 or CAR in the absence of exogenous cytokine and in the absence (white) or presence (gray) of 20 µg/ml anti-PD-1 block-ing antibody. Supernatants were collected after 3 days (day 3 plain bars) stimulation or 3 days after a restimulation on day 7 (Day 10, striped bars)
and diluted 1/10 prior to analysis for cytokine secretion. (a) IFNγ. (b) TNFα. (c) IL-2. (d) IL-10. (e) IL-4. (f) IL-6. (g) CAR T-cell killing of GD2+ PD-L1
-(M238, circles) and PD-L1 + (M238R, squares) melanoma cell lines ± 20 µg/ml anti-PD-1. Cells were thawed, rested overnight and then cultured
with 51Cr-labeled tumor lines for 6 hours. (h) CAR T-cell killing of melanoma cell lines on day 7 after 3 days of stimulation. Cells were thawed, rested
overnight and then stimulated with anti-CAR for 3 days and rested for 4 days before culture with 51Cr-labeled tumor lines for 6 hours. Flow samples
were analyzed in duplicate and 51Cr assays in triplicate. Representative data are shown for patient 101, and graph display mean ± standard error of
the mean. Cytokine secretion for nontransduced controls are shown in Supplementary Figure S2.
60,000
40,000
pg/ml
40,000
30,000
20,000
10,000
0 Media only anti-CAR
Stimulation
Stimulation
IFNγ TNFα
anti-CD3/CD28 Media only anti-CAR Stimulation
anti-CD3/CD28
*** ***
*** ***
*** **
*** **
*
pg/ml
20,000
0
pg/ml
0
Media only anti-CAR anti-CD3/CD28 200
400 600
Stimulation IL-10 IL-2
***
*** ***
pg/ml
0
Media only anti-CAR anti-CD3/CD28
IgG control day 3 anti-PD-1 day 3 IgG control day 10 anti-PD-1 day 10
M238 + IgG M238 + anti-PD1 M238R + IgG M238R + anti-PD1 200
400 600
Stimulation
pg/ml
0
Media only
Effector: Target
0 10
40
30
20
% specific lysis 10
0
40
30
20
% specific lysis 10
0
20 30 40
Effector: Target
0 10 20 30 40
*
anti-CAR anti-CD3/CD28 50
100 200
150
Stimulation IL-6 IL-4
CTL activity following restimulation CTL activity
*** ***
*** *
pg/ml
0
Media only anti-CAR anti-CD3/CD28 200
400 600
a b
c d
e f
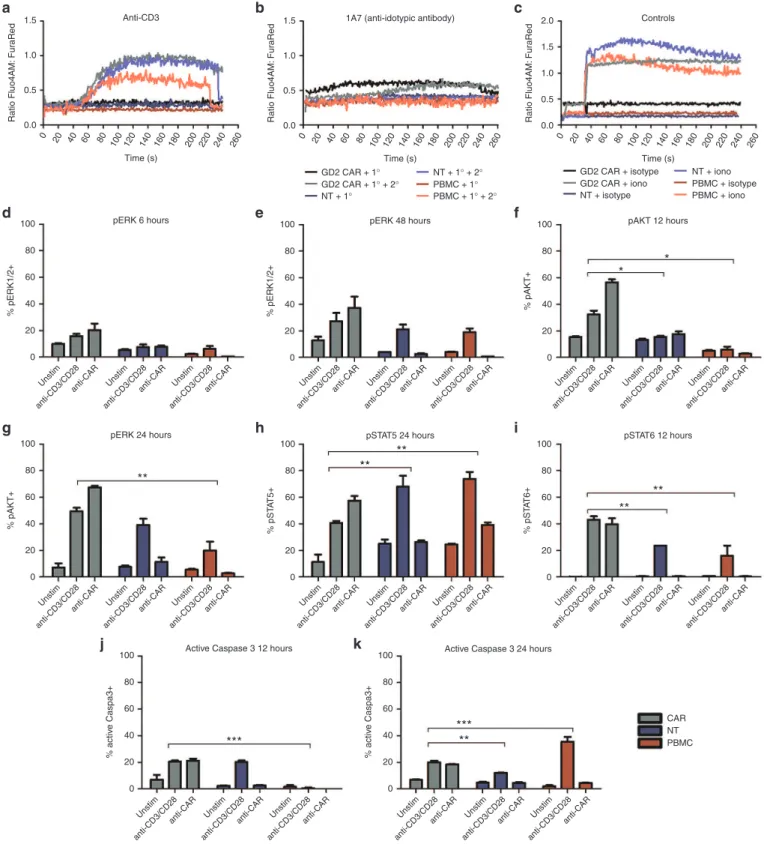
Figure 3 Comparison of downstream signaling events following chimeric antigen receptor (CAR) or CD3/CD28 stimulation. Calcium flux
after stimulation of thawed CAR T cells with primary (1°) antibodies specific for (a) the CAR (1A7) or (b) the CD3 (OKT3) receptors, with or without
cross-linking by antimouse IgG secondary (2°) antibodies. (c) Ionomycin and isotype control and a secondary antibody were used as positive and
negative controls, respectively. Anti-CD28 and anti-OX40 antibodies were also used in conjunction with anti-CD3 but did not induce markedly dif-ferent calcium flux compared to anti-CD3 alone (data not shown). CAR T cells, nontransduced (NT) T cells and peripheral blood mononuclear cells
(PBMC) were stimulated via CAR or CD3/CD28 receptors and analyzed for signaling molecule phosphorylation. (d) and (e) pERK+ T cells at 6 and
48 hours. (f) and (g) pAKT+ T cells 12 and 24 hours. (h) pSTAT5+ T cells at 24 hours. (i) pSTAT6+ T cells at 12 hours. (j) and (k) active caspase 3 in T
cells at 12 and 24 hours. CAR T cells and NT T cells and PBMC were tested in duplicate. Representative data are shown for patient 102, and graphs
display mean ± standard error of the mean. The gating strategy is shown in Supplementary Figure S3.
260 Unstim anti-CD3/CD28 anti-CAR Unstim anti-CD3/CD28 anti-CAR Unstim anti-CD3/CD28 anti-CAR Unstim anti-CD3/CD28 anti-CAR Unstim anti-CD3/CD28 anti-CAR Unstim anti-CD3/CD28 anti-CAR Unstim anti-CD3/CD28 anti-CAR Unstim anti-CD3/CD28 anti-CAR Unstim anti-CD3/CD28 anti-CAR Unstim anti-CD3/CD28 anti-CAR Unstim anti-CD3/CD28 anti-CAR Unstim anti-CD3/CD28 anti-CAR Unstim anti-CD3/CD28 anti-CAR Unstim anti-CD3/CD28 anti-CAR Unstim anti-CD3/CD28 anti-CAR Unsti m anti-CD3/CD28 anti-CAR Unsti m anti-CD3/CD28 anti-CAR Unsti m anti-CD3/CD28 anti-CAR Unsti m anti-CD3/CD28 anti-CAR Unsti m anti-CD3/CD28 anti-CAR Unsti m anti-CD3/CD28 anti-CAR Unstim anti-CD3/CD28 anti-CAR Unstim anti-CD3/CD28 anti-CAR Unstim anti-CD3/CD28 anti-CAR 240 220 200 180 160 140 120 100 80 60 40 20 0 1.5 Anti-CD3 Time (s) 1.0 0.5 Ratio Fluo4AM: FuraRe d 100 80 60 40 20 0 % pERK1/2+ 100 80 60 40 20 0 % pAKT+ 100 80 60 40 20 0 % activ e Caspa3+ 100 80 60 40 20 0 % activ e Caspa3+ 100 80 60 40 20 0 % pS TA T5+ 100 80 60 40 20 0 % pS TA T6+ 100 80 60 40 20 0 % pERK1/2+ 100 80 60 40 20 0 % pAKT+ 0.0 260 240 220 200 180 160 140 120 100 80 60 40 20 0
1.5 1A7 (anti-idotypic antibody)
Time (s) GD2 CAR + 1° GD2 CAR + 1° + 2°
NT + 1° + 2° PBMC + 1° PBMC + 1° + 2° NT + 1°
GD2 CAR + isotype GD2 CAR + iono
NT + iono PBMC + isotype PBMC + iono NT + isotype
1.0 0.5 Ratio Fluo4AM: FuraRe d 0.0 260 240 220 200 180 160 140 120 100 80 60 40 20 0 2.0 1.5 Controls
pERK 6 hours pERK 48 hours pAKT 12 hours
* * ** ** ** ** *** *** ** **
pERK 24 hours pSTAT5 24 hours
Active Caspase 3 12 hours Active Caspase 3 24 hours
CAR NT PBMC pSTAT6 12 hours
Time (s) 1.0 0.5 Ratio Fluo4AM: FuraRe d 0.0
a b c
d e f
g h
j k
it is difficult to model complex tumor environments in vitro. Prolonged or repeative antigen “stress-test” models of repeated
stimulation have been reported by others,22,28 and give results
that better correlate with in vivo data. We performed this “stress-test” assay with GD2-iCAR T cells from patients that were
repeatedly passaged onto GD2+ melanoma (M238 or M238R)
or GD2+ neuroblastoma (LAN-1) cells every 24 hours (Figure 4
and Supplementary Figure S4). At each transfer, the sur-vival of the tumor cells was analyzed by Annexin V and DAPI
(4′,6-Diamidino-2-Phenylindole, Dihydrochloride) staining,
and a sample of the CAR T-cell population was also retained for analysis of viability and activation markers (CD25 and CD69).
Using this assay, we found that the percentage of viable GD2-iCAR T cells decreased with each stimulation and this depended on the level of antigen expression because melanoma cell lines with lower GD2 expression (M238) induced lower levels of CAR T-cell
death compared to the highly GD2+ LAN-1 cell line (Figure 4a,b).
In order to identify potentially beneficial combination therapies, we then included the currently available antimelanoma therapy, pembrolizumab (anti-PD-1 mAb), in these cocultures to see whether it affected AICD. Anti-PD-1 mAb did not affect activa-tion levels but was able to completely restore CAR T-cell viability
to levels observed for CAR T cells cultured with GD2- cell lines
on days 1 and 2, although by day 3 this effect lessened (Figure 4c
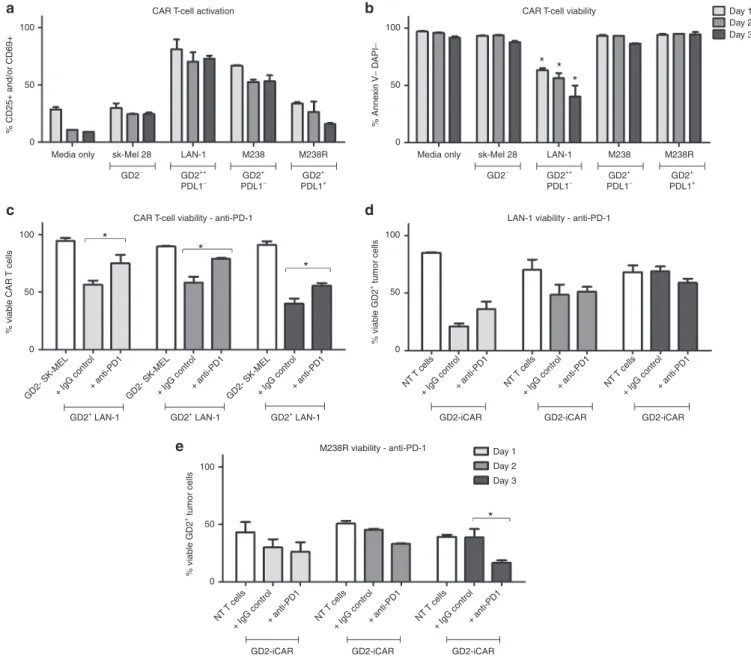
Figure 4 Activation-induced cell death (AICD) after repeated antigen stimulation of GD2-iCAR T cells with GD2+ tumor cells. Thawed chimeric antigen receptor (CAR) T cells were passaged daily onto tumor cells, and cells were collected at days 1, 2, and 3 for analysis of activation (CD25 and
CD69) and cell death (Annexin V and DAPI) by flow cytometry. SK-Mel cells provide a GD2- control and nontransduced (NT) T cells provided controls
lacking CAR expression. Anti-PD-1was included in some cultures. CAR T-cell activation (a) and viability (b) after repeated stimulation with tumor cell
lines. (c) CAR T-cell death after repeated stimulation by GD2hi neuroblastoma cell lines (LAN-1), with or without anti-PD-1. (d) CAR T-cell killing of
GD2hi PD-L1- neuroblastoma cells (LAN-1), with or without anti-PD-1. (e) CART-cell killing of GD2+PD-L1+ melanoma cells (M238R), with or without
anti-PD-1. Repetitive antigen stress-test assays were performed in duplicate. Representative data are shown for patient 101, and graphs display mean
± standard error of the mean. The gating strategy is shown in Supplementary Figure S4.
100
50
% CD25+ and/or CD69+
0
Media only sk-Mel 28 LAN-1
CAR T-cell activation CAR T-cell viability
CAR T-cell viability - anti-PD-1
*
*
* * *
*
*
LAN-1 viability - anti-PD-1
M238R viability - anti-PD-1
Day 1 Day 2 Day 3
Day 1 Day 2 Day 3 M238 M238R
GD2− GD2++
PDL1− GD2 +
PDL1− GD2 + PDL1+
100
50
% Anne
xin
V
−
D
API
−
0
100
50
GD2+ LAN-1 GD2+ LAN-1 GD2+ LAN-1
% viab
le CAR
T cells
0
GD2- SK-MEL+ IgG control+ anti-PD1 GD2- SK-MEL+ IgG control+ anti-PD1 GD2- SK-MEL+ IgG control+ anti-PD1
GD2-iCAR GD2-iCAR GD2-iCAR NT T cells
+ IgG control+ anti-PD1
GD2-iCAR NT T cells
+ IgG control+ anti-PD1
GD2-iCAR NT T cells
+ IgG control+ anti-PD1
GD2-iCAR NT T cells
+ IgG control+ anti-PD1 NT T cells
+ IgG control+ anti-PD1 NT T cells
+ IgG control+ anti-PD1 100
50
% viab
le GD2
+ tumor cells
0
100
50
% viab
le GD2
+ tumor cells
0
Media only sk-Mel 28 LAN-1 M238 M238R
GD2− GD2++
PDL1− GD2 +
PDL1− GD2 + PDL1+
a b
c
e
and Supplementary Figure S4c). PD-1 blockade also resulted
in enhanced killing of the PD-L1+ melanoma cell line (M238R,
Figure 4e), but not of the PD-L1- cell lines (LAN-1: Figure 4d,
M238: SupplementaryFigure S4d).
The third-generation CAR incorporates an inducible caspase 9 suicide gene (iCasp9) and it is possible that this could contribute to the AICD observed. To investigate this possibility, we gener-ated CAR T cells from the same patient PBMC using an earlier generation vector that encodes CD3ζ, CD28, and OX40 signal-ing domains but not iCasp9. These cells were found to be equally susceptible to AICD cell death when repeatedly stimulated with
GD2+ LAN-1 cells, 1A7 anti-idiotypic antibody or via CD3/CD28
(SupplementaryFigure S4e).
AICD is PD-1 dependent and can occur in the absence of tumor-derived PD-L1
In stimulation assays using plate-bound anti-CD3/CD28 or 1A7 antibodies, PD-1 blockade enhanced cytokine production (Figure 2), and in stress-test assays, PD-1 blockade promoted the
survival of CAR T cells after activation with the PD-L1- cell line
LAN-1 (Figure 4). This result suggested that homo- or hetero-typic interactions between PD-1-expressing T cells and T cells expressing PD-1 ligands such as PD-L1 might contribute to the observed AICD and suppression of T-cell function. Although PD-L1 expression on intratumoral lymphocytes has been recently
reported,20 we have not found previous reports of PD-L1
expres-sion on CAR T cells.
After stimulating the CAR T-cell product in vitro, we found that PD-L1 expression peaked at days 3–7 poststimulation
(Figure 5a). Given that PD-L1+ T cells have been little
charac-terized in the literature, we analyzed the PD-L1+ CAR T cells for
surface markers and function. We found that they had equiva-lent levels of activation marker expression and higher levels of PD-L2 and FASL expression but demonstrated lower levels of
proliferation and lower PD-1 and LAG-3 expression than PD-L1
-CAR T cells (Figure 5b). A transient PD-L1 and PD-1 double-positive population was observed on day 3 after stimulation, which accounted for 40% of the total GD2-iCAR PBT popula-tion. Freshly isolated PBMC expressed PD-L1 primarily on
non-CD3+ cells, including CD14+ macrophages, and PD-L1 was not
coexpressed with PD-1. However, when PBMC were activated with anti-CD3/CD28, ~40% of T cells were likewise found to coexpress PD-1 and PD-L1. We also noted that although PD-1
was more highly expressed on the CD4+ subset before and after
activation, its ligand, PD-L1, was expressed at equivalent levels
before activation and more highly on the CD8+ subset after
activa-tion (SupplementaryFigure S5a,b,d). Blockade of PD-L1 with a
specific mAb inhibited AICD significantly on day 1 of coculture,
but not on day 2 or day 3, and enhanced killing of the PD-L1+
M238R cell line, but not of the PD-L1- M238 and LAN-1 cell
lines (Figure 5e–h). Blockade of PD-L2 had no significant effect on CAR T-cell viability. We also performed knockdown of either PD-1 or PD-L1 by siRNA, but only achieved a transient reduc-tions in surface expression of 30–40%, however, there was a trend toward increased viability of CAR T-cells after PD-1 knockdown whereas PD-L1 knockdown significantly reduced CAR T-cell sur-vival (data not shown). We hypothesize that these different effects
relate to differences in PD-L1 forward and reverse signaling upon
binding to PD-1,29,30 with reverse signaling in PD-L1+ CD8 T cells
reportedly promoting survival.
Others have reported Fas Cell Surface Death Receptor and Ligand (FAS-FASL) interactions are critical for AICD of CAR T
cells.10,15 We found that CAR T cells have constitutively high FAS
expression, and upregulate intermediate levels of FASL after
activa-tion (see Supplementary Figure S5c). Blockade of FAS also resulted
in reduced AICD as expected (see Supplementary Figure S5e).
However, in some cases, when FAS-blocking antibody was added to the tumor cell coculture stress-test assay, tumor cells maintained
higher viability (see SupplementaryFigure S5f–h). Thus, blockade
of FAS or PD-1 interactions between CAR T cells can promote their survival, but only PD-1 blockade was found to consistently preserve CAR T-cell cytotoxic function.
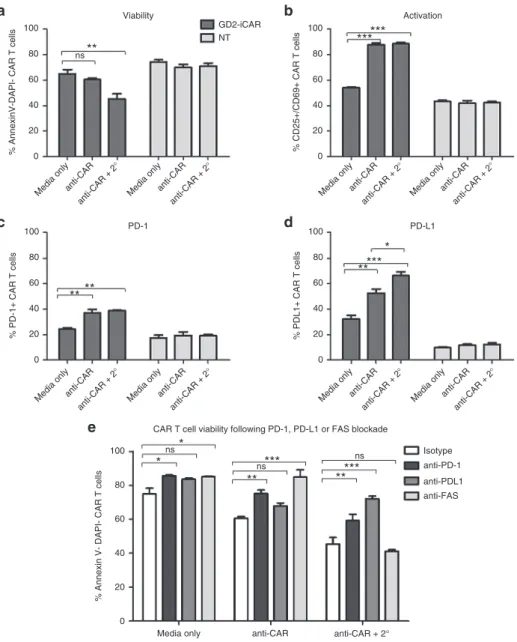
To isolate extrinsic signals provided by tumor cells during coculture from CAR T-cell-intrinsic signaling occurring after activation, we simulated repeated antigen engagement by cross-linking CAR-bound 1A7 antibody with a secondary antimouse IgG antibody (Figure 6). This result confirmed that direct CAR engagement could induce AICD in the absence of tumor cells because the percentage of cells undergoing AICD significantly increased when the 1A7 antibody was cross-linked by a second-ary antibody (Figure 6a,b). PD-L1 expression, but not PD-1 expression, was also significantly increased by cross-linking (Figure 6c,d). We found that blocking antibodies to both PD-1 and PD-L1 prevented AICD after cross-linking (Figure 6e), in agreement with the findings from the tumor coculture stress-test assays. In particular, anti-PD-L1 restored CAR T-cell viability to the level of unstimulated cells.
GD2-specific CAR T cells demonstrate limited persistence in patients and upregulate PD-1 and PD-L1 after infusion
We have examined patient-derived CAR T cells stimulated in vitro but although these experiments have identified some important potential factors in CAR T-cell persistence and efficacy but we cannot fully recapitulate the complex environment that influ-ences CAR T-cell persistence within patients. In the CARPETS study, we have the opportunity to observe the fate of CAR T cells administered to the first four patients enrolled in this trial. The first cohort of patients, 101 and 102, received single IV
injec-tions at dose level 1 of 1 × 10⁷ CAR T cells/m2 in conjunction with
dabrafenib therapy but with no prior lymphodepletion. After a protocol amendment, the second cohort of patients, 201 and
203, received single IV injections at dose level 2 of 2 × 10⁷ CAR
T cells/m2. Patient 201 received lymphodepleting fludarabine and
cyclophosphamide chemotherapy before the CAR T-cell infusion. Patient 203 received the CAR T-cell dose with dabrafenib and tra-metinib without prior lymphodepletion.
detection of peripheral blood CAR T cells followed a similar time-course, and serum cytokines also peaked at around day 7 postin-fusion with a transient increase in IL-6 observed for all patients
and an increase in IFNγ observed for Patient 102 (Figure 7a,c
and SupplementaryFigure S6b,c). The lympho-depleted Patient 201 showed more marked expansion of CAR T cells after infusion with a 10–100-fold increase in transgene copy number detected at days 7 and 14, compared to Patients 101 and 102, and a later peak in IL-6 around day 28. However, CAR T-cell numbers in the peripheral blood still declined from day 14 to day 42 and were only detectable at low levels by month 4. This suggests that fluda-rabine and cyclophosphamide conditioning improved expansion
but did not dramatically improve persistence of GD2-iCAR-PBT
cells in vivo. However, given that only one patient has received
preconditioning in this study so far, we cannot draw definitive conclusions.
Compared to PBMC drawn at the same time from the same patient, peripheral blood CAR T cells had an inverted CD4:CD8 ratio (Figure 7d), with CD8 T-cell frequency increased for all
patients except Patient 201 (see Supplementary Figure S1b).
Compared to the infused CAR T-cell product, which had a predominately effector-memory phenotype, the majority of peripheral blood CAR T cells had either an effector-memory or effector phenotype and also had upregulated expression of PD-1
Figure 5 PD-1/PD-L1-dependent activation-induced cell death (AICD) after activation of GD2-iCAR T cells. (a) PD-L1 expression on thawed
chimeric antigen receptor (CAR) T cells after stimulation in vitro. (b) Immune phenotype of CAR PD-L1+ and PD-L1- T cells at day 3 poststimulation.
Immune phenotype defined as: Naive (CD45RA+CCR7+), effector memory (Tem; ––CD45RA–CCR7–), central memory (Tcm; –CD45RA–CCR7+), effector
–(CD45RA+CCR7–), activated (CD25+/CD69+), proliferating (CFSE low). (c) CAR T-cell viability after repetitive stimulation with LAN-1. (d) GD2+PD-L1
-M238 tumor cell viability and (e) GD2++PD-L1- LAN-1 tumor cell viability and (f) GD2+PD-L1+ M238R tumor cell viability after stress-test assay with
PD-L1 blockade (anti-PD-L1). Repetitive antigen stress-test assays and flow cytometry analyses were performed in duplicate. Representative data are
shown for patient 101, and graphs display mean ± stanadard error of the mean. The gating strategy is shown in Supplementary Figure S5.
Media only CD3/CD28 anti-CAR (1A7)
0 3 7 10 14 0 3 7 10 14 0 3 7 10 14 Day
Naiv e
Tem Tcm
EffectorActivated Proli
ferating PD1+ LAG3 +
PD-L2+ FA S
FAS-L 100
80
60
% PD-L1+ 1A7+ T cells
40
20
0
100
CAR T cell PD-L1+ and PD-L1-subsets PD-L1 expression
Anti-CD3/CD28
0 0
Comp-PE-Cy7-A
Count Count
0102 10
3 10
4 10
5
Comp-PE-Cy7-A 0102
10 3
10 4
10 5
**
***
*** * *
PD-L1+ PD-L1−
80
60
% of CAR T cells
40
20
0
100
80
60
% viable CAR T cells
40
20
0
100 LAN-1 viability M238R viability
CAR T cell viability
*
M238 viability
Day 1 Day 2 Day 3
*
80
60
% viable GD2+ tumour cells
40
20
0
100
80
60
% viable GD2+ tumour cells
40
20
0 100
80
60
% viable GD2+ tumour cells
40
20
0
GD2-SK-MEL IgG
anti-PDL1anti-PDL2 GD2-SK-MEL
IgG
anti-PDL1anti-PDL2 GD2-SK-MEL
IgG
anti-PDL1anti-PDL2 NT T cells
IgG
anti-PDL1anti-PDL2 NT T cells IgG
anti-PDL1anti-PDL2NT T cells IgG
anti-PDL1anti-PDL2
NT T cells IgG
anti-PDL1anti-PDL2NT T cells IgG
anti-PDL1anti-PDL2NT T cells IgG
anti-PDL1anti-PDL2 NT T cells
IgG
anti-PDL1anti-PDL2NT T cells IgG
anti-PDL1anti-PDL2NT T cells IgG
anti-PDL1anti-PDL2 a
c d
e f
b
Anti-CAR (1A7)
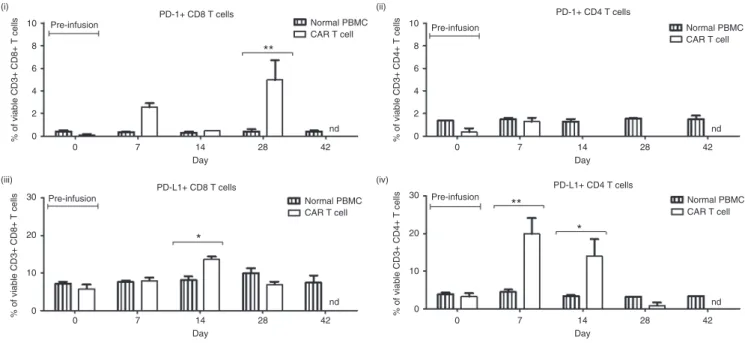
and PD-L1 (Figure 7e,f and Supplementary Figure S6d,e).
Circulating CD8+ CAR T cells had significantly higher PD-1
sur-face expression compared to normal peripheral CD8+ T cells for
both Patients 101 and 102, whereas for Patient 201 CD4+ CAR
T cells had significantly higher PD-1 expression than normal
peripheral CD4+ T cells. In the case of PD-L1, Patient 102 had
significantly higher surface expression on both CD4+ and CD8+
CAR T cells compared to normal T cells at multiple time points following infusion. Significantly higher PD-L1 surface expression
was also observed on CD4+ CAR T cells from Patient 101 and on
CD8+ CAR T cells from Patient 203.
Lack of persistence may be related to activation induced cell death, as we observed in vitro, or may be due to a CAR-specific immune response mounted after infusion. To investigate this pos-sibility, we assayed patient sera for human anti-mouse antibody
IgG (HAMA) and patient PBMC for CAR-specific CTL response. No HAMA was detected at any time point postinfusion in Patients 101 and 102, whereas Patient 201 had pre-existing HAMA that increased approximately fivefold by month 4 following CAR T-cell
infusion (see SupplementaryFigure S7a). Patient 203 had very low
HAMA levels that did not increase over the 6-week time course. CTL responses were investigated using the protocol described by
Lamers et al.8 to identify and expand CAR-specific clones within
the peripheral blood. We compared PBMC stimulated with NT control T cells, iCAR T cells incorporating iCasp9, or GD2-CAR T cells lacking iCasp9, to determine whether the GD2-GD2-CAR construct was immunogenic and whether the inclusion of iCaps9 increased the immunogenicity of the CAR construct. We identi-fied low levels of CAR-specific T cells in month 4 peripheral blood
samples for Patient 101, at a frequency of 1–2% in the viable CD3+
Figure 6 Chimeric antigen receptor (CAR) cross-linking also induces activation-induced cell death. (a) Viability, (b) activation, (c) PD-1, and
(d) PD-L1 expression after CAR cross-linking with 1A7 and secondary antibody (2°) of thawed CAR T cells and nontransduced (NT) controls. (e)
GD2-iCAR T-cell AICD in the presence of PD-1-, PD-L1-, or FAS-blocking antibodies after CAR cross-linking. Cross-linking assays and flow cytometry analyses were performed in duplicate. Representative data are shown for patient 101, and graphs display mean ± stanadard error of the mean. The gating
strategy is shown in Supplementary Figure S5.
100
Viability
GD2-iCAR NT
ns**
*** ***
*** ** **
** **
*
* *** ***
**
*
80
60
% AnnexinV-DAPI- CAR T cell
s
40
20
0
100
80
60
% CD25+/CD69+ CAR T cells
40
20
0
100
80
60
% PDL1+ CAR T cells
40
20
0 100
80
60
% PD-1+ CAR T cells
40
20
0
100 Isotype
anti-PD-1 anti-PDL1 anti-FAS ns
ns ns
CAR T cell viability following PD-1, PD-L1 or FAS blockade
80
60
% Annexin V- DAPI- CAR T cell
s
40
20
0
Media onlyanti-CAR anti-CAR +
2°
Media onlyanti-CAR anti-CAR +
2°
Media onlyanti-CAR anti-CAR +
2°
Media only anti-CAR anti-CAR + 2°
Media onlyanti-CAR anti-CAR +
2°
Media onlyanti-CAR anti-CAR +
2°
Media onlyanti-CAR anti-CAR +
2° Media onlyanti-CAR
anti-CAR + 2°
Media onlyanti-CAR anti-CAR +
2°
Activation
PD-1 PD-L1
a b
c
e
population (see SupplementaryFigure S7b,c). However, no sig-nificant CAR-specificT-cell responses above 1% were detected in samples at other time points for Patient 101, or in any samples from Patient 102, and thus were considered below the limit of detection. Interestingly, the CAR-specific T-cell response at month 4 was detected only in PBMC stimulated with irradiated T cells bearing the GD2-iCAR and not the GD2-CAR, which suggests that any T-cell response in these patients directed against epitopes within the iCasp9 molecule.
DISCUSSION
In the phase 1 CARPETS trial (ACTRN12613000198729), we are investigating adoptive transfer of third-generation GD2-iCAR-PBT in patients with metastatic B-raf kinase (BRAF)-mutant melanoma who concurrently receive dabrafenib with or without trametinib, and BRAF-wildtype melanoma who receive
lymphodepleting therapy. The GD2-iCAR consists of CD3ζ, CD28,
and OX40 signaling domains coupled to the 14g2a scFv31,32 and an
iCasp9 suicide gene.33,34 The same technology is also currently on trial in neuroblastoma patients (GRAIN; NCT01822652).
The failure of adoptively transferred CAR T cells to persist and expand in patients strongly correlates with a lack of antitumor efficacy. There are several proposed theories for this lack of
per-sistence including exhaustion,22 AICD10,12 and immune-mediated
deletion.8 In this paper, we have investigated whether any of these
factors influence the survival of third-generation GD2-specific CAR T cells currently being tested in phase 1 clinical trials, which is particularly important given the inclusion in the CAR of regions reported to impact on CAR T-cell efficacy such as the 14g2a scFv
and the IgG CH2–CH3 spacer, and we have also sought to better
define the events occurring following antigen encounter by CAR T cells.
100
80
60
% of CD3+ T cells
40
20
0
100
80
60
% of viable CD3+ CD8+ T cells
% of viable CD3+ CD8+ T cells
40
20
0
3,000 5
4
3
2
1
0 IgG Control 2,000
1,000
250
Copy number/per 1,000 ng gDNA
% of CD3 T cells
200 150 100 50 0
0 7 14 21 28 35 42 49
Day Month 4 Month 8 Month 12 Patient 101 Patient 102 Patient 201 Patient 203
Patient 101
PBMC CD8+ IFNγ
Normal PBMC CAR T cell
Normal PBMC
CAR T cell Normal PBMCCAR T cell
Normal PBMC CAR T cell
nd nd
TNF IL-10 IL-6 IL-4 IL-2
PBMC CD4+ CAR CD8+ CAR CD4+
Patient 102 Patient 201 Patient 203
73 146 219 292 365 0 7 14 21 28 35 42 49 Day
0 7 14 21 28 35 42
Day
0 7 14 28 42
Day
0 7 14 28 42
Day
0 7 14 28 42
Day
nd
0 7 14 28 42
Day
nd
0 7 14 28 42
Day Serum cytokine
150 125 100 75
pg/ml
20
15
10
5
0
CD8 and CD4 T cells
Niave CD8 T cells Effector memory CD8 T cells
Central memory CD8 T cells Effector CD8 T cells
Pre-infusion
Pre-infusion
Pre-infusion 50
(i) (ii)
(iii) (iv)
40
30
20
10
0
% of viable CD3+ CD8+ T cells
50
40
30
20
10
0 % of viable CD3+ CD8+ T cells
100
80
60
40
20
0
Pre-infusion
Pre-infusion
*
**
6 hrs 24 hrs
CAR T cells-QPCR CAR T cells-FLOW
Month 4 Month 8 Month 12 73 146 219 292 365
a b
c d
First, we tested GD2-iCAR T cells for evidence of the func-tional exhaustion resulting from the tonic CAR-signaling that
has been reported by others.22 We found that PD-1, LAG-3, and
TIM-3 were not constitutively expressed, but that PD-1 and LAG-3 were upregulated transiently during CAR T-cell stimula-tion. Initial stimulation of CAR T cells resulted in potent cyto-kine secretion, which was diminished after restimulation, and
we observed recovery of IFNγ and TNFα, but not IL-2
produc-tion when we blocked PD-1 using pembrolizumab mAb. Loss of IL-2 has been identified as one of the early steps leading to T-cell
exhaustion and so may indicate a late-stage effector phenotype.35
A reduction in cytokine secretion was also observed after restimu-lation of NT controls, indicating that CAR signaling was not solely responsible for the loss of T-cell function. Thus although GD2-iCAR T cells lose some effector functions during longer-term culture and restimulation, the third-generation CAR does not seem to produce the same high levels of tonic CAR signaling and functional exhaustion reported for the GD2-specific,
second-gen-eration CD28-CD3ζ CAR36 perhaps because of OX40
coexpres-sion in the third-generation construct. Nevertheless, these results do highlight the importance of rigorous multifunctional analysis of CAR T cells during product development, because
immedi-ate effector functions such as target cell lysis and IFNγ secretion
observed in vitro may not be an accurate indicator of CAR T-cell efficacy in the clinic.
GD2-iCAR signaling resulted in different kinetics for down-stream signaling events, with more rapid calcium flux and sig-naling molecule phosphorylation, and third-generation CAR of this kind have been previously reported to be more prone to
AICD due to the potent stimulation induced.17 Higher basal levels
of phosphorylated molecules in resting cells suggests that CAR T cells do have a higher activation state before antigen encoun-ter. Importantly, NT T cells expanded under the same conditions also displayed higher basal levels of signaling molecule phos-phorylation and active caspase 3 than unmanipulated T cells from PBMC samples. Thus, we could identify some changes in activa-tion potential and signaling that were due to the effector mem-ory phenotypes generated by ex vivo cell-expansion conditions, as opposed to the intrinsic properties of the third-generation CAR. A central memory or naive/stem-like memory phenotype is associated with superior T-cell persistence whereas an effec-tor memory phenotype has been associated with poor antitumor
responses.6,7,37 Consequently, we hypothesize that improvements
in ex vivo activation and expansion conditions that promote central memory or stem-like phenotypes may be used to correct some defects in CAR T-cell function observed in this paper. For example, parameters influencing optimal T-cell therapy product development such as cytokine supplementation, stimulation con-ditions and transduction of defined T-cell subsets have previously
been investigated.37–39
Our second aim was to investigate whether GD2-iCAR T cells experience activation-induced cell death, as has been reported by
others.10 Using an antigen “stress-test” and receptor cross-linking
assays, we found that GD2-iCAR T cells had reduced viability after antigen encounter, and lost the ability to kill GD2-specific tumor cell lines.AICD has long been noted in T cells following
stimula-tion.13,15 The iCasp9 molecule has not previously been reported
to undergo spontaneous dimerization, however we investigated
Figure 7 Chimeric antigen receptor (CAR) T-cell persistence and immune phenotype in patients receiving third-generation GD2-specific CAR T cells for the treatment of V600 BRAF-mutant metastatic melanoma. (a) Flow cytometry using 1A7 to detect GD2-iCAR-expressing T cells
in peripheral blood. (b) Quantitative polymerase chain reaction (QPCR) to detect GD2-iCAR transgene-positive cells in peripheral blood. (c) Patient
102 serum cytokine levels. (d) Patient 102 CD4 and CD8 CAR T-cell subsets for peripheral blood mononuclear cells, the GD2-iCAR T-cell product
and circulating GD2-iCAR T cells detected from day 7 postadministration. (e) Patient 102 CD8+ T-cell immune phenotype and (f) PD1/PD-L1
expres-sion on peripheral blood normal T cells and 1A7+ GD2-iCAR T cells. Experiments were performed in duplicate (flow cytometry) or triplicate (QPCR),
with graphs displaying mean ± standard error of the mean. Gating strategy and data for Patients 101, 201 and 203 are shown in Supplementary
Figure S6.
Normal PBMC
CAR T cell Normal PBMCCAR T cell
Normal PBMC CAR T cell
Normal PBMC CAR T cell nd
0 7 14 28 42
Day
nd
0 7 14 28 42
Day
nd
0 7 14 28 42
Day
nd
0 7 14 28 42
Day
PD-1+ CD8 T cells PD-1+ CD4 T cells
PD-L1+ CD8 T cells PD-L1+ CD4 T cells
Pre-infusion
Pre-infusion
(i) (ii)
(iii) (iv)
% of viable CD3+ CD8+ T cells
10
8
6
4
2
0 % of viable CD3+ CD4+ T cells
10
8
6
4
2
0
% of viable CD3+ CD8+ T cells
30
20
10
0 % of viable CD3+ CD4+ T cells
30
20
10
0
Pre-infusion
Pre-infusion
**
**
* *
whether this element contributed to AICD. We found that CAR T cells transduced with an iCasp9-negative vector experienced the same level of rapid caspase 3 activation (<12 hours stimula-tion) and AICD and this was also observed in NT controls stimu-lated via CD3 and CD28 receptors, albeit in a lower percentage of T cells. AICD could also be induced in PBMC although the stimulation over a longer time period (>24 hours) was required to observe the effect. Thus, the expression of the third-generation CAR leads to a heightened activation state, which contributes to AICD after repeated antigen stimulation. However, this phenome-non is also seen to some extent in NT T cells with effector memory phenotype and is not caused solely by the CAR-intrinsic elements such as intracellular signaling molecules or iCasp9.
During these investigations, we have found that PD-1 block-ade restored CAR T-cell cytokine production and promoted both
GD2-iCAR T-cell survival and killing of GD2+ PD-L1+ tumor cells
during stress-test assays. Furthermore, we found that activated CAR T cells upregulated the PD-1 ligands, PD-L1 and PD-L2, and the PD-1 receptor-ligand interactions between GD2-iCAR T cells were sufficient to induce AICD in the absence of tumor cells. To determine the ligand responsible for PD-1-dependent AICD, we blocked PD-L1 with blocking antibody and performed siRNA knockdown of PD-1 and PD-L1. This revealed that PD-L1 immune blockade inhibited AICD of CAR T cells, particularly in the presence of receptor cross-linking, while conversely PD-L1 knockdown by siRNA reduced CAR T-cell viability and PD-L2 blockade had no significant effect.
PD-1 and ligands, PD-L1 and PD-L2, modulate immune
responses via inhibition of proliferation and cytokine secretion,40,41
blockade of survival gene expression,42 promotion of Treg
differ-entiation,43 and induction of cell death.44,45 PD-L1 in particular has
complex roles in both immune activation and suppression that are still being elucidated. PD-L1 signaling via PD-1 causes inhibition
or deletion of activated PD-1+ T cells30,46 whereas signaling via
CD80 enables costimulation of naive T cells.47 In addition to this,
PD-L1 reportedly mediates reverse signaling within PD-L1+ T cells
and protects them from cell death. PD-L1-deficient T cells express lower levels of antiapoptotic molecules and are more susceptible to apoptosis during the contraction phase after antigen-specific
expansion.29,48 Early blockade of PD-L1 reportedly enhances
antigen-specific T-cell expansion, while late blockade reduces the
survival of effector T cells.29 Beneficial PD-L1 reverse signaling
has also been identified in the survival of PD-L1+ tumor cells and
renders these cells resistant to CTL-mediated and FAS-mediated
killing.48 These findings support our observations that PD-L1
blockade improved T-cell survival at early time points postactiva-tion, while conversely PD-L1 knockdown led to reduced survival of CAR T cells. Thus, we hypothesize that PD-L1 signaling may
induce AICD in PD-1+ CAR T cells, but also promote survival
of PD-L1+ CAR T cells via reverse signaling. It is important to
note that PD-1/PD-L1 interactions are likely just one mechanism that contributes to AICD and only the subset of T cells expressing PD-1 will benefit from PD-1 blockade. We also found that FAS, another molecule identified in AICD, was also highly expressed on GD2-iCAR T cells and FASL was upregulated during stimula-tion. Blockade of FAS also promoted CAR T-cell survival, albeit at the expense of some CAR T-cell cytotoxic function. Therefore, we
have identified a novel role for PD-1/PD-L1 interactions in AICD of CAR T cells, in addition to the FAS/FASL interactions
previ-ously identified by others10
One limitation of this study is that we lacked first- or second-generation GD2-CAR constructs, or constructs with different GD2-affinities, to compare to our third-generation CAR. It would be interesting to investigate to what extent re-engineering of CAR constructs would influence AICD and the PD-1/PD-L1 signaling axis. We hypothesize that the strength of CAR-mediated activa-tion determines CAR T-cell deleactiva-tion versus persistence, and may well play a role in the memory phenotype and functional potential of surviving T cells. In this GD2-CAR, it is possible that removing
the OX40 signaling domain entirely,18 replacing it with the 41BB
signaling domain24 or 41BB ligand49 as reported by others, may
reduce or prevent AICD and/or PD-1-mediated suppression. We have applied our understanding of our in vitro results to an analysis of peripheral blood samples derived from patients enrolled in the ongoing CARPETS clinical trial. The limited num-ber of patients enrolled thus far, means the results presented are descriptive and cannot be used to form definitive conclusions. However, we identified upregulated expression of both PD-1 and PD-L1 on a subset of peripheral-blood GD2-iCAR T cells, a
detectable GD2-iCAR+ population declined in all patients beyond
day 28 postinfusion, and failed to persist in Patients 101 and 102, suggesting that mechanisms of CART-cell deletion we have identified in vitro may also be at play in vivo. Deletion may occur after GD2 antigen encounter or from nonantigen specific activa-tion, for example, after engagement of the IgG CH2–CH3 spacer
region with FcyR-bearing immune cells,10,12 and this requires
fur-ther investigation. However, we propose that the timing of peak serum cytokines in CARPETS patients (days 7–28) may indicate antigen encounter because they occur at a similar time (~day 17) to the peaks of serum IFNy and IL-6 observed in leukemia
patients treated with CD19-specific CAR T-cells,1 albeit at much
lower concentrations.
Another hypothesis for lack of persistence is that a CAR T-cell-specific immune response targets the mouse-derived 14g2a scFv, the retroviral sequences, or the modified iCasp9 gene and cause immune-mediated deletion of CAR T cells. However, the low level and delayed timing of CAR-specific T-cell responses detected probably does not account for the reduction in detectable circulating CAR T cells by day 28 postinfusion. Furthermore, an increase in titer of (pre-existing) HAMA was detected in only one patient postinfusion, and this patient (201) is currently the only patient with detectable CAR T cells at month 4. Hence, we pro-pose that early CAR T-cell deletion is more likely related to AICD than to postinfusion anti-CAR transgene immune responses.
The lack of persistence may be overcome with preinfusion lymphodepleting chemotherapy, which is known to have multi-ple effects on both tumor and immune environments, including the removal of suppressive cells and the provision of homeostatic
cytokines to newly infused cells.50 The third patient enrolled in
supported GD2-iCAR T-cell expansion, the expanded population of adoptively transferred cells did not persist, perhaps because of active T-cell deletion. However at this stage, our results can only be descriptive until more patients are enrolled to the study.
Mounting clinical evidence indicates that pre-existing T-cell immunity is required for therapeutically effective PD-1 and PD-L1
blockade.20,36 CAR T cells may provide a source of primed immune
effectors when endogenous responses are insufficient. Here, we have identified important roles for PD-1 interactions in the sup-pression of CAR T-cell effector functions as well as a novel role in CAR T-cell AICD, and these findings complement other
preclini-cal studies.21 In a recent protocol amendment for the GRAIN trial
of GD2-specific CAR T cells in neuroblastoma patients, conrent treatment with anti-PD-1 mAb has been allowed. The cur-rent study therefore further supports the rationale for combining anti-PD-1 mAb and CAR T-cell therapy, which we hypothesize may also benefit patients with tumors lacking PD-L1 expression if the CAR T cells express PD-L1. We therefore propose to incorpo-rate anti-PD-1 mAb combination therapy into the next cohort of patients enrolled in the CARPETS clinical trial.
MATERIALS AND METHODS
Human subjects. Blood samples were obtained from patients with mel-anoma who provided written informed consent. The Royal Adelaide Hospital Human Research Ethics Committee approved the research pro-tocols for the CARPETS trial (ACTRN12613000198729). In addition to the initial blood donation, patients enrolled in the CARPETS trial donated blood for analysis of persistence and immune phenotyping at days 0, 7, 14, 28, and 42 postadministration of autologous GD2-specific CAR T cells (GD2-iCAR PBT). Two metastatic melanoma patients (101 and 102), who did not have prior lymphodepletion, received the lowest GD2-iCAR-PBT dose level of 10 million cells/m2. Each patient had a tumor containing a
V600 BRAF mutation and so received concurrent dabrafenib at the time of PBMC procurement and during the 6-week study evaluation period postinfusion. After a protocol amendment to allow concurrent treatment with dabrafenib and trametinib for patients with V600 BRAF mutant melanoma and lymphodepleting chemotherapy for patients with V600 BRAF mutation-negative melanoma, patients were enrolled at the second dose level. A third metastatic melanoma patient (201) had a V600 BRAF mutation-negative melanoma and had not had previous systemic therapy for melanoma. This patient received the second dose level of 20 million GD2-iCAR-PBT cells/m2 on day 0 after lymphodepletion with fludarabine
30 mg/m2 on days −4, −3, and −2 and IV cyclophosphamide 500 mg/m2 on
days −4 and −3. A fourth patient (203) with metastatic V600 BRAF mela-noma received the second dose level of 20 million GD2-iCAR-PBT cells/ m2 concurrent with dabrafenib and trametinib.
Cell lines and patient-derived primary cells. LAN-1 (neuroblastoma cell line), M238, M238R1, and SK-Mel-28 (melanoma cell lines) were main-tained in RPMI supplemented with 10% FBS, 1% L-Glutamine, and 1% Penicillin/Gentamicin (IDL, Adelaide, Australia). M238 and M238R1 cell lines were gratefully received from Roger Lo (UCLA, Los Angeles, CA). To generate GD2-iCAR PBT, patient PBMC were purified by density gradient separation, activated for 3 days with anti-CD3 and anti-CD28 (Miltenyi Biotec, Sydney, Australia), transduced with the GD2-iCAR ret-roviral vector SFG.iCasp9.2A.14g2a.CD28.OX40.zeta supernatant (CAGT, BCM, Houston, TX), and then expanded for 10–14 days in IL-7 and IL-15 (Miltenyi Biotec, Sydney, Australia) and cryopreserved before use, as described previously.23 Nontransduced (NT) controls were activated and
cultured in the same manner, but without retrovirus. Patient PBMC pre- and postadministration were purified and cryopreserved before analysis,
as described previously. All cells were thawed and rested overnight before analysis in in vitro assays.
Flow cytometry. Cells were analyzed on BD FACSCanto II (BD Biosciences, North Ryde, Australia) and FlowJo Software (TreeStar, Ashland, OR). Isotype and FMO controls were used in each assay to establish negative gates and cells were incubated with Human Fc-block (BD Biosciences, North Ryde, Australia) for 5 minutes before staining. All gating strategies and represen-tative data sets are shown in SupplementaryFiguresS1–S6. Staining was performed as described previously,27 with 1A7 (anti-idiotypic mAb for
GD2-iCAR purified in house) and PE-conjugated secondary (BD Biosciences) used to detect CAR+ T cells in all instances. To detect cytokine secretion,
cytokine bead arrays were performed using a BD Human Th1/Th2 Cytokine Assay Kit II according to the manufacturer’s instructions (BD Biosciences). For proliferation assays, cells were stained with 1.5 µmol/l Cell Trace Violet (Life Technologies, Scoresby, Australia) before stimulation. For ratiomet-ric calcium flux detection, CAR T cells were stained with 4 μmol/l Fluo-4 AM (Molecular Probes, Eugene, OR), 10 μg/ml Fura Red AM (Molecular Probes), and 0.02% Pluronic F-127 (AAT Bioquest, Sunnyvale, CA) as described by others. Cell samples were recorded for 30 seconds to establish a baseline and then anti-CAR (10 μg/ml), anti-CD3 (10 μg/ml), anti-CD28 (10 μg/ml) or cross-linking secondary antibodies (10 μg/ml) were added, and recordings made for a further 270 seconds. Ionomycin was used as a positive control, and some cells were prestained with primary antibodies for 30 minutes before adding crosslinking secondary antibody. For signaling molecule phosporylation detection, anti-pERK1/2-FITC, anti-pAKT-bv421, or anti-pSTAT6-FITC anti-pSTAT5-bv421 (BD Biosciences) were used. For viability and activation analyses, cells were stained with Annexin V-FITC, CD69-Pecy7, CD25-APC-Cy7, and DAPI (Sigma Aldrich, Castle Hill, Australia). GD2 expression on tumor cells was detected with anti-GD2-APC (14g2a clone, BD Biosciences).
In vitro functional assays. For stimulation assays, cells were stimulated with
plate-bound 1 µg/ml anti-CD3/CD28 (Miltenyi Biotech) or 2 µg/ml 1A7 for 3 days, cells and supernatants were collected for analysis by flow cytometry, and remaining cells were transferred to uncoated wells with fresh media. For restimulation, cells were stimulated for 3 days, rested for 4 days, and then restimulated for 3 days as above. For crosslinking assays, cells were cultured with either 1 µg/ml soluble 1A7 or 1 µg/ml soluble 1A7 or 10 µg/ml soluble antimouse IgG secondary. For coculture “stress-test” assays, tumor and CAR T cells were cultured at a 1:1 ratio, as described by others.10 Every 24 hours,
CAR T cells were removed and replated onto fresh tumor cells at a 1:1 ratio. Remaining tumor cells and a sample of CAR T cells were retained at each 24-hour time point for analysis of viability by flow cytometry. Cytotoxicity assays were performed as described previously,27 with GD2-iCAR PBT
cocultured with 51Cr-labeled LAN-1 neuroblastoma, M238, or M238R1
melanoma cells, and autologous PHA-blasts or SK-Mel-28 melanoma cells (as negative controls) for 6 hours before 51Cr-release was analyzed.
Detection of CAR-specific immune responses. Human antimouse antibody was assayed using patient serum collected pre and post CART-cell infu-sion using a HAMA ELISA kit (Biolegend, San Diego, CA) according to the manufacturer’s instructions. CAR-specific immune responses were assayed as described by Lamers et al. Briefly, PBMC from preadministration, day 28, day 42, and month 4 timepoints were cultured with autologous, irradiated CAR T cells or NT control T cells as feeder cells at a 4:1 ratio. New feeder cells were added every 7 days for 4 weeks. We used CD107a (BD Biosciences) staining as a marker of degranulation to assess responses. Responses were considered negative when the flow cytometry assay yielded a net %CD107a+
population of <1%, based on the background observed for PBMC stimulated with NT control T cells.