ACCESS TO FRUITS AND VEGETABLES FOR LOW-INCOME INDIVIDUALS: A MIXED METHODS STUDY TO HEALTHY EATING
Lindsey Haynes Maslow
A dissertation submitted to the faculty of the University of North Carolina at Chapel Hill in partial fulfillment of the requirements for the degree of Doctor of Philosophy in the
Department of Health Policy and Management.
Chapel Hill 2014
© 2014
ABSTRACT
Lindsey Haynes Maslow: Access to Fruits and Vegetables for Low-Income Populations: A Mixed Methods Study to Healthy Eating
(Under the Direction of Pam Silberman)
Consuming fresh fruits and vegetables (F&V), can help reduce the risk of chronic diseases. Lower-income individuals do not consume the recommended servings F&V.
Access to and consumption of F&Vs is a multi-dimensional issue that includes various levels of influence. The purpose of this dissertation is to examine these various levels of influences and explore strategies to increase F&V consumption. Aim 1 assesses low-income
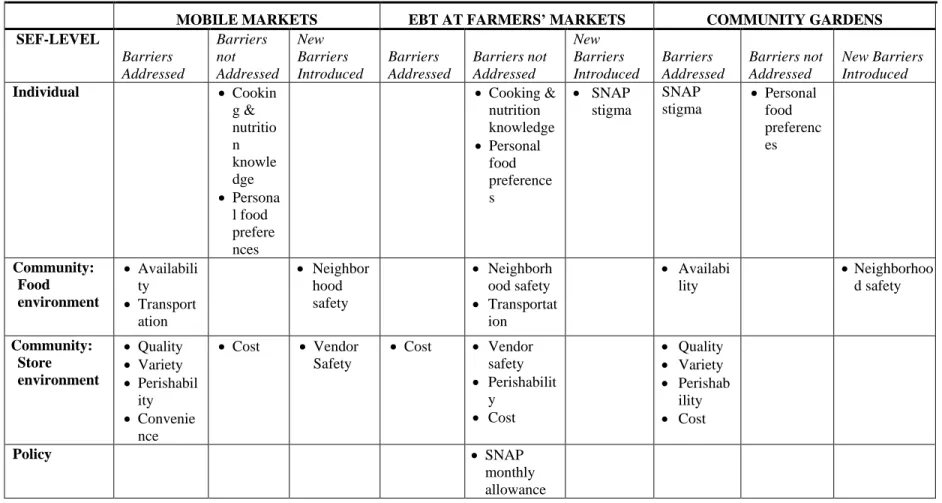
individuals’ perceptions about how F&V access programs, including mobile markets, electronic benefits (EBT) cards at farmers’ markets, and community gardens, could improve F&V consumption. Participants felt that mobile markets addressed barriers such as
availability of fresh F&V, convenience, and quality and variety. Participants had mixed opinions about how helpful EBT was in overcoming cost barriers. Participants had
uncertainty about community gardens, mostly surrounding feasibility and implementation. Aim 2 compared the predictive power of geographic information systems (GIS) and self-reported perceived access data for estimating the association between F&V access and consumption. Results showed GIS-based measures had more predictive power than perceived access measures for estimating the association between access and consumption. Perceived access measures (quality, variety, and convenience) were not associated with higher
Aim 3 analyzed stakeholder arguments in access to healthy food state-level
legislation legislative hearing data and newspaper articles. Bills that expanded access, rather than restricted access, were most likely to pass. For enacted legislation, non-profit
organizations were the largest proponents. Among stakeholder arguments used to support expanding legislation, fairness and economic security were the most frequently cited. Sugar-sweetened beverage (SSB) tax bills accounted for nearly all failed restricting legislation and were opposed by businesses. While proponents focused mainly on factual arguments, opponents focused heavily on value-laden arguments such as economic security, fear of big government, and personal responsibility. Businesses used valued-laden arguments more often than non-profits.
Data from these aims suggest that changing the food environment, while also addressing how low-income individuals’ perceive that environment is the first step towards increasing F&V consumption. Policy efforts should focus on improving geographic
ACKNOWLEDGMENTS
First and foremost, I would like to thank my wonderful husband Jason, whose love and support provided me the energy I needed to complete my journey through the doctoral program. In the past four years, you have been a constant source of patience and
understanding during one of the most chaotic and stressful times in my life. On days when I would leave my car keys in the freezer or burn our dinner in the oven, you would gently smile as if to say, “Don’t worry, I’ve got it.” During weeks when I could not see the light at the end of the tunnel, you would offer your hand and guide me through the dark. You have always believed in me, even when I did not believe in myself. For that, I am forever grateful to you. During the past eight years, you have been my best friend, partner in life, and greatest inspiration. I cannot imagine what my educational experience would have been like without your soothing personality and comforting demeanor. After three degrees at UNC, as we close the chapter to Part One of our journey, I am excited to see what Part Two holds for us.
To my adviser and committee chair Pam Silberman: I would not be in this program if it were not for you taking me on as your doctoral student. You are one of the hardest
working, dedicated, and passionate women I have ever met. While you are brutally honest, direct, and demand excellence from your students and peers, you are also equally
To the rest of my dissertation committee—Barbara Mark, Bryan Weiner, Mark Holmes, and Alice Ammerman—I would like to thank each and every one of you for all your time and commitment to my dissertation. I appreciate everyone’s helpful feedback and have found this a tremendously challenging but rewarding experience. The combination of all of your individual skills and expertise has truly given me the opportunity to learn from the best and brightest in multiple academic disciplines. To Barbara, who always provided thorough, timely, and insightful feedback on all my drafts; you challenged me to think more deeply about my research. Although half the time I feared your feedback, receiving your approval was always extremely rewarding and definitely worth my time. You are a strong, confident woman, both traits I hope to achieve as I grow older.
To Bryan, who has been my unofficial qualitative research mentor and writing coach throughout this process; you taught me how to communicate my jumbled thoughts and sentences into coherent stories that anybody, regardless of academic discipline, could relate to and understand. You also hold a special talent for politely saying, “This isn’t your best work” while still sounding optimistic and encouraging. To Mark, whose brain is wired completely different than mine, I appreciate your ability to breakdown “foreign” quantitative concepts into easily understandable, digestible tidbits of information that are often
accompanied with humor—mostly about kale.
And to Alice, the only “card-carrying” nutritionist on my committee. You truly take a collaborative and multi-disciplinary approach to your research and work in North Carolina. You have the gift of being able to transcend across disciplines and professions and garner support for public health nutrition across multiple stakeholders. I look up to you, both
same art of connecting individuals and organizations with similar interests to better the community.
To Morris Weinberger, whose office I walked into when I was 20 years old proudly saying I wanted to apply for the PhD program. Over the past eight years, you have served as my guide and mentor through the academic process. If ever I had a question about the
program, a class, my career, I never hesitated to turn to you for advice. The time you take out of your day to put your students’ needs ahead of your own truly exemplifies what a mentor is supposed to be. I strive to reach the level of mentoring that you offer to your students on a daily basis.
To my mom and dad, thank you for your continued support, love, and
encouragement. I would not have been able to accomplish this educational achievement without you both. To my mother, Ms. Jeanne Haynes, for constantly reminding me how proud you are of me and always being my greatest cheerleader. To my father, Mr. Stephen Haynes, for providing me a strong work ethic and personal drive to do “whatever it takes” to achieve my professional goals. I believe I received the best of both your personalities— caring and compassionate but strong and dedicated.
made me laugh over the years, I will say that they always made it easier for me to go home and get back to my work on the weekends.
TABLE OF CONTENTS
LIST OF TABLES ... xiii
LIST OF FIGURES ... xv
LIST OF ABBREVIATIONS ... xvi
CHAPTER 1: INTRODUCTION AND LITERATURE REVIEW ... 1
Dissertation Overview ... 1
I. Conceptual Framework... 3
II. Obesity Rates and Obesity-Related Healthcare Costs ... 6
III. Food Deserts ... 12
IV. The Relationship between Fresh Fruit and Vegetable Access and Consumption. ... 13
V. Program Options for Increasing Access to Fruits and Vegetables in Low-Income Communities ... 18
VI. Policy Options for Addressing Access to Healthy Food ... 21
VII. Tobacco and Obesity ... 22
VIII. Conclusion ... 29
CHAPTER 2: LOW-INCOME INDIVDIUALS’ PERCEPTIONS ABOUT HOW FRUIT AND VEGETABLE ACCESS PROGRAMS CAN IMPROVE ACCESS AND CONSUMPTION: A QUALITATIVE STUDY ... 31
Introduction ... 31
Methods... 33
Setting ... 34
Recruitment ... 35
Focus Groups ... 36
Data Analysis ... 37
Codebook ... 37
Within- and between-group analysis. ... 38
Results ... 38
Barriers to Fresh F&V ... 39
Mobile Markets ... 41
Food Assistance Programs at Farmers’ Markets ... 45
Community Gardens ... 46
Discussion ... 50
Limitations ... 53
Policy Relevance and Implications ... 53
CHAPTER 3: COMPARING THE PREDICTIVE POWER OF GEOGRAPHIC INFORMATION SYSTEMS AND SELF-REPORTED DATA FOR ESTIMATING THE ASSOCIATION BETWEEN F&V ACCESS AND CONSUMPTION. ... 63
Introduction ... 63
Methods... 65
Sample and Data Sources... 65
Geocoding ... 68
Measures ... 69
Analysis... 70
Results ... 73
Exploratory Factor Analysis ... 74
Poisson Regression Estimates ... 75
Model Fit ... 78
Discussion ... 78
Poisson Regression Models ... 80
Limitations ... 83
Policy Implications ... 84
CHAPTER 4: STAKEHOLDER ARGUMENTS IN ACCESS TO HEALTHY FOOD STATE-LEVEL LEGISLATION IN NEWSPAPERS AND BILL HEARINGS. ... 99
Introduction ... 99
Methods... 102
The Legislative Process ... 102
Data Sources ... 103
Search Strategy and Sample Selection of Legislative Bills and Articles ... 104
Bill Content Analysis ... 106
Results ... 108
Quantitative Results ... 108
Qualitative Results ... 110
Expanding Legislation Analysis ... 112
Restricting Legislation Analysis ... 116
Discussion ... 123
Limitations ... 127
Policy Implications and Conclusion ... 128
CHAPTER 5: DISCUSSION ... 155
Summary of Findings ... 156
Policy Implications ... 163 Future Research ... 165 Next Steps ... 168 APPENDIX: FOCUS GROUP MODERATOR GUIDE: ORANGE AND DURHAM
LIST OF TABLES
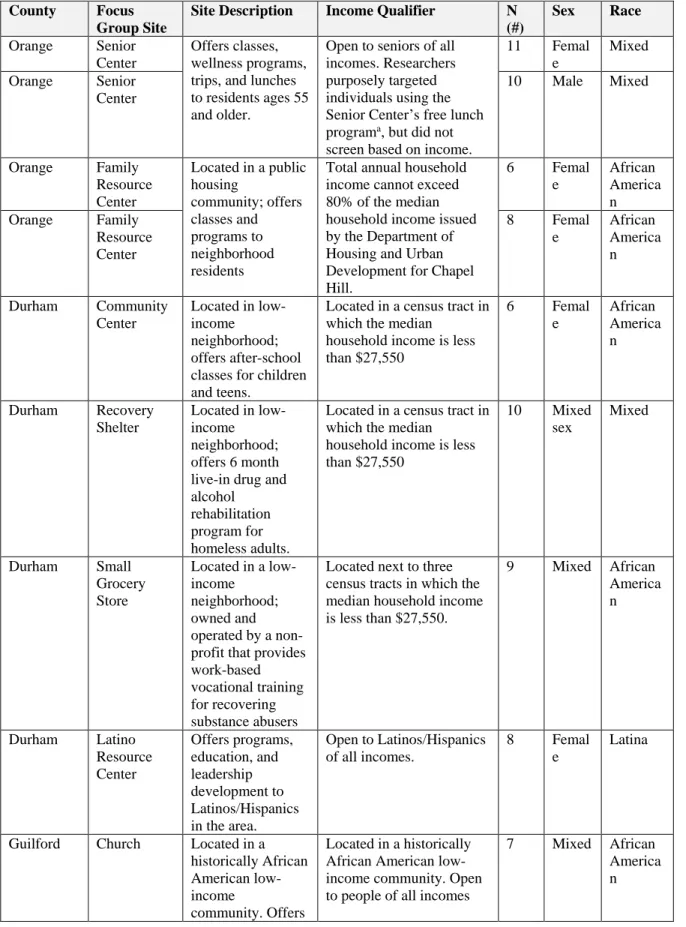
Table 2.1: Site-Specific Focus Group Characteristics ...57
Table 2.2: Demographic Characteristics of Focus Group Participants (N = 105) ...59
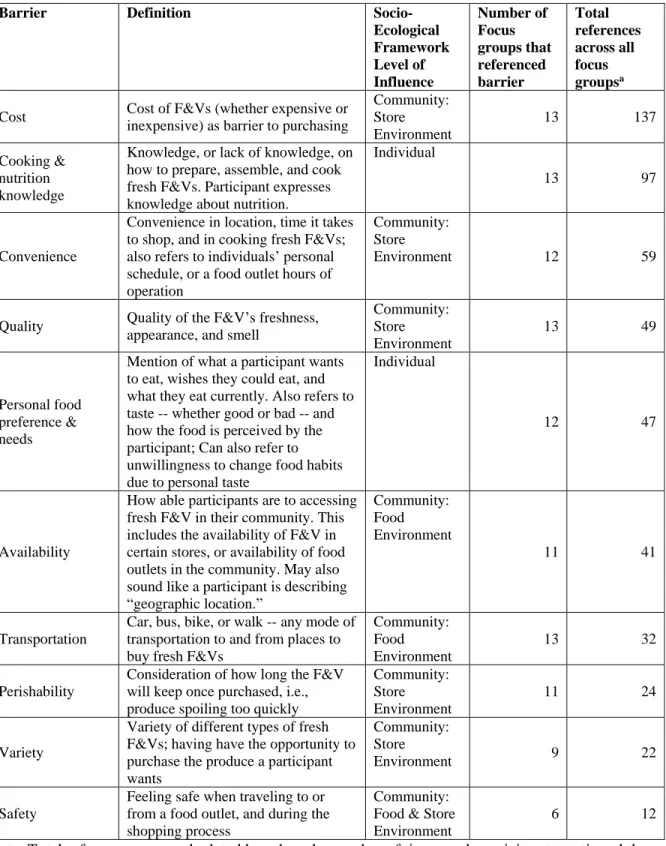
Table 2.3: Top 10 Barriers to Food Access as Perceived by Participants by SEF-Level ...61
Table 2.4: Barriers addressed and not addressed by F&V Programs by SEF-Level ...62
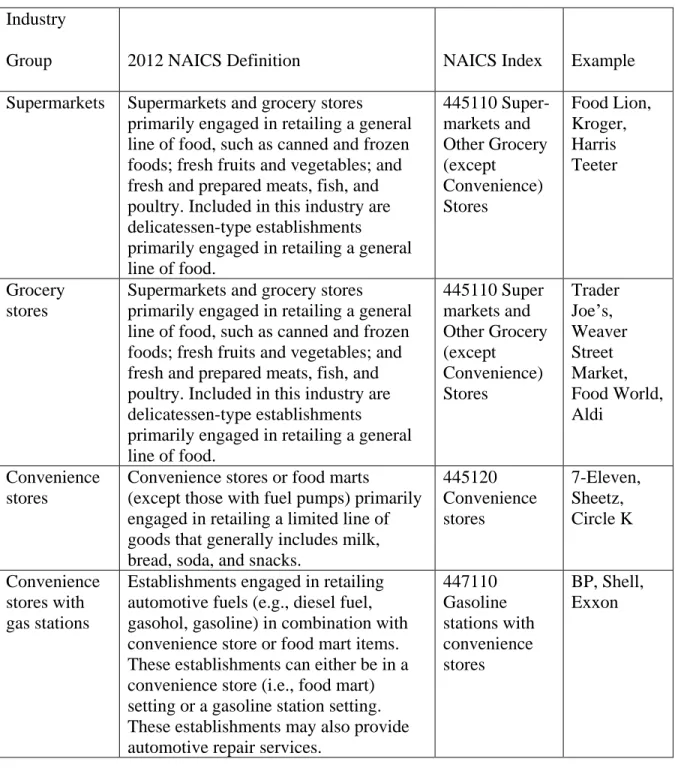
Table 3.1. North America Industry Classification System (NAICS) Codes and Examples of Food Outlets ...88
Table 3.2. Description of Key Variables and Measures ...89
Table 3.3. Descriptive Statistics, N=115 ...90
Table 3.4. Descriptive Statistics by Receipt of Government Assistance, N=115 ...91
Table 3.5. Pearson Correlations for Perceived Access Variables ...92
Table 3.6. Factor Loadings for a 1-Factor Perceived Access Scale ...92
Table 3.7. Cronbach’s Alpha Correlation ...92
Table 3.8. Pairwise Correlation between Perceived Access Scale and GIS Measures ...93
Table 3.9. Pairwise Correlation between Perceived Access and GIS Measures by Specific Participant Populations, N=115 ...93
Table 3.10. Poisson Regression Estimates of Real and Perceived Measures of F&V Access on Consumption, N=115 ...94
Table 3.11. Poisson Results: Average Marginal Effects of Affordability on F&V Intake by Group ...97
Table 4.1: General Bill Information, 2010–2012 ...129
Table 4.2: States introducing legislation, 2010–2012, N=137 ...130
Table 4.3: Bill Life among Bills that Did Not Pass, 2010-2012, N=119 ...131
Table 4.5: Codebook and Code Frequency ...135 Table 4.6: Access to Healthy Food State-Level Bills Introduced,
LIST OF FIGURES
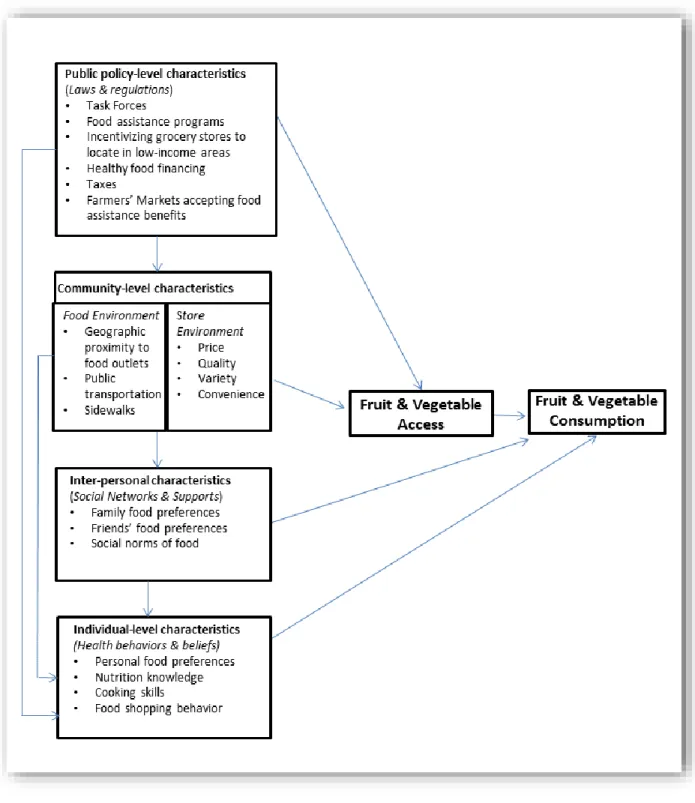
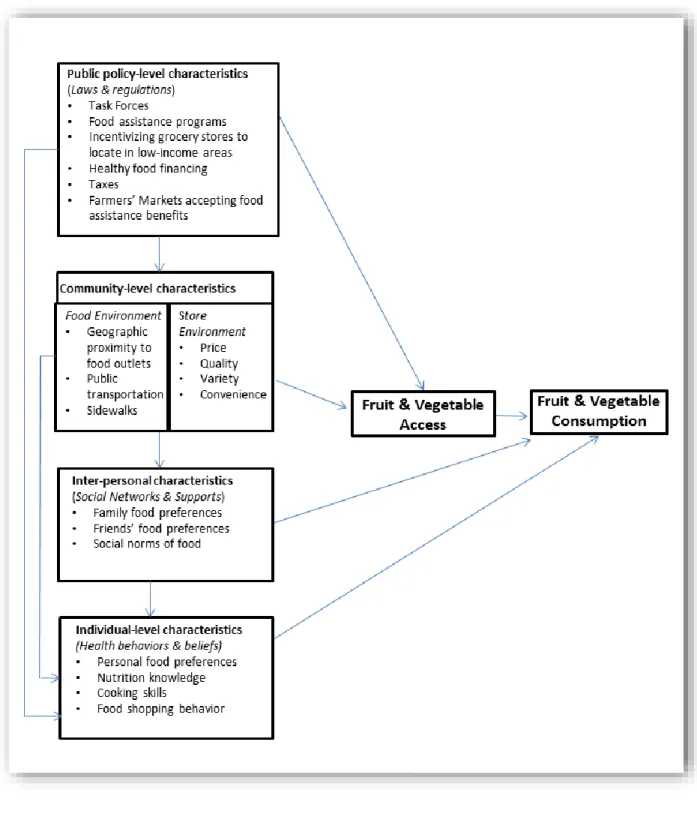
Figure 1.1: Applying the socio-ecological framework to F&V access
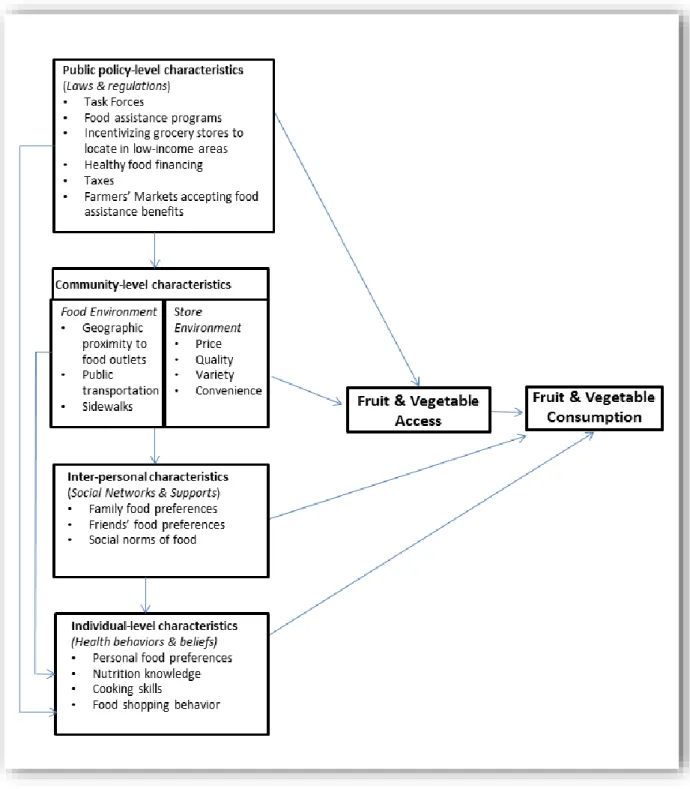
and consumption ...30 Figure 2.1: Applying the socio-ecological framework to F&V access
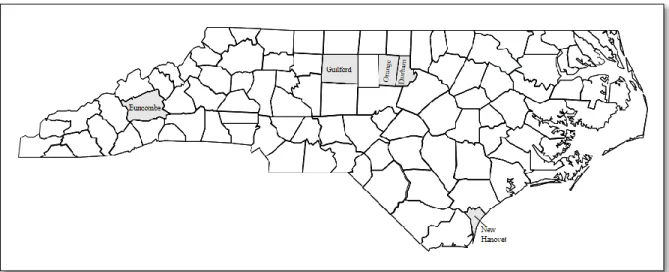
and consumption ...55 Figure 2.2: Map of North Carolina and the five study counties ...56 Figure 3.1: Applying the socio-ecological framework to F&V access
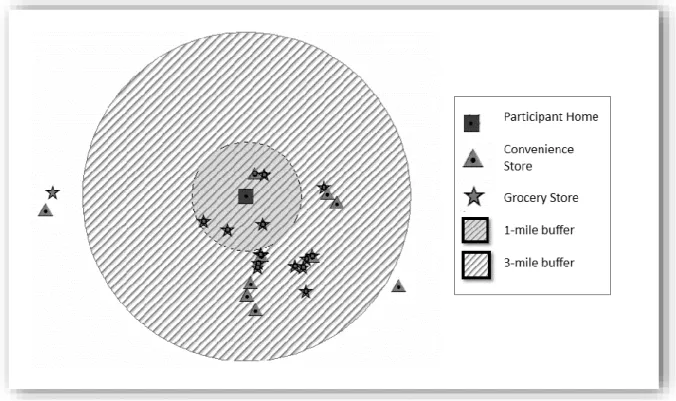
and consumption ...86 Figure 3.2: Example of 1- and 3-mile buffer around participant
home using ArcGIS...87 Figure 4.1: Typical process for bills introduced, 2010–2012 ...132 Figure 4.2: Factual and value-laden arguments by legislation type ...139 Figure 4.3: Kellogg’s false & misleading claims on children’s
LIST OF ABBREVIATIONS
AIC Akaike Information Criterion
ARRA American Recovery and Reinvestment Act BMI Body mass index
EBT Electronic benefit transfer card EFA Exploratory factor analysis
EPIC European Prospective Investigation into Cancer and Nutrition F&V Fruits and vegetables
GIS Geographic information systems HFFI Healthy Food Financing Initiative
SNAP Supplemental Nutrition Assistance Program SSB Sugar-sweetened beverages
SEF Socio-ecological framework
TANF Temporary Assistance for Needy Families Program USDA United States Department of Agriculture
CHAPTER 1: INTRODUCTION AND LITERATURE REVIEW Dissertation Overview
Engaging in physical activity and consuming healthy foods, including fresh fruits and vegetables (F&V), can help prevent weight gain and reduce the risk of obesity-related
chronic diseases including heart disease, diabetes, and some cancers.1 Unfortunately, most individuals, particularly those with lower incomes, do not consume the 2010 United States Department of Agriculture’s (USDA) guidelines of five servings of F&V per day.2,3 In North Carolina, 15.2% of adults with an annual income of $15,000 or less meet F&V intake
guidelines compared to 30% of adults with annual incomes of more than $50,000.3 Residents of low-income areas often lack access to fresh F&Vs, which is one, but not the only, factor influencing F&V consumption.4
Access to and consumption of fresh F&Vs can be defined as a multi-dimensional issue that can be explained using a socio-ecologic framework that includes various
The rationale for the proposed research is to determine how to increase F&V access and consumption among low-income individuals and thereby improve health outcomes. The purpose of this study is to examine the influence of community- and public policy–level factors on F&V access and to explore strategies to increase F&V consumption. The central hypothesis is that the community-level F&V access programs such as mobile markets, farmers’ markets accepting electronic benefit transfer (EBT) cards, community gardens, and public policy legislation can improve different aspects of F&V access, which may lead to increased consumption among low-income individuals. This hypothesis is based partly on preliminary data from eight focus groups consisting of low-income individuals in North Carolina, which showed that F&V consumption was correlated with multiple aspects of access.
To better understand the influence of community- and public policy–level factors on F&V access and consumption, I conducted three studies with the following aims:
Aim 1: Assess low-income individuals’ perceptions about how F&V access programs in North Carolina can improve F&V access and consumption. This aim employs a qualitative approach to help better understand low-income individuals’
perceptions of F&V access programs such as mobile markets, farmers’ markets accepting electronic benefit transfer (EBT) cards, and community gardens to improve F&V access and consumption. This analysis relies on data from 13 focus groups with low-income adults across North Carolina counties.
Aim 2: Compare the predictive power of geographic information systems data and self-reported data for estimating the association between F&V access and
individual access to F&V in the community (defined as food stores that sell F&V within 1 and 3 miles of the home) and survey data were used to collect individuals’ self-reported perceptions of F&V access and F&V consumption. Data used for this analysis came from baseline data from the North Carolina Green Carts Program—a F&V intervention that coordinates, distributes, and sells F&V in low-income communities in North Carolina—and ReferenceUSA, a commercial source that has real-time access to over 22 million businesses across the country.
Aim 3: Analyze stakeholder arguments in access to healthy food state-level legislation introduced between 2010 and 2012 in bill hearings and newspapers. The purpose of this aim is to understand the arguments used in legislation promoting access to healthy food. Using the Yale Rudd Center for Food Policy and Obesity’s Legislation Database, I identified states that introduced healthy food policy legislation, such as offering financial incentives for grocery stores that locate in lower-income neighborhoods or
restricting food assistance program beneficiaries from using their Supplemental Nutrition Assistance Benefits Program (SNAP) funds to purchase unhealthy foods. I then categorized these bills into one of two groups: expanding access to healthy food or restricting access to unhealthy food. I also conducted a content analysis of the arguments for and against the legislation using legislative Web sites and InfoTrac Custom Newsstand, an online search engine database with more than 1,100 major U.S. local, regional, and national newspapers.
I. Conceptual Framework
networks and norms, environmental characteristics), and societal (public policies and systems-level factors) (see Figure 1.1).6 More recently, researchers have applied this model to healthy eating.7 This variation of the SEF helped guide the development of this
dissertation in that it suggests that many levels of influence are needed to improve F&V access and consumption among low-income individuals. To capture these levels of influence, Aim 1 of this study examines individuals’ beliefs about how F&V access programs affect access and whether these programs will lead to increased consumption, Aim 2 examines how community-level characteristics influence F&V access and consumption, and Aim 3 explores public policies that impact F&V access.
I.A. Individual Level
Individual health behaviors both shape and are shaped by the environment, exemplifying reciprocal causation.6 At the individual level, F&V consumption can be influenced by factors such as age, gender, dietary intake, and socio-economic status. F&V consumption, although usually described as one behavior, is a combination of multiple separate behaviors including buying, preparing, and eating F&Vs, each of which can be influenced by the aforementioned factors.7 Individuals who are unaware of nutritional values or portion sizes of foods may unknowingly consume unhealthy foods in large quantities. In terms of preparing fresh F&Vs, individuals may not feel confident about how to prepare F&Vs or lack the skills to incorporate fresh F&Vs into their diet. Last, personal beliefs and taste preferences may affect F&V consumption decisions.
I.B. Interpersonal Level
At the interpersonal level, individuals’ diets are influenced by their social
cultural norms.6 Social and cultural norms influencing individual food consumption include eating out, eating as a social activity, and weekend eating. During the latter half of the 20th century, individuals and families began eating out more frequently instead of cooking in their own homes.8 Currently, more than 50% of the money Americans spend on food is for foods consumed outside the home.8 Generally, the process of eating out has become a social activity; individuals often eat out with friends after work or school and for birthdays, anniversaries, and other special occasions. Unfortunately, multiple studies have shown that people consume more calories at restaurants as well as when in groups.8 Additionally, research has shown that individuals tend to consume more calories during weekends.9
I.C. Community Level
In simplest terms, the community level is where individuals live, work, and play. Community conditions or determinants can include a community’s socioeconomic status, neighborhood characteristics, and overall social capital. Geographic proximity, transportation to food outlets; convenience of purchasing fresh F&V; and affordability, quality, and variety of fresh F&V have all been cited as community-level factors affecting access and
environments and found that the presence of healthy food stores (grocery stores or
supermarkets) in communities was positively related to the probability of having a healthier diet.11
I.D. Societal Level
At the societal level, individuals are influenced by public policies and systems
affecting the distribution of power and resources. Local, state, and federal policies can impact the power and distribution of resources by enacting certain laws, such as setting the price of foods, adding incentives for healthy behaviors, and regulating the environment that supports healthy food consumption. At the societal level, governments can support healthy food consumption through financing initiatives to increase the sale of fresh produce in
underserved communities, allowing farmers’ markets to accept EBT for SNAP recipients, and integrating locally grown produce into the marketplace. Additionally, they can regulate the nutritional content of the food industry’s products, tax unhealthy foods and beverages, and restrict unhealthy food and drinks purchased with SNAP.
Understanding the complex relationship between F&V access and consumption is an important concept for public health researchers and policymakers. Recognizing that F&V access and consumption are multi-level and bidirectional processes can help with defining, increasing, and formulating new policies for F&V consumption, which could address obesity-related chronic diseases and the healthcare costs associated with them.
II. Obesity Rates and Obesity-Related Healthcare Costs
dividing weight in kilograms by height in meters squared. Adults with a BMI of 25–29.9 are overweight and adults with a BMI of 30 or higher are considered obese.12 Being obese increases the risk for a number of chronic diseases including coronary heart disease, cancer, high cholesterol, stroke, liver and gallbladder disease, sleep apnea, respiratory problems, arthritis, gynecological problems, diabetes, high blood pressure, asthma, and some cancers.1
Beyond the health risks associated with obesity and obesity-related chronic disease, there are escalating medical costs as well. It is estimated that the direct medical costs of obesity in the United States are more than $92 billion annually. Approximately 75% of U.S. healthcare dollars are spent treating chronic diseases. Researchers have found that
overweight or obese employees have higher medical expenditures than healthy-weight employees, with one study showing that obese employees’ medical bills were almost 40% higher than those of healthy-weight employees.13 Additionally, obese employees generally have higher absenteeism than healthy-weight employees, in part due to chronic health issues.13-15 A study conducted at Duke University found that the number of lost workdays due to illness or injury for obese employees was 13 times greater than healthy-weight
employees.16 Because F&V consumption is associated with healthy weight,17 one suggestion to address obesity-related chronic disease is to increase consumption of fresh F&Vs.
II.A. The Protective Factors of Consuming Fresh Fruits and Vegetables
provide vitamins, minerals, and fiber that are essential for good health; and are naturally filling but low in fat and calories.17 Although national guidelines encourage the intake of fresh, frozen, and canned F&Vs this dissertation focuses only on fresh F&Vs because they are more difficult to access for lower-income individuals and the nutritional comparability between canned and fresh F&Vs is debatable.22 Canned F&Vs and processing can often lower the nutritional content of F&V, such as having higher sodium levels.22
II.B. Cardiovascular Disease
Multiple studies involving F&V consumption and cardiovascular disease have shown that higher consumption levels are associated with lower disease risk.18--20 A longitudinal study following 71,910 women and 38,291 men in the United States for over a decade found that high consumption of F&V (more than 5 servings per day), especially leafy greens, was associated with a modest reduction in risk of major chronic disease, primarily cardiovascular disease.18 Hung and colleagues’ findings (2004) were consistent with a similar study that followed 9,608 adults and concluded that high F&V consumption was also associated with lower risk of cardiovascular disease mortality, however not non-cardiovascular disease mortality.19
II.C. Cancer
Since the 1970s, it has been suggested that high F&V intake could help reduce the risk of cancer.21,23-26 In studies examining dietary patterns and cancer rates between
new diet.34 A prospective study following 38,540 Hiroshima survivors that stayed in Japan reported that daily F&V consumption was associated with 12% reduction in total cancer mortality and daily consumption of vegetables was associated with an 8% reduction in total cancer mortality. Statistically significant inverse associations were also found between F&V consumption and stomach, liver, and lung cancer mortality but not breast or colorectal cancer mortality.26
Some studies have also found evidence to suggest that vegetable consumption can reduce the risk of prostate cancer. In a case-control study involving 628 newly diagnosed prostate cancer patients and 602 controls, men who consumed high levels of vegetables, specifically cruciferous vegetables (such as cabbage, kale, broccoli, and brussels sprouts), decreased their risk for prostate cancer. Those consuming more than 28 servings of vegetables per week had a 35% decrease in prostate cancer risk when compared to those eating less than 14 servings per week. Additionally, consuming more than 3 servings of cruciferous vegetables per week was associated with a 41% decrease in prostate cancer risk compared to those consuming less than 1 serving per week.25
In the European Prospective Investigation into Cancer and Nutrition (EPIC) study, researchers examined the relationship between cancer and diet in nearly 500,000 individuals living in 10 Western European counties between 1992 and 2000.23 During the 8-year study period, 6.7% of men and 6.2% of women were diagnosed with cancer. Researchers found an inverse relationship between cancer diagnosis and high F&V consumption, with a stronger relationship among vegetable consumption than fruits. Additionally, this relationship was stronger in women than men. Another study using the EPIC data found an inverse
Despite these findings, there is still mixed evidence regarding the relationship between F&V intake and cancer. Using EPIC data, multiple studies found minimal or no evidence for the protective factors of F&V against cancer.35 Additionally, in Hung and colleagues’ longitudinal (2004) study following 71,910 women over a decade, there was not a statistically significant relationship between high F&V consumption and cancer
incidence.18
II.D. Obesity
Due to fresh F&V’s low energy density (calories) and fat content, as well as high water and fiber content, it is suggested that they can prevent weight gain or maintain healthy weight.29-34 In a 12-year prospective cohort study involving 65,294 female registered nurses (the Nurses’ Health Study), researchers found an inverse relationship between F&V
consumption and the risk of obesity. From baseline to 12-year follow-up, women with the largest increase in F&V consumption had a 24% lower risk of becoming obese than women with the largest decrease in F&V consumption. Women with the highest F&V consumption levels also had a 28% lower risk of gaining weight than women with the lowest
consumption.30 In a study combining participants from the Nurses’ Health Study and Health Professional Follow-up Study, a total of 120,877 men and women were followed in three 4-year intervals. Mozaffarian and colleagues (2013) determined that with each 4-4-year period, decrease in weight was statistically significantly associated with fruit consumption (-0.49 pounds) and vegetable consumption (-0.22 pounds), however this was clinically
However, due to the specific study population, it could be argued that these studies have limited generalizability to men and women of all ages.
In a broader study assessing adherence to the Mediterranean diet (high intake of F&Vs and cereals and low intake of meat, with olive oil serving as the main source of added fat) among men and women in Spain, researchers found that high adherence was associated with reduced risk of becoming obese among individuals.29 Another European study using EPIC data from 5 countries (Italy, United Kingdom, Netherlands, German, and Denmark) found an inverse relationship between abdominal adiposity (measured in waist
circumference) and F&V consumption. Among the 48,631 participants, with each additional 100 kilocalorie increment of fruits and vegetables, waist circumference decreased by 0.08 and 0.04 centimeters per year, respectively.34
II.E. Methodological Limitations
Much of what is known about the protective factors of fresh F&V is from cohort, case-control, and observational studies. Although these studies can show a relationship between obesity-related disease and diet, there are often issues regarding measurement error, confounding, and omitted variable bias. Measurement error often arises during dietary recalls when individuals are asked to remember the type, quantity, and frequency of foods
life. Additionally, omitted variable bias can occur when models do not take into account factors that affect the dependent variable. If models fail to include variables that affect obesity-related chronic disease, such as family history, the results may be biased and may under- or overestimate the protective factors of F&V.
To truly understand the relationship between diet and health, randomized control studies are needed to control for measurement error and other participant biases. Randomized control trials are seen as the gold standard in the research community because their
methodological design can demonstrate causality. Randomized control trials have been used to control a participant’s diet over time, which is more complex and costly than case-control or observational studies can capture.36-38
Although study results are mixed, it is suggested that consuming fresh F&Vs may serve as a protective factor against obesity and obesity-related chronic diseases, including cardiovascular disease and some cancers. However, many low-income people do not consume the recommended servings per week of fresh F&V for various reasons, including lack of geographic accessibility to food outlets.
III. Food Deserts
Over the past several years, the term “food desert” has become prevalent in nutrition research and policy and is used to describe areas with a lack of access to fresh, healthy foods. The United States Department of Agriculture defines food desert as “urban neighborhoods and rural towns without ready access to fresh, healthy, and affordable food.” Low-income census tracts qualify as food deserts if they have “at least 33% of the census tract’s
study that examined the extent and characteristics of food access issues in the United States.4 Additionally, in a 2010 literature review of 29 studies using GIS to measure food
environment, studies used 0.05–2 miles as the study distance, with bimodals being 0.5 and 1 miles.40 Areas defined as food deserts may receive federal, state, and foundation funding to improve their access, whereas areas that lack the label have greater difficulty in qualifying for the same opportunities.41-43 Many policymakers do not take into account the complex relationship between F&V access and consumption. They often focus on geographic
proximity to food outlets as a precursor to funding, which may not be an appropriate measure to gauge access.
Many studies on F&V access and consumption focus on distance to and/or density of food outlets in an area.4,40,45 Similarly, most public policies increasing access to healthy food focus on locating supermarkets in food deserts.46-48 However, living closer to food stores that sell fresh F&V may be necessary but not sufficient to improve F&V consumption among low-income individuals. There is evidence that access to healthy food includes multiple factors, including transportation to food outlets; convenience of purchasing and preparing fresh F&V; affordability, quality, and variety of F&V; nutrition knowledge; and cooking skills.49 These methodological limitations of defining access may be one reason for mixed results in studies assessing the relationship between F&V access and consumption.50-51
IV. The Relationship between Fresh Fruit and Vegetable Access and Consumption.
associated with the probability of having a healthier diet.12 Another study found that with each additional supermarket in a census tract, F&V consumption increased by 32% among African American residents.52 However, a longitudinal study involving over 5,000 young adults found that having geographic access to more supermarkets was unrelated to F&V consumption.53 The fact that results from quantitative studies using geographic proximity to measure the effect of F&V access consumption have been mixed may indicate that other factors influence consumption. Understanding that geographic access alone might not increase consumption, other studies have focused on other factors. A recent quantitative study of 495 residents in six low income communities in Chicago, Illinois, found that regardless of geographic accessibility, participants who reported higher quality, variety, and convenience had greater F&V consumption than participants who reported lower variety, selection, and convienence.54
IV.A. Fruit and Vegetable Access in Low-Income Populations
F&V consumption is an important component of a healthy diet because it helps prevent weight gain, fosters child development and growth, and reduces the risk of chronic disease.55-60 Unfortunately, most low-income individuals do not consume the daily
recommended amounts of F&V. The link between income and F&V consumption can be partially attributed to reduced access to fresh F&V. Low-income neighborhoods tend to have less access to grocery stores, supermarkets, or farmers’ markets and higher access to
Even when F&V are available, low-income individuals often cannot afford them. In the past 20 years, the price of fresh F&V has increased by 190%, in contrast to the price of foods having high fat and oil content, sugars and sweets, and carbonated beverages (which have increased by 70%, 66%, and 32%, respectively).63 Although living close to food outlets that sell fresh F&V is important for improving access (because one cannot buy what is not available), it may not be the primary factor for increasing F&V consumption. Qualitative research has been used to determine what other factors are important for improving F&V access, as well as which factors are most important as perceived by low-income populations.
IV.B. Qualitative Studies Involving Fruit and Vegetable Access in Low-Income Populations
To date, most of the literature on F&V access has been from quantitative studies focusing on proximity and type of food stores available in the community.10,64-65 However, only examining one aspect of access, such as distance, neglects vital information about the insights of lower-income individuals on access to F&Vs. Qualitative research is useful for generating detailed descriptions of a phenomenon, studying complex interactions that require some context, exploring new phenomena, and generating theoretical insights.66 To add to the knowledge gained from quantitative studies, qualitative research can be used to complement these studies and identify other F&V access factors to help gain a greater understanding of perceived barriers to low-income individuals’ consumption of F&Vs.
Many low-income individuals report barriers to accessing fresh F&V in their
communities. They often describe physical (distance to stores), material (quality of produce), and behavioral barriers (cooking and nutrition knowledge) that prevent them from accessing fresh F&V. A prior study by this author conducted with 8 focus groups showed that
affordability, quality, and variety of fresh F&V; nutrition knowledge; and cooking skills are all factors affecting access.5 Other qualitative studies have found similar findings; in 20 interviews with African Americans living in Philadelphia, reported barriers to F&V access included cost, convenience, quality, and availability. Facilitators included taste and health concerns, such as controlling weight, and blood pressure, and sugar levels (for diabetics).68 Interviews with 28 low-income individuals in upstate New York revealed that participants had concerns about the store venue including store environment, quality, and price.69 In another study involving two focus groups with African Americans in Pittsburgh, participants perceived that supermarkets in their community offered poorer quality produce, less nutrient-rich foods, and poorer customer service than supermarkets in higher-income, “white”
neighborhoods.70 Together, these findings suggest that low-income individuals feel that there are barriers to accessing fresh F&V, including food quality and cost, in addition to store proximity.
In 2006, Hendrickson and colleagues conducted focus groups in Minnesota with community residents (n=41), collected consumer surveys about local food outlets (n=396 in urban neighborhoods and n=400 in rural communities), and conducted an inventory of food available at stores located in the study communities.71 Focus group participants identified major barriers to shopping in their community as cost, quality of food, and variety of food. Results of the food inventory showed that fresh F&V within the more rural communities were costly, of fair or poor quality, and limited in number and variety. Food inventory results supported criticisms verbalized by focus group participants.
social-interactional barriers to food acquisition. Material barriers included availability of grocery stores in the neighborhood, upkeep and food product availability, and produce quality. Cost was listed as an economic barrier. Social-interactional barriers included safety concerns when traveling to the store, poor customer service, overcrowding in the store by other customers, and unsupportive sales practices (i.e., not accepting SNAP or EBT).72
Other qualitative studies conducted in the South include a study focusing on the food shopping behaviors of middle- and low-income women in eastern North Carolina. In 2010, Jilcott and colleagues interviewed 23 women about their food shopping behaviors. Reasons for shopping at supermarkets included affordable prices, convenient location, appropriate food quality, availability of specific foods, and adequate customer service.73 In another study involving five focus groups (n=48) with women in the South, reasons for shopping at certain stores included close proximity to home or work, affordable prices, good quality produce, and store characteristics (safety, cleanliness, and customer service).74
V. Program Options for Increasing Access to Fruits and Vegetables in Low-Income Communities
Several programs that have been used to increase access to fresh F&V in low-income communities include mobile markets, SNAP/EBT acceptance at farmers’ markets, and participation in community gardens. Although research about these programs has been promising, these studies are often limited in scope, lack valid dietary assessments to assess dietary outcomes, and have modest results.
V.A. Farmers’ Markets
Farmers’ markets are places for individuals to purchase fresh F&V while
simultaneously promoting the local economy by supporting farmers. Some reports have shown that farmers’ markets can increase F&V intake among lower-income individuals.75 Unfortunately, due to environmental and behavioral barriers such as transportation,
affordability, and social and cultural norms, low income-individuals are less likely to shop at farmers’ markets than middle- to higher-income individuals.75 To address these barriers, mobile farmers markets and food assistance programs at markets have been implemented.
V.B. Mobile Farmers’ Markets
servings/day.77 In a similar study, researchers found that the introduction of F&V stands in low-income neighborhoods for 12 weeks increased intake in fruits, green salad, tomatoes, and other vegetables, although this increase was not statistically significant.78
V.C. Food Assistance Programs
The main food assistance program to help low-income individuals purchase fresh F&V at farmers’ markets is the Supplemental Nutrition Assistance Program (SNAP),
formerly known as food stamps. Some SNAP recipients are able to use an EBT card, similar to a credit or debit card, to purchase produce at farmers’ market. EBT cards were developed to reduce the stigma associated with “food stamps” and are more efficient than using paper-based coupons. The EBT system was introduced in 2004, yet acceptance of EBT at farmers’ markets has been delayed due to high up-front installation costs, technical requirements, and transaction fees. In 2009, EBT sales at farmers’ markets accounted for less than 1% of the $50 billion SNAP redemptions for the year.79
In 2008, a pilot project involving 14 individual market stands at a Philadelphia farmers’ market found that after EBT implementation, EBT sales increased 33% from 2007 to 2008. The Philadelphia farmers’ market EBT sales were greater than the national average of paper-based SNAP coupons.80 Similarly, after EBT implementation at 23 of New York City’s 49 farmers’ markets, redemptions doubled from 2008 to 2009.81 Although these studies did not track individual F&V consumption, increases in SNAP redemptions at farmers’ markets are promising and likely reflect increases in F&V purchasing.
V.D. Community Gardens
vegetables.” It is hypothesized that community gardens can improve nutrition by increasing access to fresh, affordable F&V and removing barriers to access, including location and convenience. In a cross-sectional telephone survey involving 766 adults in Michigan, researchers examined the relationship between community garden participation and F&V consumption. Individuals with household members participating in the community garden were more likely to consume F&V than individuals whose household did not participate (4.4 servings/day compared to 3.3 servings/per day, respectively). Additionally, participating households were more likely to consume the recommended five servings of F&V per day than non-participating households (30% versus 18%, respectively).82
In a small cross-sectional survey involving 29 participants at a community garden in Moses Lake, Washington, more than half of the participants reported an increase in F&V consumption while participating in the community garden. Additionally, 80% of the
gardeners said they used the community garden to stretch their food dollars.83 More recently, an evaluation of a community garden–based obesity prevention program among 95 children found that after weekly gardening sessions and a 7-week cooking and nutrition workshop, the number of fresh, frozen, or canned F&Vs in the home significantly increased from 5.25 to 12.1 items. Items were measured by asking parents to record the name of all the fresh, frozen, and canned F&Vs available in the home and researchers counted and recorded each unique fruit or vegetable. Fresh, frozen, and canned F&V consumption among children significantly increased from 3.85 servings/day before the intervention to 6.9 servings/day after the
Although several studies have examined the impact and effectiveness of mobile markets, SNAP/EBT at farmers’ markets, and community gardens, research focusing on low-income individuals’ perceptions about these programs is still lacking. The next section will discuss how policy makers can impact F&V access by discussing policy options for
addressing access to healthy food.
VI. Policy Options for Addressing Access to Healthy Food
One of the most cited public health successes in influencing individual behavior is the fight against tobacco companies to reduce smoking rates. Policymakers and public health advocates successfully implemented increases in tobacco taxes, marketing restrictions, and smoke-free institutions to help reduce smoking rates.As a result, from 1965 to 2011, smoking rates decreased from 42% to 19%.85
disincentives), and restricting unhealthy foods/drink purchased with SNAP benefits (restrict choice).
It is suggested that state-level policies can influence multiple levels of the SEM and, in turn, affect individual behavior.86 While addressing access to healthy food through state legislation is a considerably new policy trend,87 it has been very effective in combating smoking and may also influence consumption of healthy foods, which may, in turn, lead to decreased obesity-related chronic diseases.
VII. Tobacco and Obesity
For decades, tobacco use was at the forefront of the public health agenda and has been one of the most cited public health movements of the 20th century.88,89 Policymakers and public health advocates involved in the war against tobacco implemented higher tobacco taxes, marketing restrictions, and smoke-free institutions to reduce smoking rates.90 Two important factors that helped contribute to the fight against tobacco were a strong scientific base about the health consequences of tobacco, secondhand smoke, and growing social disapproval of tobacco companies.88 Similar to smoking, food has psychological, social, and environmental factors that can influence behavior.88 Because of these similarities, public health researchers are calling obesity the “new tobacco” and urge policymakers and advocates to adapt the same arguments used against tobacco for obesity.89
VII.A. Issue Framing in the Tobacco Wars
lung and laryngeal cancer in men, was a probable cause of lung cancer in women, and was the main cause of chronic bronchitis.91 From then, the tobacco industry spent the next 50 years defending their products to the American public and policymakers. The tobacco industry relied heavily on framing arguments, defined as “the process by which someone packages a group of facts to create a story”92 to counteract the anti-smoking pushes from the public health community.
Framing theory is built on the idea that individuals, groups, and societies view issues from various perspectives. All individuals have preconceived beliefs and values that likely have been a part of their culture for long periods of time. Speaking to these individuals’ core values and beliefs is critical in highlighting and promoting specific issues. Because
individuals organize their thoughts and perceive issues differently, framing attempts to influence the way an individual thinks about an issue by selecting certain aspects of an issue to prompt a specific response.92 The overall goal of framing is to influence peoples’ opinions, decisions, and behaviors by appealing to their core values by using arguments or facts that they are willing to accept.93
The way issues are framed can also influence policy formation.94 As Wagenaar and Streff (1990) explain, “How questions are worded is related to how policy advocates and opponents shape and present policy options to legislators and other opinion leaders, as well as the general public.”95 In the policymaking process, political battles are rarely won using logical and rational arguments. They are won based which side can better frame an argument that resonates with public opinion and political will.96
images to promote itself as a good corporate citizen, defender of the First Amendment, protector of free choice, and friend of the family farmer. The industry paints anti-tobacco people, on the other hand, as zealots, health fascists, paternalists, and government
interventionists.”92 Based on content analyses of the tobacco industry’s framing of
arguments, the industry focused on four main arguments: promoting individual choice and personal responsibility (liberty), fear of big government, economic security (promoting the economy), and lack of truthfulness (manipulation and deceit of scientific evidence).97-100
In contrast to the tobacco industry’s frames, content analyses of the public health community’s framing of arguments in opposition to smoking, researchers found that they focused heavily on appealing to the core values of health; communicating to the public that they were protecting their health; and trying to eliminate preventable smoking-related deaths (“smoking kills”). Just as the tobacco industry pushed smokers’ rights, the public health community also tried to appeal to non-smokers’ rights, in that they had the right to be protected from secondhand smoke in public places. They also frequently used the analogy that antismoking advocates were the “underdog” fighting against huge corporations (David vs. Goliath). Last, the public health community argued that the tobacco industry was deceitful in that they manipulated their products and denied the consequences of smoking (truthfulness).106-109
VII.B. Individual Choice and Personal Responsibility
industry repeatedly honed in on this issue of personal freedom.101 Tobacco companies asserted that consumers had a right to use—or not use—tobacco as they pleased and claimed that because consumers were presented with enough information to make an informed choice about tobacco, they should be allowed to choose whether or not to smoke.98 However, as revealed later in internal documents from the tobacco industry, consumers did not always receive appropriate information to make informed choices about smoking.
Public health advocates also appealed to personal rights—more specifically, non-smokers’ rights.102 They argued that non-smokers should have the right to be protected from secondhand smoke in the workplace and public places.100 In a content analysis of the framing of tobacco issues published in The Washington Post from 1985 to 1996, 30% of articles from 1985 to 1982 and 20% of articles from 1993 to 1996 focused on non-smokers’ rights.94 Additionally, the public health community promoted the idea that they too were protecting freedom of choice. They argued that because smokers were addicted to nicotine, the tobacco industry was making it difficult for people to exercise freedom of choice.100
Fear of Big Government
Government… There They Go Again.”103 They argued that the government should allow the market to give consumers what they wanted—their cigarettes.
David versus Goliath Analogy
In contrast to the tobacco industry’s free enterprise frame, the public health
community argued that tobacco was a “killer” and that it should be regulated in society’s best interest: their health.100 As one political scientist noted, “the health of free enterprise is compromised by tobacco related illnesses and deaths that cause a loss of jobs, productivity, and sales.”103 Because tobacco consumers were addicted, public health advocates deemed that it was necessary for the government to regulate tobacco for smokers’ and non-smokers’ safety. To fight the image of Health Nazi, the public health industry portrayed itself to the public as David versus Goliath. That is, public health workers and advocates tried to protect society and fight off the “huge corporate monster” with little money and few resources.100
Economic Security
productivity and increased healthcare costs, both of which shook the foundation of economic security.103
Lack of Truthfulness
During the tobacco fight, both sides argued that researchers were manipulating
science as a means to deceive the public and promote their own agenda. The tobacco industry publicly questioned the link between tobacco and cancer. They announced that there was no real scientific proof to show a causal link between the two. They also referred to public health statistics as “junk science.”100 Later on, the tobacco industry argued that any harms that smoking caused were so well known that tobacco users had enough information to make informed choices.
The public health community argued that the tobacco industry was deceitful in that it manipulated nicotine levels so consumers would become more easily addicted. The public health community also highlighted that the tobacco industry was not being truthful to the public when talking about the health consequences of smoking: The tobacco industry used conflicting medical evidence when communicating to the public and hid negative scientific data about the harms of smoking to undermine evidence put forth by the public health community and the Surgeon General’s reports.94
a necessary requirement for the human body and existence. Physicians can recommend to their patients that they stop smoking, but they cannot recommend that they stop eating. Therefore, although there may be similarities between access to healthy food and tobacco frames, there might be different frames used in the food debate that do not mirror the tobacco frames.
Several of the similar frames might include: the food industry being portrayed as a “killer” in that unhealthy foods can cause morbidity and mortality; the food industry
impeding personal choice because consumers do not have the information they need from the food industry to make informed choices about food due to misinformation; manipulation and deceit by the food industry to target youth and minorities as consumers for their products; and David versus Goliath—the public health community is only protecting the health of society by stepping in against the “big bad food industry.” As with the anti-tobacco
movement, if individuals are more aware of the health consequences of unhealthy food and the protective factors of F&Vs, they might be more likely to consume less unhealthy food and more F&Vs.
VIII. Conclusion
The United States has been experiencing increased rates of obesity and obesity-related chronic diseases for the past 30 years. F&V consumption is important for preventing chronic illness and may be one component to preventing obesity, but low-income individuals lack access to fresh F&V and more research is needed to determine the relationship between F&V access and consumption. Community- and policy-level factors may greatly influence F&V access and consumption, however many questions remain as to how they may be best implemented. Due to the complexity of inter-related factors affecting F&V consumption, mixed-methods research is needed to determine the relationship between F&V access and consumption. The research in this dissertation will provide information that addresses individual-, community-, and policy-levels factors that affect F&V access and consumption.
Aim 1 assesses low-income individuals’ perceptions about how F&V access programs in North Carolina can improve F&V consumption, which can be disseminated to private and non-profit organizations, the academic community, and state governments. Aim 2 will compare the predictive power of geographic information systems and self-reported data for estimating the association between F&V access on F&V consumption. Last, Aim 3 will determine which states have passed food policy legislation, what the legislation entails, and the arguments used to support or oppose the legislation. This analysis will increase our understanding of both sets of arguments being used and may be important to advocates and policymakers who are interested in passing similar legislation in their states. These outcomes are expected to have a positive impact on community and public policies because
FIGURES
CHAPTER 2: LOW-INCOME INDIVDIUALS’ PERCEPTIONS ABOUT HOW FRUIT AND VEGETABLE ACCESS PROGRAMS CAN IMPROVE ACCESS AND
CONSUMPTION: A QUALITATIVE STUDY Introduction
In the past 30 years, obesity rates among adults in the United States have more than doubled and approximately two-thirds of adults are currently overweight or obese.1
Consuming healthy foods, including fresh fruits and vegetables (F&V), can help prevent weight gain and reduce the risk of chronic diseases, including heart disease, diabetes, and some cancers.1 Unfortunately, most individuals, especially those with lower incomes, do not consume the recommended servings per day of F&V.2,3 In North Carolina, 15.2% of adults with an annual income of $15,000 or less meet the USDA’s 2010 F&V intake guidelines compared to 30% of adults with annual incomes of more than $50,000.3 F&V intake is directly related to F&V access.11,52,54
Access to and consumption of fresh F&Vs can be defined as a multi-dimensional issue that can be explained using a socio-ecologic framework that includes various individual, interpersonal, community, and public policy factors influencing it (see Figure 2.1). Dimensions can interact with each other to influence F&V access and, in turn, F&V consumption. Access can include geographic proximity; transportation to food outlets; convenience of purchasing and preparing fresh F&V; and affordability, quality, and variety of fresh F&V.5 However, many low-income individuals experience barriers to accessing and consuming fresh F&Vs. To address access and consumption issues, mobile markets,
Program (SNAP) and Women, Infant, and Children’s Program (WIC) at farmers’ markets, and community gardens are all designed to overcome specific barriers. However, the
literature regarding the effectiveness of these F&V access programs is limited. To date, there have been limited studies examining whether these programs adequately address access and consumption barriers as perceived by low-income individuals.
Mobile markets such as mobile farmers’ markets, food trucks, and/or produce stands are convenient places for individuals to purchase fresh F&V while at the same time
promoting the local economy by supporting local farmers. The Supplemental Nutrition Assistance Program (SNAP), formerly known as food stamps, is a federal food assistance program that facilitates the purchase of food by low-income families and individuals. At some farmers’ markets, SNAP recipients can use an Electronic Benefit Transfer (EBT) card, similar to a credit or debit card, to purchase produce. EBT cards have the potential to reduce the stigma associated with food stamps by making it look like a credit/debit card and being more efficient than using paper-based coupons.104 However, not all food vendors have EBT terminals to process transactions. A more recent type of F&V access program is a community garden, a shared space for neighborhood residents to grow fresh, healthful, and affordable produce. Recent studies about community gardens showing that they improve nutrition by increasing access to fresh, affordable F&V and removing barriers to access, including location and convenience, have been promising.84
community gardens) can address barriers to F&V access and consumption as perceived by low-income individuals. Understanding low-income individuals’ perceptions can help identify opportunities that can be used to strengthen F&V programs and offer insight into program acceptability. Results from this study will help determine what aspects of F&V programs are important to consider and may have the biggest impact on F&V consumption, as perceived by participants.
Methods
To date, much of the literature on F&V access and consumption has been from quantitative studies focusing on proximity and type of food stores available in the
community.105-107 This study uses a qualitative, rather than quantitative, research approach to describe, understand, and explain low-income individuals’ perceptions about F&V access programs that may not have been identified through quantitative surveys. Qualitative research is the preferred research method when generating detailed descriptions of a phenomenon, studying complex interactions that require some context, exploring new phenomena, and generating theoretical insights.66 To add to the knowledge gained from quantitative studies, qualitative research can be used to complement these studies and identify other F&V access factors to help gain a greater understanding of perceived barriers to low-income individuals’ consumption of F&Vs.
others in the group.105-106 Focus groups are an opportunity for researchers to gain thick, rich descriptions about a certain phenomenon.107 Because little is known about low-income individuals’ perceptions about community F&V access programs, focus groups can be used to inform future quantitative work by identifying relevant themes and guide survey
development.
Setting
North Carolina’s population is the 17th most overweight in the country.1 Additionally, it is ranked in the top 10 agricultural producing states in the country, with approximately 20% of commodities being crops for human consumption: 7% tobacco, 4.7% fruits and vegetables, 4.5% soybeans, and 3.4% corn.108 However, North Carolina also ranks in the top 10 for food insecurity.109 Because North Carolina has one of the highest rates of obesity and food insecurity in the country yet an abundance of local agriculture, it was considered an ideal setting for this study. Focus groups were conducted across five urban North Carolina counties: Buncombe, Durham, Guildford, New Hanover, and Orange counties (see Figure 2.2). These five counties were selected to help ensure geographical representation from North Carolina’s three regions: the Mountains, the Piedmont, and the Coastal Plains. All counties are a mix of urban and suburban communities. Approximately 25% of adults in these counties are obese and 16% are living below the federal poverty level.
Moderator Guide
A socio-ecological framework (SEF) helped inform development of the
societal (public policies and systems) factors.6 Recognizing that many factors influence F&V access, the research team included questions in the moderator guide that would capture the varying levels of influence that affect F&V access programs (see Appendix). The moderator guide was tested in a pilot focus group with 6 participants in a low-income housing site to ensure that participants could interpret and understand questions. Questions were written to elicit discussion about participants’ thoughts on purchasing produce from mobile markets, ways to improve current mobile markets, ability to use EBT at farmers’ markets, interest in community gardens, ideas for improving the community garden experience, and strategies for improving fresh F&V access in their community. The moderator guide was translated into Spanish by a native Spanish speaker (MPJ)a with a master’s in Clinical Psychology working on her doctorate in Health Policy at the University of North Carolina.
Recruitment
A purposive sampling strategy was used to recruit low-income individuals.107 Focus group participants were recruited with the help of staff at community-serving organizations in five counties. Community organizations, including non-profit organizations, faith-based agencies, and the North Carolina Division of Public Health, were identified using the Internet. Researchers asked staff at community-serving organizations that provided services to and/or advocated for low-income individuals to help with focus group recruitment (see Table 2.1 for a list of organizations). These organizations were contacted and asked to help identify key informant staff members who could (1) provide information about the dietary concerns of people served by the organizations, (2) identify and recruit low-income
individuals served by their organization who might be willing to participate in focus groups, and (3) facilitate scheduling of focus groups.
Key informants used word-of-mouth and flyers to disseminate study information to potential focus group participants served by their organizations. Using key informants to deliver study information is an effective recruitment strategy because they have established relationships with community members and are able to quickly identify potential participants that may have an interest in the study.66 Researchers asked key informants to over-recruit for each focus in anticipation that there would be no-shows. Key informants were provided a $40 gift card as compensation for their time.
Focus Groups
Focus groups took place at locations convenient for participants, including
community centers, churches, and resource centers. Table 2.1 lists other site-specific focus group characteristics. Because of the focus group location, many of the participants knew each other and some were related. Prior to starting each focus group, participants provided informed consent and completed a demographic survey. Each focus group lasted
approximately 60 minutes. Eight of the focus groups (Orange and Durham County) were moderated by the researcher and another qualitative researcher; the Latina focus group was conducted entirely in Spanish by a native Spanish speaker trained in qualitative research methods (MPJ). Participants received a $25 grocery store gift card as compensation for their time. Personal identifying data were not collected from participants and any personal
Data Analysis
Analysis involved three phases: coding, within-group analysis, and between-group analysis. Focus groups were transcribed verbatim and analyzed in Atlas.ti 7.0 (Atlas.ti Scientific Software Development, Berlin, Germany). For the Spanish focus group, audio recordings were first transcribed in Spanish and then translated to English by native Spanish-speaking doctoral students. A general inductive approach was used to identify focus group themes with the preconception that multiple levels of influence might affect participants’ perceptions of F&V programs, including how personal food preferences influenced program use (individual-level factors), how the community food and store environment created barriers to fresh F&V (community-level factors), and the role of EBT cards in promoting F&V access (policy-level factors). Participants also offered feedback on which barriers F&V programs could help overcome, as well as what they could not overcome. Using inductive analyses is considered an appropriate approach to analysis because it allowed for the capturing of ideas that might have been overlooked if using an established codebook.110 Inductive codes were used to identify themes and factors and connect the vast topics of conversation noted by different groups of people.
Codebook
The codebook for this study was developed through an iterative process. A second coder was used (LA)b to help with coding to improve the study’s rigor. Transcripts were read multiple times before beginning the coding process to ensure that researchers were well-versed with the data. In the initial coding phase, the lead author (LHM) and the second coder (LA) independently applied open coding to two transcripts to identify topics and issues raised
by participants. Researchers compared open codes, reconciled coding discrepancies through discussions, and then merged codes into an initial coding book that was applied to all the focus groups. During the first phase of coding, codes were added and revised to help reflect and capture the data more appropriately. Researchers discussed the revisions, adapted the initial codebook, and applied the revised codebook to all focus groups for a second cycle of coding. Code discrepancies were discussed and consensus was reached to ensure inter-rater reliability.
Within- and between-group analysis.
Researchers generated reports of all text segments for each code in the focus group and examined code frequency (i.e., how often a code appeared up in a transcript) and code correlation (i.e., which codes are likely to appear up in the same sentence or topic) for each individual focus group. Code frequency and co-occurrence were used to identify patterns and themes. Once the main patterns and themes were identified, they were compared across the groups. Between-group analysis was used to determine whether identified patterns and themes were consistent across focus groups.
Results
Thirteen focus groups were conducted across five North Carolina counties