_
The AIA collects and disseminates Best Practices as a service to AIA members without endorsement or recommendation. Appropriate use of the information provided is the responsibility of the reader.
INTRODUCTION
The basics of accounting for architecture firms are not complex. However, an understanding of certain fundamentals – by every manager at every level of a firm – is imperative for the firm to be able to manage towards profits and financially stability.
An Income Statement, or P&L, reports the revenues, expenses, and income or loss over a specific period of time, such as a month, a year, or year-to-date. The Balance Sheet, also called a Statement of Financial Position, reports the company’s financial position on a specific date, matching the same date of a corresponding Income Statement: end of the month, end of the year, or other year-to-date period. To firm managers, the P&L is usually the center of attention and primary report of interest. To an accountant or banker, the Balance Sheet is a financial ‘snapshot’ or ‘picture’ of the entire firm that reflects the financial security, stability, and
creditworthiness of the firm. The Balance Sheet usually does not catch as much attention as the P&L from firm managers unless there are turbulent times.1 This Best Practice explores accounting basics related to the Balance Sheet. The article also addresses certain industry-standard ‘key performance
indicators’ (KPIs), derived from specific elements of the Balance Sheet, that are essential to monitoring the overall financial condition of the company. In other words, as with the Income Statement, basic accounting data are used to create financial information used to better manage the firm. These are the ‘bridge’ from accounting to finance.
1
For more information on the P&L, see 07.02.01 “Accounting Basics: The Income Statement & Key Performance Indicators.”
CASE STUDY
An owner started a new firm. Assume it was on January 1st. The new owner had a client with a good size project to immediately start. He had lined up some office space, liability insurance, and hired seven other architects, a couple engineering consultants, an accountant and an administrative assistant. He also borrowed $200,000, repayable quarterly over four years at 6% interest ($12,500, plus interest, per quarter), and invested $100,000 of his own.
He spent New Year’s Day (owners work on holidays) furnishing the office with $100,000 of office space remodeling, desks, computers, and supplies (FF&E), prepaid some expenses, put down a deposit for rent, and the next day the new employees started the project. The start of the project went smoothly, and before going home on January 31st, the owner sent out the firm’s first invoice for $130,000 and recorded the firm’s first revenues for all of its and its consultants’ January work.
The same smooth process repeated itself in February, and the second $130,000 invoice went out on February 28th for its February work, now doubling the firm’s year-to-date revenues. March followed the same way, except for one thing: On March 31st, the firm received payment of its January invoice – the first time the firm had received any money for its work. Yet, in the meantime (since January 1st) salaries, payroll taxes, employee insurance premiums had been paid, as had rent, utilities and other overhead expenses. The P&L for the first month and first quarter (and assuming that each of the next three quarters were the same, except for a lessening of interest) probably looked like this example. (Note: All numbers in this example – the P&L and Balance Sheet – are generally consistent with industry averages.)
Accounting Basics: The Balance Sheet & Key
Performance Indicators
Table 1 – Example P&L Statement 1st Month 1st Quarter 1st Year Total Revenue $130,000 $390,000 $1,560,000
Consultants & Other Direct Expenses 30,000 90,000 360,000
Net Revenue $100,000 $300,000 $1,200,000
Direct Labor 33,333 100,000 400,000
Gross Profit $66,667 $200,000 $800,000
Indirect Salaries 20,000 60,000 240,000
P/R Taxes, Employee Insurance, Etc. 13,333 40,000 160,000
Rent, Utilities, Supplies & Other OH 21,667 65,000 260,000
Depreciation 1,667 5,000 20,000
Operating Profit / (Loss) $10,000 $30,000 $120,000
Interest 1,000 3,000 10,875
Accrued Bonuses 2,667 8,000 32,000
Taxable Profit / (Loss) $6,333 $19,000 $77,125
Taxes (Est. 40% State & Fed) 2,533 7,600 30,850
Net Income / (Loss) $3,800 $11,400 $46,275
Operating Profit Rate 10.0% 10.0% 10.0%
Net Multiplier 3.00 3.00 3.00
Utilization Rate 62.5% 62.5% 62.5%
OH Rate 170.0% 170.0% 170.0%
Employees 10 10 10
Net Revenue per Employee $10,000 $30,000 $120,000
Does this mean that the owner already has $3,800 in his pocket after a month, $11,400 in his pocket after a quarter? Absolutely not; in fact, far from it! The “accrual-based” P&L just reflects the $390,000 of revenue and $378,600 of expense activity since January 1st, not the fact that the firm has only been paid for one month’s work. (“Accrual-basis” means that financial transactions are booked when they occur, not when the cash actually comes in or goes out the door – that is called “cash-basis.”) So what is the firm’s real financial position on March 31st? This is where the Balance Sheet comes in.
BASIC CATEGORIES OF THE BALANCE SHEET
The Balance Sheet is a financial statement that has three parts: Assets; Liabilities; and Stockholders Equity (or Net Worth). It is called a balance sheet because the three categories must always balance out, as follows:
Assets = Liabilities + Equity
An example Balance Sheet follows as Table 2, but before the specifics of it can be discussed, some basic terminology is required.
Assets are what the firm owns and is owed. The primary thing it ‘owns’ is Cash; in other words, the amount of money in the bank at any given point in time. Cash keeps a firm in operation.
Next in importance is Accounts Receivable (A/R). Remember that this firm has issued invoices each of three months, but has only received payment for January. After that is Work-In Process (WIP). Employees may get paid by the hour, but it does not mean invoices to clients go out hourly; usually it is just once / at the end of a month. There are also some (usually) small amounts in Assets that reflect things like rent deposits, and prepaid expenses (e.g., professional liability insurance is usually paid in advance, but only a month’s worth of the total premium is recorded as an Expense on the P&L each month).
What has just been described are generally referred to as
Current Assets because they are constantly changing. (Somewhat technically, Current Assets are those that will be changing, by addition or elimination, within a year’s
time.)
Another type of Asset subgroup is called Fixed Assets. Conversely to Current Assets, these have a life expectancy of over a year. Do not doubt that they require any less Cash, but they are just treated differently on the P&L for reporting purposes. These include things like leasehold improvements, and FF&E – long-term investment expenditures. You will not see the whole amount of major elements like these on the P&L statement when the cost is incurred. (Imagine how a $100,000 investment in a particular month would distort the P&L as a reflection of operations for that month.) Rather, the cost of such long-lasting investments are “depreciated” over what is called its “useful life.” Depreciation means that a portion of the cost of each of these items is expensed through the P&L. (Computers may have a useful life of, say, 36 months. Only a portion of their cost is reflected on the P&L each month.)
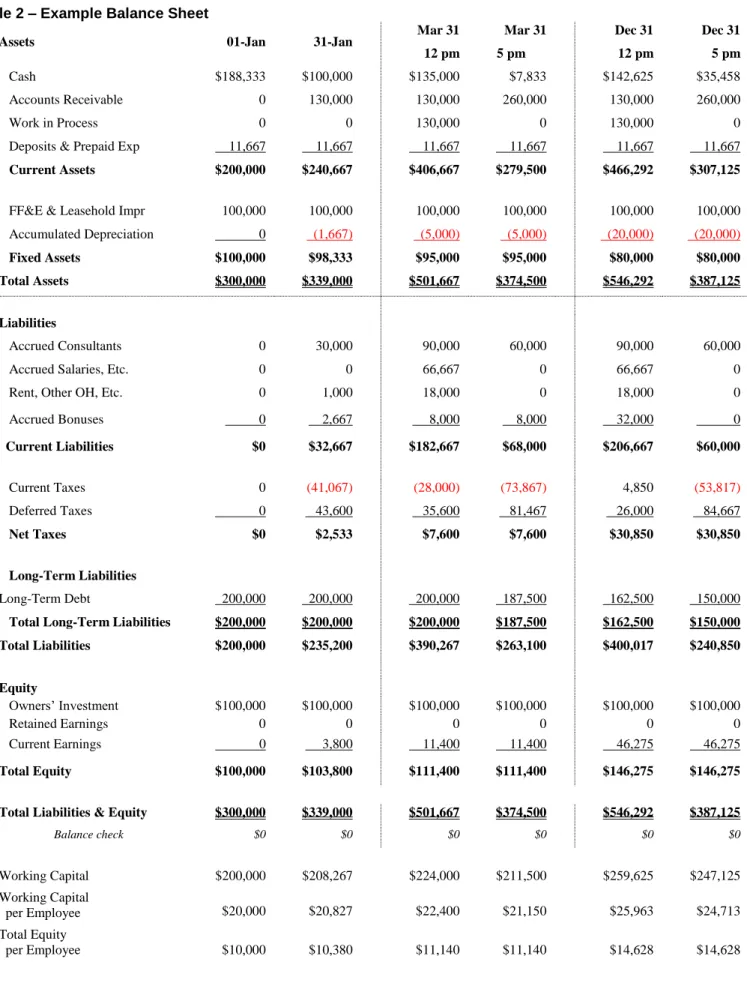
Table 2 – Example Balance Sheet
Assets 01-Jan 31-Jan Mar 31
12 pm Mar 31 5 pm Dec 31 12 pm Dec 31 5 pm Cash $188,333 $100,000 $135,000 $7,833 $142,625 $35,458 Accounts Receivable 0 130,000 130,000 260,000 130,000 260,000 Work in Process 0 0 130,000 0 130,000 0
Deposits & Prepaid Exp 11,667 11,667 11,667 11,667 11,667 11,667
Current Assets $200,000 $240,667 $406,667 $279,500 $466,292 $307,125
FF&E & Leasehold Impr 100,000 100,000 100,000 100,000 100,000 100,000
Accumulated Depreciation 0 (1,667) (5,000) (5,000) (20,000) (20,000)
Fixed Assets $100,000 $98,333 $95,000 $95,000 $80,000 $80,000
Total Assets $300,000 $339,000 $501,667 $374,500 $546,292 $387,125
Liabilities
Accrued Consultants 0 30,000 90,000 60,000 90,000 60,000
Accrued Salaries, Etc. 0 0 66,667 0 66,667 0
Rent, Other OH, Etc. 0 1,000 18,000 0 18,000 0
Accrued Bonuses 0 2,667 8,000 8,000 32,000 0 Current Liabilities $0 $32,667 $182,667 $68,000 $206,667 $60,000 Current Taxes 0 (41,067) (28,000) (73,867) 4,850 (53,817) Deferred Taxes 0 43,600 35,600 81,467 26,000 84,667 Net Taxes $0 $2,533 $7,600 $7,600 $30,850 $30,850 Long-Term Liabilities Long-Term Debt 200,000 200,000 200,000 187,500 162,500 150,000
Total Long-Term Liabilities $200,000 $200,000 $200,000 $187,500 $162,500 $150,000
Total Liabilities $200,000 $235,200 $390,267 $263,100 $400,017 $240,850 Equity Owners’ Investment $100,000 $100,000 $100,000 $100,000 $100,000 $100,000 Retained Earnings 0 0 0 0 0 0 Current Earnings 0 3,800 11,400 11,400 46,275 46,275 Total Equity $100,000 $103,800 $111,400 $111,400 $146,275 $146,275
Total Liabilities & Equity $300,000 $339,000 $501,667 $374,500 $546,292 $387,125
Balance check $0 $0 $0 $0 $0 $0 Working Capital $200,000 $208,267 $224,000 $211,500 $259,625 $247,125 Working Capital per Employee $20,000 $20,827 $22,400 $21,150 $25,963 $24,713 Total Equity per Employee $10,000 $10,380 $11,140 $11,140 $14,628 $14,628
All items have different “useful lives,” which is for the accountants to track, but do not doubt that the money did go out of the firm’s checkbook when the items were purchased. The Balance Sheet is a repository for recording the whole amount that has been spent on such big ticket, long-term items (things the firm owns), and how much has been expensed (depreciated) through the P&L.
Liabilities are what a firm owes to others; they are its unpaid expenses and other debt. Here also, there are categories for both Current and Long-Term Liabilities. Using the one-year time frame again for the term, Current Liabilities include all the Expense items on the P&L, except Depreciation, that have not yet been paid, but will be soon. Typical items are Accrued Consultants (their bills to the firm are included on the firm’s invoice to the client, and they usually are paid when the firm is paid), Accrued Salaries (including salary-related expenses such as payroll taxes and health insurance premiums), and rent & other overhead expenses.
Of special note is that those last two items – salaries & related expenses, rents and other overhead – need to be paid when due, not just when, in this case three months later, the client pays the firm. All firms are paying salaries & overhead expenses well in advance of actually being paid itself. This leads to a term called “Working Capital” (the cash that needs to be invested to keep a firm ‘working’ until it gets paid) that will be further discussed later. Two other items appear in the Current section because they fall within the ‘one-year’ rule, but usually are not paid monthly. This firm has a policy of adding some amount of Accruing Bonuses in expectation of paying bonuses (enough profit and Cash being available to permit it) at year end. There also are annual taxes to be paid, just like employees have to pay. (Note that there are both Current & Deferred Taxes shown in Table 2, but that they net out to the amount shown in the P&L, Table 1. An explanation of the two is beyond the scope of this paper.)
Long-Term Liabilities include items like bank loans and other long-term debt borrowings the firm has made and still owes. Most firms need to borrow to start a firm, but depending on the individual firm’s fiscal policies and financial plans, may choose to pay it off, and, therefore, it does not appear on all firms’ Balance Sheets.
Stockholders’ Equity (often call Net Worth) is what is left after netting out all Liabilities against all Assets. It includes the capital the owners have invested over the life of the firm, and reflects the Book Value of the firm today should all the A/R be collected, other assets liquidated, and all bills, loans and other debts paid off.
Finally, after all that theory, let’s look at the firm’s P&L in Table 1 and try connecting it to the firm’s Balance Sheet in Table 2. Here is a quick look at what the firm’s Balance Sheet already could look like as of January 1st when the
firm opened, on January 31st at the end of the first month,
and on March 31st at the end of the 1st Quarter. (Assuming that each of the next three quarters was the same, the firm’s year-end Balance Sheet is included, too.)
Further, for March 31st (and for December 31st, too), the
Balance Sheet is shown twice: first before depositing the $130,000 check each month (12 pm). Here you can see the firm having a lot of Cash, but it also shows all the Liabilities it has, too.
The Balance Sheet is again shown at the end of the day (5 pm) after paying the month’s salaries & other bills, and making the required loan payment, but also after sending out the March invoice.
Yes, the owner of this new firm that is just three months old, has invested $100,000 and borrowed $200,000 ($300,000 of Invested Capital) just to get to the date of getting paid for the firm’s first invoice. And, yes, there is a (great) feeling of relief receiving that $130,000 check. Overall, the owner already has Total Assets of almost $374,500, but also has Total Liabilities of about $263,100. Where is all this money, and why are the numbers often different from the more or less simple looking P&L? As of March 31st, before the $130,000 check was deposited, only $5,000 of Cash was left from the $188,333 of Cash the firm had on January 1st. The $183,333 had been used through January, February & March to pay salaries & related payroll expenses, rent and other operating expenses just to keep the firm’s doors open until that first check for January’s work was received.
When the check is deposited on March 31st, the firm then has $135,000 of Cash. The firm also still has $130,000 of
Accounts Receivable (A/R) for its February invoice (that will hopefully be paid on time for the April 30th salaries and overhead bills), and $130,000 of Work-In-Process from its March work that will be billed by close-of-business. (A/R are and always will be one of the most frequently discussed items in any firm. As seen here, even though the firm has work to keep everyone busy, it has taken three months from the date the firm opened and work on the project started before the first client monies came into the office. All expenses paid to date, including three months of salaries, rent, phones, and supplies, have come from monies invested or borrowed by the owner. This shows how any A/R that are late put significant additional financial strain on the firm.)
Since it is March 31st, it is also payday for this firm, and $66,667 of salaries, payroll taxes, insurance premiums, etc., has been accrued, and also must go right back out the door today. The firm also has accrued $18,000 for rent, other overhead bills, and loan interest that are due. As the amount received was also for 1/3 of their work completed, 1/3, or $30,000 of the Accrued Consultants’ to-date fees of
$90,000 needs to be paid. That means that $114,667 of the $130,000 is gone the same day it came in. Finally, a $12,500 payment, plus interest, on the loan is due. Depositing the check and paying all these bills is the difference between the Balance Sheets at 12 pm and at 5 pm. All that remains is about $2,833, leaving a total of about $7,833 in Cash for paying firm expenses between now and when the next client payment of $130,000 is received at the end of April.
The firm has also accrued $8,000 towards bonuses for distribution later in the year. Similarly, the firm has accrued $7,600 for federal & state taxes. (Note that there are both a Current Tax liability and a Deferred Tax liability. At this point, these seem to be strange numbers – and they are, as will be explained later. For now, suffice it to say that most firms are allowed to pay taxes on a cash-accounting basis instead of on an accrual-accounting basis. But note that the two numbers net to the $7,600 tax amount on the March P&L.)
Since this is the first year of the firm, there are no Retained Earnings yet. Retained Earnings are the amount of Net Income left in the firm from previous years’ profits to, among other things, save to finance future growth, cover costs during a slowdown, or payoff the borrowed money – or it may “stay” in the firm because there simply is not enough Cash to write a check to the owner without stretching the firm’s operating cash balance to below a “safe” margin. At the end of this first year, the owner will not take home the Net Income, or Current Earnings, because there is not even that much Cash available; it is still in the A/R of the firm.
BALANCE SHEET KEY PERFORMANCE INDICATORS (KPIS)
The Balance Sheet may look like just a bunch of numbers, but there are important relationships among the numbers, referred to as Key Performance Indicators (KPIs), derived from specific elements of the Balance Sheet, that are industry-standard, and essential to monitoring the overall financial condition of the firm.
In other words, as with the P&L, basic accounting data are used to create financial information used to better understand and manage the firm. These are the ‘bridge’ from accounting to finance. Among the most important and most monitored are:
Days Accounts Receivable
Working Capital
Working Capital per Employee
Working Capital Ratio
Fixed Assets per Employee
Total Liabilities to Equity
Days Accounts Receivable
A/R are a constant discussion item within any firm. Days A/R quantifies the average length of time it takes to collect money from a client once an invoice has been issued. It is defined as:
A/R / Most Recent 12-Months’ Revenues x 365 In our example, at year end, Days A/R is:
$260,000 / $1,560,000 x 365 = 61 days
This is a reasonable number. Most A/R reports breakout A/R into aged categories, particularly <30 days, 31-60 days, 61-90 days, 90-120 days, and >120 days. The older the receivable the more attention is warranted, as it may indicate an unhappy, or financially struggling client. Remember, A/R is not Cash, and only Cash can actually pay salaries and other operation expenses. That is why “Cash is King” is a popular expression.
(FYI, when examining a firm’s A/R, for credit purposes, a bank or valuation firm may discount – or not even consider – receivables greater than 120 days, and sometimes even 90 days.)
Working Capital
Working Capital is the amount of invested capital being used just to support day-to-day operations – paying for salaries, rents, and other overhead expenses – between the time work is being done, then invoiced, and the time payments are received from clients. Working Capital is defined as:
Current Assets – Current Liabilities In this example, Working Capital is:
$279,500 – $68,000 = $211,500 as of March 31st, and $307,125 – $60,000 = $247,125
at year end
This is the bulk of the $300,000 the owners borrowed & invested just to get the firm started.
Working Capital per Employee
In this example, Working Capital per Employee at year end is:
$247,125 / 10 = $24,713
This is actually a bit below industry average, but may be because the firm is still in start-up mode, having collected monies in only 10 of the year’s 12 months.
Working Capital of less than these amounts may indicate that the firm is under-capitalized, and, in stressful times, may indicate that the firm could become short of cash,
and/or may be over-extending its bank line of credit, or over-relying on loans.
Working Capital Ratio
The Working Capital Ratio is defined as: Current Assets / Current Liabilities
It is again another measure of a firm’s liquidity, and an indicator of a firm’s ability to pay its day-to-day obligations on an ongoing basis. Ratios above 2.0 are generally average for the industry. However, actual Working Capital or Working Capital per Employee may be better indicators of financial liquidity because the Working Capital Ratio still can mask actual Cash shortages.
Fixed Assets per Employee
Similarly, Fixed Assets per Employee is about $8,000 to $12,000. What is this for? Each employee requires space, a desk, a computer and related software, at a minimum. Further, these Working Capital per Employee and Fixed Assets per Employee amounts are indicative of the additional capital an owner must invest each time the firm hires an additional person. However, note that the Fixed Assets per Employee amount may not go down if an employee is laid off because Fixed Assets are a long-term investment.
Total Liabilities to Equity
This is a measure of leverage between the amount of money borrowed to finance the firm, and for which the owner(s) is usually personally liable and owner(s)’ equity. In this example, the ratio is:
$263,100 / $111,400 = 2.36 after the 1st Quarter, and is even lower at:
$240,850 / $146,275 = 1.65
by year end. This may be acceptable for a start-up firm, but most firms will try to keep this ratio below 1.0.
Pre-Tax Return on Invested Capital
This KPI measures the potential return of an investment of any type in a firm. In this firm’s first year, its return was:
$77,125 / $296,275 = 26%
which is rather high for a firm, especially a start-up firm. However, it must be recognized that the ‘return’ must remain in the firm, at least this year; the firm does not have the cash (only $35,458 at year end) to pay out as the firm’s monies are still primarily in A/R ($260,000).
SUMMARY
While most firm managers do pay attention to the P&L each month, the Balance Sheet also must be regularly monitored, not just for A/R, but also for the long-term health and credit worthiness of the firm. If anything, the Balance Sheet shows the extent to which owners &
shareholders have financial risk, sometimes far in excess of what appears on a P&L in a down year.
Industry averages demonstrate that an architecture firm can produce a respectable pretax return on investment, but it is a long-term return both because of the normal ups and downs of the market, and especially because of the long A/R cycles to which the A/E and professional services businesses are normally prone.
ABOUT OUR CONTRIBUTOR
Mike Webber started A/E Finance (www.aefinance.net) after years as a CFO. He works with A/E Principals and Boards on operations & financial analysis & systems, strategic planning, turnarounds, and interim assignments. He has been Chair of AIA Chicago's Practice Management Committee, an AIA/ACEC Peer Reviewer, and on ACEC's Management Practices Committee. He can be reached at [email protected].
RESOURCES
More Best Practices
The following AIA Best Practices provide additional information related to this topic:
07.02.01 Accounting Basics: The Income Statement & Key Performance Indicators
07.02.03 Accounts Receivable Management 07.04.01 Developing Budgets & Financial Forecasts
For More Information on This Topic
See also the 14th edition of the
Handbook, which can be ordered from the AIA Store by calling 800-242-3837 (option 4) or by email at
See also “Financial Management Overview” beginning on page 409 of the 15th Edition of the Architect’s
Handbook of Professional Practice. The Handbook can be ordered from the AIA Store online at
www.aia.org/store, by calling 800-242-3837 (option 4), or by email at
Feedback
The AIA welcomes member feedback on Best Practice articles. To provide feedback on this article, please contact
Key Terms Practice Financial management Accounting Financial operations Balance sheet
Key performance indicators
Book value
Current assets
Current liabilities
Days accounts receivable
Equity Fixed assets Invested capital Long-term liabilities Working capital August 2014