MEASUREMENT SCIENCE REVIEW, Volume 10, No. 3, 2010
10.2478/v10048-010-0018-2
Determination of Load Angle for Salient-pole
Synchronous Machine
D. Sumina
1, A. Šala
2, R. Malari
ć
3Faculty of electrical engineering and computing, University of Zagreb, Unska 3, 10000, Zagreb, Croatia
1 [email protected], 2 [email protected], 3 [email protected]
This paper presents two methods for load angle determination for salient-pole synchronous generator. The first method uses optical encoder to detect the rotor position. In some cases the end of the rotor shaft is not free to be used and mounting of an encoder is impossible. Therefore, the second method proposes estimation of the load angle based on the measured electrical values that have been already used in excitation control system of the synchronous generator. Estimation method uses corresponding voltage-current vector diagram and parameters of the synchronous generator, transformer and transmission lines. Both methods were experimentally verified on the digital control system and synchronous generator connected to power system. The estimation and measured results were compared. The accuracy of load angle estimation method depends on voltage and current measurement accuracy as well as generator, transformer and transmission line parameter accuracy. The estimation method gives satisfactory accuracy for load angles less than 120º el. Thus, it can be applied in excitation control system to provide stable work of synchronous generator in under-excitation operating area.
Keywords: Load angle measurement, load angle estimation, synchronous generator
1.INTRODUCTION
SY sy co
NCHRONOUS GENERATOR connected to a power stem needs to remain synchronized in operating nditions even in the case of extreme situations. The exceeding of allowed loading would cause the activation of the generator protection and disconnection of the synchronous generator from the power system. Automatic voltage regulators of synchronous generators have the excitation current limitations dictated by P-Q diagram (Fig.1). This enables optimal utilization of generator loading and safer work of a generator operating in parallel with the power system [1], [2]. If the generator excitation becomes too weak for a particular active power, the magnetic flux in the rotor will not develop the required torque to maintain the generator in synchronism, and the rotor will start to pole slip. Under-excitation (capacitive) operating mode of a synchronous generator appears in systems with under-loaded long power transmission lines, by connecting long power transmission lines to voltage and by asynchronous work of regulating transformer regulators.
The load angle is the angular displacement of the generator's rotor from the no-load position referred to as terminal voltage. Load angle provides information about the generator operating point position in relation to the stability limit. The load angle increases with increasing load and under-excitation. Power system is characterized by significant changes in synchronous generator performance, so that the transition from one to another steady operating condition is often accompanied by significant changes in the dynamic load angle. This results in changes of the load angle, in a relatively short period of time, from the maximum to the minimum value. The load angle value is important information especially in the case when generator operates in under-excitation state, because the load angle then assumes the maximum allowed value in relation to the stability limit of synchronous generator operation. The load
angle can be used as a measure of how close the generator is to pole slipping and can be also used to limit the excitation current during its operation in capacitive mode [3]-[6]. The application can be also possible in the implementation of the power system stabilizer, where change of the load angle can be used as a stabilizer input signal [7].
The load angle of a synchronous generator is the essential variable for the transient stability studies of power systems [1]. In recent years, an application of the load angle as an input variable in the excitation control and protection systems of synchronous generators and power systems has been investigated [8], [9], [10]. Therefore, real-time measurement of the load angle is required for these applications.
Fig.1. Limitations in the P-Q diagram of the synchronous generator
For the measurement of the load angle, the main problem is the rotor position detection. The load angle measurement system described in [11] uses an optical encoder to detect the rotor position. The load angle was determined by a procedure based on measured terminal voltage and rotor
MEASUREMENT SCIENCE REVIEW, Volume 10, No. 3, 2010
position signals. The load angle measurement for detecting the rotor position based on a photoelectric sensor mounted on the stator is proposed in [12]. Air gap sensor for detection of rotor position was proposed in [13]. Disadvantage of these two methods is the mounting of encoder or sensor on the generator. Several other papers have described the procedures for indirect determination of load angle [14]-[17]. Indirect determination is based on available measured values.
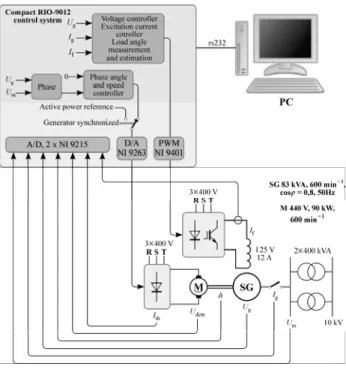
This paper presents a load angle measurement using the optical encoder. It also presents the load angle estimation method for synchronous generator connected over the transformer and transmission line to the power system (Fig.2). The proposed estimation method uses the available measured values that have already been introduced for the purpose of the control system excitation. This method has been implemented in the digital control system and requires knowledge of generator and the equivalent network parameters.
Fig.2. Synchronous generator connected to power system
2.LOAD ANGLE DETERMINATION
A. Load angle measurement
The load angle was measured using optical encoder and the digital control system. The load angle was measured at the exact moment of the network’s phase voltage passing through zero, which means that for the power system’s frequency of 50 Hz the sampling frequency is 100 Hz. The angle is measured based on the difference between the momentary position of the rotor and the network phase voltage.
Fig.3. Load angle measurement principle
Fig.3 shows the principle of operation for measuring the load angle. From the optical encoder, two pulse trains are connected to the digital control system. The first pulse train
(channel A) has a frequency of 5000 pulses per revolution and the second pulse train (null mark) has a frequency of 1 pulse per revolution.
After the generator is synchronized on the power system with no load and with synchronous speed, calibration procedure is performed. Digital control system detects the time difference between the occurrence of the null mark pulse and the occurrence of the next positive zero crossing of the power system voltage. This time difference is the offset or calibration time, shown as Tcal in Fig.3. As the
synchronous generator is loaded, the rotor position pulse advances with respect to the zero crossing of the power system voltage. Thus, the time difference between the occurrence of the null mark pulse and the occurrence of the next positive zero crossing of the power system voltage changes to T in Fig. 3. In this way, the current load angle is given as the time difference:
Tδ =T−Tcal
(1)
The load angle is determined by the following expression:
360 v T T δ δ = ⋅ °
(2)
where Tv is the time period of the power system voltage.
If the time is expressed as the number of pulses, then the load angle is determined by:
0 0 1 360 360 1 v v N N f N N f δ δ δ ⋅ = ⋅ ° = ⋅ ⋅ °
The load angle is obtained from the diagram in Fig.4:
(3)
where Nδ is the number of pulses between the occurrence of
the null mark pulse and the occurrence of the next positive zero crossing of the power system voltage, and Nv is the
number of pulses in one power system voltage time period. The resolution of load angle measurement is in this case 0.36° el.
B. Load angle estimation based on the quadrature-axis
synchronous reactance and the equivalent reactance of the transformer and transmission line
For the load angle estimation voltage-current vector diagram is used (Fig.4.), where δ1 is the angle between
induced voltage E0 and generator voltage U, δ is the load
angle between induced voltage E0 and AC network voltage
Um, I is the armature current, R is the equivalent resistance
of stator, transformer and transmission line, Xe is the
equivalent reactance of the transformer and transmission line and Xq and Xd are synchronous generator reactances.
In [17] the estimation method is proposed based only on the quadrature-axis synchronous reactance Xq and equivalent
resistance R, whereas the method proposed in this paper includes, in addition, the equivalent reactance of the transformer and transmission line Xe.
MEASUREMENT SCIENCE REVIEW, Volume 10, No. 3, 2010 Q I X Q I X P R I S U P I X Q R I P X I arctg δ ⋅ ⋅ + ⋅ ⋅ + ⋅ ⋅ + ⋅ ⋅ ⋅ + ⋅ ⋅ − ⋅ ⋅ = e q m e q (4)
here δ is the load angle, I is the armature current, P is the w
active power, Um is the power system voltage, Q is the
reactive power and S is the apparent power. The values of the quadrature-axis synchronous reactance Xq, equivalent
resistance R and reactance Xe must be known for this
estimation method. Measurement of the quadrature-axis synchronous reactance Xq is presented in the next
subsection. Reactance Xe is calculated and in p.u. system is
equal to 0.1 p.u. and equivalent resistance is equal to 0.01 p.u. In section III it was determined that estimation method in dynamic operations is not significantly dependent on the change of reactance Xe.
Fig.4 Vector diagram of the synchronous generator connected to
. Measurement of the quadrature-axis synchronous
the characteristic values of a synchronous m
AC network C
reactance
Usually,
achine are obtained from a short-circuit test at no load generator operation. This test implies risks and it cannot be performed every time, so the DC decay test is an alternative method. It determines the characteristic values of a synchronous machine for two axes in function of the saturation state of the leakage paths. In general, the DC decay test is done for positions of the rotor in d- and q- axis [18].
Fig.5. Experimental setup for DC decay test
The standstill DC decay test consists in cutting off the c
rform the test, the synchronous generator m
, the switch Sa is closed and the stator windings are
e
cedure starts from a mathematical m
onstant DC supply, allowing the current from the coils to reach zero and keeping the rotor in a fix position. The dc flux decay needs a dc source connected to two machine stator phases and the field winding in short-circuit as it is shown in Fig.5.
In order to pe
ust be at standstill and positioned either on the d- or q- axis. Voltages and currents are measured with Hall-effect sensors.
Initially
xcited with a constant DC current, which will set up a magnetic flux density along the machine. A small DC excitation current is usually applied; hence, the machine is in the unsaturated condition. Once the stator excitation current is at steady state, the switch Sb is closed to
short-circuit the generator stator terminals. The machine voltage and winding currents are acquired at a rate of 5 kHz throughout the transient. The decrement of the stator current during short-circuit is used to determine reactances, time constants and fundamental parameters of the synchronous generator. Derived parameters can be readily obtained. The test duration is considered to be finished when the stator current has reached its steady state on the d- and q- axis; in case of testing the direct axis, the field current must also be at steady state. It is important to employ the field current in the estimation process because the model will be able to predict the field winding dynamic behavior with high accuracy. The limiting resistor R will limit the current applied to the machine windings. The value of the resistance must guarantee a negligible current variation before and after the test because the DC source is always connected. The internal resistance of switch Sb must have a much lower
value than the stator winding resistance; with this consideration, the decrement in the winding currents is not affected. In addition, it is recommended that the current sensor has a low internal resistance when compared to the winding resistance.
The identification pro
odel, which consists of the machine voltage equations for the d- and q-axis. The d- and q- axis current time-variation is considered as being given by a sum of exponential functions, which means, in a per-unit (p.u.):
1 2 0 ( ) dt dt dt d d d d d i t 3 A e B e C e i α α = ⋅ + ⋅ + ⋅ α (5)
1 2 0 ( ) qt qt q q q q i t A e B e i β β = ⋅ + ⋅ (6)
here the coefficients A, B, C, α and β are functions of he G
w
time-constants and reactances for each of the axes [18]. The developed identification program is based on t auss-Newton curve fitting algorithm (Fig.6) [19]. Starting from the expressions of the currents, the identification is applied on parts of the curves. Estimated data are used as initial values.
MEASUREMENT SCIENCE REVIEW, Volume 10, No. 3, 2010
Fig.6. Structure of identification procedure
dentification method gives following results: Xd=0.8
p.
3. EXPERIMENTAL VERIFICATION OF LOAD ANGLE
Digital control cRIO-9012 [13]
w The i
u and Xq=0.59 p.u.
DETERMINATION METHODS
system (Fig.7) based on NI
as used for excitation control of synchronous generator, as well as to implement the load angle determination methods. The cRIO-9012 controller operates the National Instruments LabVIEW Real-Time Module, while the connectivity to sensors and actuators was obtained with four I/O modules, two NI-9215 (16-bit analog input, 100KS/s), NI-9401 (digital I/O, 100 ns) and NI-9263 (16-bit analog output, 100KS/s) [20]. NI LabVIEW graphical programming tools can be used for easier modeling of control algorithms. For testing purposes a software monitoring tool was also developed. It enables regulator parameters optimization as well as displaying and recording of the testing results via PC. Experimental setup is presented in Fig.8.
Fig. 8 Experimental setup
A. Static comparison of the measured and estimated load
angle
The static comparison of the measured and estimated load angle was performed by three appropriate experiments. Active power was changed from 0 p.u. to 1.0 p.u. with the step change of 0.2 p.u. In the first experiment (Fig.9), reactive power of the generator is zero.
0,0 0,2 0,4 0,6 0,8 1,0 0 5 10 15 20 25 30
Active power / p.u.
L oad angl e / °e l Measured value Estimated value Difference 0 1 2 3 4 D iff er en ce / ° el
Fig.9. Measured and estimated load angle, and estimation error with reactive power of 0 p.u. during active power change from 0 p.u. to 1.0 p.u.
In the second experiment (Fig.10) the reactive power is inductive (1.0 p.u.) and is kept constant during the whole range of active power change. In the third experiment (Fig.11) reactive power is capacitive and is kept constant (1.0 p.u.). In the whole range of active power change, the difference between estimated and measured load angle is less than 4º el.
MEASUREMENT SCIENCE REVIEW, Volume 10, No. 3, 2010 0,0 0,2 0,4 0,6 0,8 1,0 0 5 10 15 20
Active power / p.u.
Diff er en ce / °e l Load angle / ° el Measured value Estimated value Difference -1 0 1 2 3 4 5
Fig.10. Measured and estimated load angle, and estimation error with inductive reactive power of 1.0 p.u. during active power change from 0 p.u. to 1.0 p.u.
0,0 0,2 0,4 0,6 0,8 1,0 0 10 20 30 40 50
Active power / p.u.
Measured value Estimated value Difference -3 -2 -1 0 1 2 L oad an gl e / °e l Diffe re nc e / °e l
Fig.11. Measured and estimated load angle and estimation error with capacitive reactive power of 1.0 p.u. during active power change from 0 p.u. to 1.0 p.u.
B. Dynamic comparison of the measured and estimated
load angle
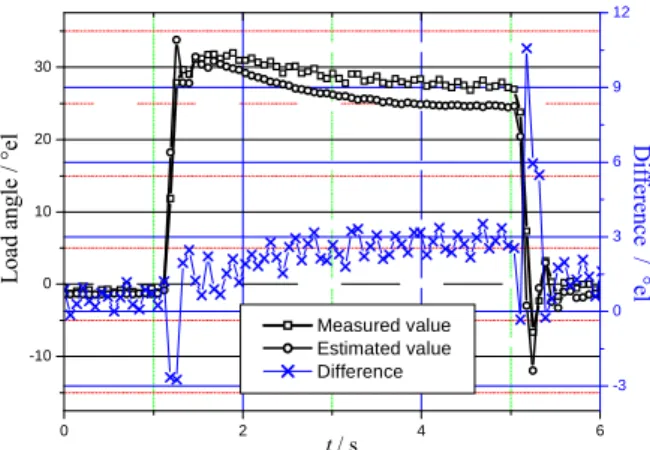
The estimated and measured results were also compared with three different experiments. In these experiments there was active power step change (at the moment of t ≈ 1s) from 0 p.u. to 1.0 p.u. and again to 0 p.u. after four seconds. In all experiments the reactive power was kept constant using the reactive power controller. In the first experiment (Fig.12) the reactive power was set to 0 p.u. In the second experiment the generator was in inductive operating mode and reactive power was set to 1.0 p.u. (Fig.13). In the third experiment (Fig.14) the generator was in capacitive operating mode and has lost the synchronism.
Measured and estimated results demonstrate good matching except near the moment when the generator loses synchronism. In that moment the voltage-current vector diagram used as a base in the presented estimation method is not valid. For algorithms that need to keep the generator in stable operating mode, operating range with load angles less than 90º el. is relevant. So, if excitation control algorithm ensures stable operating mode of a generator, load angle will never exceed 90º el.
0 2 4 6 -10 0 10 20 30 L oad a ng le / ° el D iffe re nc e / °e l t / s -3 0 3 6 9 12 Measured value Estimated value Difference
Fig.12. Measured and estimated load angle for active power step change and reactive power of 0 p.u.
0 2 4 6 -5 0 5 10 15 20 25 Measured value Estimated value Difference t / s D iffe re nc e / ° el Load a ngle / °el -3 0 3 6
Fig.13. Measured and estimated load angle for active power step change and inductive reactive power of 1.0 p.u.
0 2 4 6 -150 -100 -50 0 50 100 150 200 Load angle / °e l Dif fe rence / °el t / s Measured value Estimated value Difference -200 -150 -100 -50 0 50 100 150 200
Fig 14. Measured and estimated load angle for active power step change and capacitive reactive power of 1.0 p.u.
C. Sensitivity of estimation method due to error of
estimator parameters
Parameters needed for the load angle estimation are quadrature-axis synchronous reactance Xq, equivalent
resistance R and reactance Xe. An estimation method
dependence of parameters determining accuracy is analyzed in capacitive operating mode with constant reactive power (1 p.u.). There is active power step change (at the moment
MEASUREMENT SCIENCE REVIEW, Volume 10, No. 3, 2010
seconds. Stator resistance R, quadrature-axis reactance Xq
and equivalent reactance Xe in estimator are changed from
50 % to 150 % of nominal value with step of 50 %. In the first set of experiments, value of stator resistance in estimator is changed (Fig.15). Two different validation criterions are used to determine sensitivity of estimation method to parameter change. The first criterion is the mean absolute error (MAE) between the measured and estimated load angle. Second criterion is static error (STAT). This error is defined as the absolute error between the measured and estimated load angle 3 seconds after step change of active power. MAE and STAT criterions for stator resistance change are shown in Fig.16. In the second experiment, value of reactance Xq in estimator is changed
(Fig.17). MAE and STAT criterions for this set of experiments are shown in Fig.18. In the third experiment, value of reactance Xe in estimator is changed (Fig.19). MAE
and STAT criterions for this set of experiments are shown in Fig.20. 0 1 2 3 4 5 6 -20 -10 0 10 20 30 40 50 60 70 Lo ad a ng le / °el t/ s R(estimator) = 0,5 Rn Measured value Estimated value 0 1 2 3 4 5 6 -10 0 10 20 30 40 50 60 70 Lo ad an gl e / °el t/ s R(estimator) = Rn Measured value Estimated value 0 1 2 3 4 5 -10 0 10 20 30 40 50 60 70 6 R(estimator) = 1.5 Rn Measured value Estimated value Lo ad an gl e / °el t/ s
Fig.15. The measured and estimated load angle with different
stator resistance R in load angle estimator
0,4 0,6 0,8 1,0 1,2 1,4 1,6 2 4 6 8 10 12 D if fer e n c e / °el R / Rn MAE STAT
Fig.16. MAE and STAT criterions due to different stator
resistance R in estimator 0 1 2 3 4 5 6 -10 0 10 20 30 40 50 60 Xq(estimator) = 0,5 Xqn Measured value Estimated value L oad an gl e / °el t / s 0 1 2 3 4 5 6 -10 0 10 20 30 40 50 60 t / s L oad a ng le / °el Xq(estimator) = Xqn Measured value Estimated value 0 1 2 3 4 5 6 -40 -20 0 20 40 60 80 t / s L oa d an gl e / ° el Xq(estimator) = 1.5 Xqn Measured value Estimated value
Fig.17. The measured and estimated load angle with different
MEASUREMENT SCIENCE REVIEW, Volume 10, No. 3, 2010 0,4 0,6 0,8 1,0 1,2 1,4 1,6 0 5 10 15 20 25 30 D if fe renc e / ° e l Xq / Xqn MAE STAT
Fig.18. MAE and STAT criterions due to different quadrature-axis
reactance Xq in estimator 0 1 2 3 4 5 6 -10 0 10 20 30 40 50 60 t / s L oa d an gl e / ° el Xe(estimator) = 0,5 Xen Measured value Estimated value 0 1 2 3 4 5 -10 0 10 20 30 40 50 60 70 6 Xe(estimator) = Xen Measured value Estimated value L oad an gl e / °e l t / s 0 1 2 3 4 5 -20 -10 0 10 20 30 40 50 60 70 6 L oad an gl e / °el t / s Xe(estimator) = 1,5 Xen Measured value Estimated value
Fig.19. The measured and estimated load angle with different
equivalent reactance Xe in load angle estimator
0,4 0,6 0,8 1,0 1,2 1,4 1,6 2 4 6 8 10 12 D if fe renc e / °e l Xe / Xen MAE STAT
Fig.20. MAE and STAT error of load angle estimation due to
different equivalent reactance Xe in estimator
The results of sensitivity analysis show that static accuracy of the presented estimation method is practically independent of errors in determining stator resistance. The average absolute dynamic error is less than 1 % in conditions of stator resistance change. So the determining accuracy of stator resistance value does not have great influence on the accuracy of the presented load angle estimation method.
However, errors in determining the reactances Xq and Xe
have influence on the static accuracy of the presented estimation method. The average dynamic absolute error significantly depends on quadrature-axis reactance Xq
change.
4. CONCLUSIONS
This paper presents and compares methods for the load angle determination for salient-pole synchronous generator. First method presents measurement using an optical encoder to detect rotor position. The load angle is measured against the power system voltage. Second method presents the load angle estimation method based on the measured values (voltages and currents) of synchronous generator. An accuracy of the presented load angle estimation method depends on voltage and current measurement accuracy as well as on parameters determining accuracy (quadrature-axis reactance Xq, equivalent resistance R and reactance Xe).
In static conditions the difference between estimated and measured load angle is less than 4º el. and in dynamic conditions measured and estimated results demonstrate good matching for load angles less than 90º el.
It was also concluded that errors in generator parameter determination have influence on the static accuracy of the presented estimation method. The average dynamic absolute error significantly depends on generator quadrature-axis reactance change.
Excitation control system with additional signal and estimated load angle can improve the stability of a synchronous generator in capacitive operating mode. Future research will be based on development of excitation control algorithms based on the estimated load angle of a synchronous generator.
MEASUREMENT SCIENCE REVIEW, Volume 10, No. 3, 2010
APPENDIX A
The synchronous generator's rated parameters are:
Voltage 400 V Current 120 A Power 83 kVA Frequency 50 Hz Speed 600 min-1 Power factor 0.8 Excitation voltage 100 V Excitation current 11.8 A
[10] Redfern, M.A., Checksfield, M.J. (1995). A new pole slipping protection algorithm for dispersed storage and generation using the equal area criterion. IEEE Trans.
on Power Delivery, 10, 194-202.
[11] Barrera-Cardiel, E., Pastor-Gomez, N. (1999). Microcontroller-based power-angle instrument for a power systems laboratory. In Proceedings of the IEEE
Power Engineering Society: Summer Meeting. IEEE,
1008-1012.
[12] Chen, Y., Zhang, C., Hu, Z., Wang, X. (2000). A new
approach to real time measurement of power angles of generators at different locations for stability control. In
Proceedings of the IEEE Power Engineering Society:
Winter Meeting. Vol. 2, IEEE, 1237-1242.
[13] Despalatović, M., Jadrić, M., Terzić, B. (2008).
Real-time power angle determination of salient-pole synchronous machine based on air gap measurements.
Electric Power System Research, 78 (11), 1873-1880.
REFERENCES
[1] Kundur, P. (1993). Power System Stability and
Control. Power System Engineering Series.
McGraw-Hill. [14] Cari, E.P.T., Alberto, L.F.C., Bretas, N.G. (2000). A
novel methodology for power angle estimation of synchronous generator based on trajectory sensitivity analysis. In Proceedings of the IEEE Power
Engineering Society: Winter Meeting. Vol. 2, IEEE,
1237-1242.
[2] Anderson, P.M., Fouad, A.A. (1994). Power System
Control and Stability. IEEE Power System
Engineering Series. IEEE Press.
[3] Girgis, G.K., Vu, H.D. (1995). Verification of limiter
performance in modern excitation control systems.
IEEE Trans. on Energy Conversion, 10 (3), 538-542.
[4] Eberly, T.W., Schaefer, R.C. (1995).
Minimum/maximum excitation limiter performance goals for small generation. IEEE Trans. on Energy
Conversion, 10 (4), 714-721.
[15] Del Angel, A., Geurts, P., Ernst, D., Glavic, M., Wehenkel, L. (2007). Estimation of rotor angles of synchronous machines using artificial neural networks and local PMU-based quantities. Neurocomputing, 70 (16-18), 2668-2678.
[5] Ramos, A.J.P., Lins, L.R., Fittipaldi, E.H.D.,
Monteath, L. (1997). Performance of under excitation limiter of synchronous machines for system critical disturbances. IEEE Trans. on Power Systems, 12 (4), 1702-1707.
[16] Ghahremani, E., Karrari, M., Malik, O.P. (2008).
Synchronous generator third-order model parameter estimation using online experimental data. IET
Generation, Transmission & Distribution, 2 (5),
708-719.
[6] Working group of the excitation systems
subcommittee. (1995). Underexcitation limiter models for power system stability studies. IEEE Trans. on
Energy Conversion, 10 (3), 524-531.
[17] Idzotic, T., Erceg, G., Sumina, D. (2004). Load angle
estimation of a synchronous generator. In IEEE
Mediterranean Electrotechnical Conference. Vol. 3,
IEEE, 893-896.
[7] Sumina, D., Bulić, N., Erceg, I. (2010).
Three-dimensional power system stabilizer. Electric Power
Systems Research, 80 (7), 886-892.
[18] Vicol, L., Tu Xuan, M., Wetter, R., Simond, J.-J.,
Viorel, I.A. (2006). On the identification of the synchronous machine parameters using standstill DC decay test. In ICEM 2006: International Conference
on Electrical Machines.
[8] Chapman, J.W., Ilic, M.D. King, C.A. (1993).
Stabilizing a multimachine power system via decentralized feedback linearizing excitation control.
IEEE Trans. on Power Systems, 8 (3), 830-839. [19] MalariNewton curve fitting. ć, K., Malarić, R., Hegeduš, H. (2008). Gauss
http://sourceforge.net/projects/gauss-newton/
[9] Lu, Q., Sun, Y., Xu, Z., Mochizuki, T. (1996).
Decentralized nonlinear optimal excitation control.
IEEE Trans. on Power Systems, 11 (4), 1957-1962. [20] National Instruments: CompactRIO. http://www.ni.com/compactrio/about.htm
Received January 26, 2010. Accepted June 7, 2010.