CLUTTER MODELING AND ANALYSIS BASED ON ZMNL
METHOD
BIN WANG, JINKUAN WANG, DONG WANG, JIE ZHANG
Engineering Optimization and Smart Antenna Institute, Northeastern University at Qinhuangdao,
Qinhuangdao 066004, Hebei, China
ABSTRACT
With the development of space technology and continuous exploration of outer space, more extensive use of electromagnetic spectrum and high speed of target will make electromagnetic environment become more and more complex. So the influence of clutter can not be ignored. How to model and analyze clutter is very important in the research field of radar. In this paper, we research on the principle of ZMNL (Zero Memory Nonlinearity) method and the basic way of clutter modeling. Then based on the characteristics of Rayleigh distribution, we use ZMNL method to generate Rayleigh distribution clutter. Simulation results show that the generated clutter approaches the theoretical value and the method is effective. Finally, the whole paper is summarized.
Keywords: Clutter Modeling, Clutter Analysis, ZMNL, Rayleigh Distribution
1. INTRODUCTION
The word radar is an abbreviation for radio detection and ranging, which seems to have achieved universal acceptance all over the world. The invention of radar is inspired by the echolocation animals, such as bats and dolphins. The radar’s basic function is intimately related to properties and characteristics of electromagnetic waves as they interface with physical objects. With the improvement of modern technology, radar develops rapidly with various needs of people. All early radars use radio waves, but some modern radars today are based on optical waves and the use of lasers. Development of radar technology was
accelerated during World War Ⅱ. Since that time
development has continued such that present-day systems are very sophisticated and advanced. More and more modern radar are proposed, for example, cognitive radar[1], MIMO radar[2], etc.
With the development of space technology and continuous exploration of outer space, more extensive use of electromagnetic spectrum and high speed of target will make electromagnetic environment become more and more complex. The influence of clutter can not be ignored. Clutter from ground and sea makes an influence on radar performance. Modeling clutter accurately can improve radar detection performance and provide a realistic simulation environment of radar clutter. So it is becoming a hot topic in the research and engineering field.
interval between spikes. In [11], the authors analyze three sets of high-resolution, coherent, and polarimetric radar sea clutter data and compare with radar sea clutter models.
In this paper, we first research on the principle of ZMNL method and the basic way of clutter modeling with it. After analyzing the characteristics of Rayleigh distribution, we use ZMNL method to generate Rayleigh distribution clutter. Finally, we compare the generated clutter with the theoretical value in simulations.
2. FUNDAMENTALPRINCIPLEOFZMNL
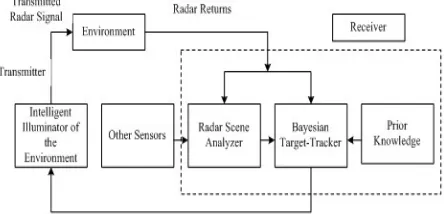
[image:2.612.85.307.409.516.2]We consider a modern radar system. Figure 1 is block diagram of cognitive radar. Different from traditional radar, cognitive radar is constructed using three parts: intelligent signal processing, information feedback loop, and soft information processing. In cognitive radar system, the radar continuously learns about the environment through experience gained from interactions of the receiver with the environment, the transmitter adjusts its illumination of the environment in an intelligent manner and the whole radar system constitutes a closed-loop dynamic system.
Figure 1: Block Diagram Of Cognitive Radar
In the diagram, we can see that radar scene analyzer is an important part in cognitive radar, the basis of which is clutter modeling and analysis. The function of the radar-scene analyzer is to provide information on the environment to the receiver, which is very important to the decisions made by the receiver on possible targets of interest. This function builds on two sources of information-bearing signals. Radar returns, which are produced by the environment in response to the radar’s own transmitted signal. Other relevant information on the environment (e.g., temperature, sea-state, pressure, humidity), which is gathered on the fly by sensors other than the radar itself. These two sources of inputs constitute the stimuli for the
outside-in part of radar cognition. So it is very necessary to model and analyze clutter accurately.
The simulation of clutter data should not only meet a certain probability distribution in amplitude, but should also meet the requirements in correlation properties. That is to say, the first-order and second-order characteristics of the data have to be produced to meet the requirements of the clutter. In addition, sometimes it is required to produce coherent and incoherent signals, so that there is also a coherent related sequence and incoherent related sequence division in corresponding clutter signal in system simulation.
There are three methods in radar clutter simulation. The first one is Monte-Carlo simulation. If we want to simulate single point statistics (first-order characteristics), there are many methods which are also quite mature. According to statistical model provided by the theoretical and actual data, the method of producing relevant random sequence which has a certain probability are under investigation, among which are three relatively representative related radar clutter simulation methods at present: the method of spherically invariant random process (SIRP), the method of zero memory nonlinearity transformation method (ZMNL) and the method of stochastic differential equation (SDE). By contrast, ZMNL and SIPR two methods are relatively mature, and the application is more widespread. This paper mainly uses ZMNL method.
ZMNL can realize the simulation of several common distribution clutters, and the application of it is restricted to some factors, for example, the shape of power spectrum. ZMNL is the most commonly used method in the simulation of related radar, as it realizes easily and has a fast simulation rate after the generation of related Gaussian sequences.
The second one is according to the physical model of electromagnetic scattering theory, take computer numerical simulation considering several kinds of environment and radar working conditions. The third one is clutter simulation methods employed in radar function simulation based on radar equation, contrary to specific radar environment and parameters.
Usually the difference is very small, because the given related function attenuates quickly or before and after nonlinear transformation, the relation of input/output correlation function is close to linear. Some people also pointed out that we should keep the balance between correlation and PDF.
The basic method of ZMNL is to transfer the relevant Gaussian random sequence process to the required relevant random process by a sort of nonlinear transformation. After selected nonlinear transformation form through the relationship of clutter distribution function, the relevant characteristics of Gaussian process before the transformation can not be optionally designated, we should find out the transformation relationship between the correlation function before and after the transformation according to the concrete transformation method. Then we can derive correlation function of Gaussian process before the transformation by the given non-Gaussian process related function, which is the key to this method.
The concrete block diagram of the clutter modeling with ZMNL method is as follows:
Linear Filter H(z)
( )
w k y k( ) Nonlinear
Transformation
( )
[image:3.612.104.302.367.420.2]z k
Figure 2: Block Diagram Of The Clutter Modeling With ZMNL Method
As is shown in the figure 2, white Gaussian random process change into relevant (non-ferrous) Gaussian process after getting through the filter
( )
H z
, this process can obtain the required clutter sequencez k
( )
after the nonlinear transformation. No breaking generality, assuming thatw k
( )
is a unit power white Gaussian random process whose mean value is zero, and the coefficient of the filter( )
H z
is normalized, soz k
( )
should have unit variance.The premise of the application of this method is that we should get the nonlinear relationship between the input and output of correlation function in nonlinear transformation. But because the nonlinear transformation will make the spectrum broaden, making the autocorrelation function between
z k
( )
andy k
( )
has a very complex transformation relationship. So for some distribution model of the clutter simulation, it is not easy to get the autocorrelation function ofy k
( )
from the autocorrelation function of
z k
( )
, such asWeibull distribution clutter and K distribution clutter.
The basic way of clutter modeling with the method of ZMNL is as follows:
(1) Produce white Gaussian noise sequence
w k
( )
;(2) Make white Gaussian noise sequence
w k
( )
getthrough a linear filter
H z
( )
, so that we can getrelevant Gaussian sequence
y k
( )
;(3) After making nonlinear transformation in relevant Gaussian noise sequence
y k
( )
, we canget related sequence
z k
( )
with certain probability distribution.3. GENERATIONOFRAYLEIGH
CLUTTER
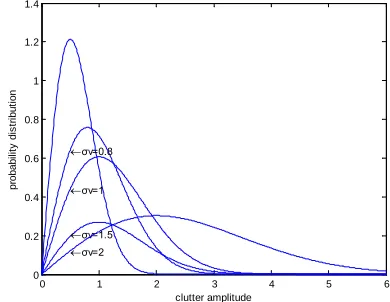
The probability density distribution function of Rayleigh distribution is
2
2
exp(
2)
0
2
v v
x
x
x
x
ρ( ) =
−
≥
σ
σ
(1)where
x
is clutter amplitude,σ
v is standard deviation of clutter. Curve of probability distribution of Rayleigh clutter is in figure 3.0 1 2 3 4 5 6
0 0.2 0.4 0.6 0.8 1 1.2 1.4
←σv=0.8
←σv=1
←σv=1.5 ←σv=2
clutter amplitude
pr
obabi
lit
y
di
s
tr
ibut
ion
Figure 3: Probability Distribution Of Rayleigh Clutter
The distribution function according to probability density distribution function is
2
1 exp[ (
) ]
R
v
x
F
= −
−
σ
(2)In order to well describe the relationship of parameter
σ
v and environment, letσ = σ/λ
v 0 into formula (1), we can get2 2 2
2
exp[
2],
0
2
x
x
x
λ
0λ
0x
ρ( ) =
−
>
[image:3.612.335.530.427.578.2]where
λ
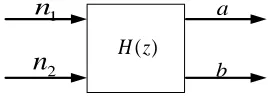
0 is radar working wavelength. So parameter is independent with wavelength.Rayleigh distribution clutter generation is relatively simple. The principle diagram of generation of Rayleigh distribution clutter is as follows:
1
n
2
n
a
b
[image:4.612.131.266.210.258.2]( ) H z
Figure 4: Principle Diagram Of Generation Of Rayleigh Distribution Clutter
In figure 4,
n
1 andn
2 are subject toN
(0,
σ
2)
, which is an independent white Gaussian noise. After getting through linear filterH z
( )
, the power spectrum density of clutter’s two orthogonal components is2 2
|
(
jw) |
aa bb
P
=
P
= σ
H e
(4)Among them,
x
=
a
2+
b
2 obey the Rayleigh distribution.We can obtain Rayleigh distribution clutter after making amplitude transformation to Gaussian distribution clutter, so the key to produce Rayleigh distribution clutter lies in designing filter according to the noise power spectrum characteristic, which can make two non-related Gaussian sequences change into related Gaussian sequences. We will use the method of Fourier series expansion to design filter, making noise sequence have the characteristics of Gaussian spectrum.
The filter's transfer coefficient expression is
0
( )
Ni i i
H z
g z
−=
=
∑
(5)Frequency response is
2
0
(
)
N
jwT i fTj i i
H e
g e
− π=
=
∑
(6)And the Gaussian spectrum density of clutter is known as
2
2
( )
exp(
)
2
ff
S f
=
−
σ
(7)When the input for white noise
2
( ) |
( ) |
S f
=
H f
(8)Therefore the Gaussian response of designed filter is
2
2
|
( ) | exp(
)
4
ff
H f
=
−
σ
(9)Make expansion for Fourier series
0
1
|
( ) |
cos(2
)
2
N
n n
C
H f
C
π
fnT
=
=
+
∑
(10)Take absolute value of formula (6), according to the even function characteristic knowledge of frequency spectrum,
C
n in formula (9) is equal toi
a
in formula (6), which is the weighting coefficient of this filter, due to the frequency response is known, it is easy to determine the coefficient of Fourier series is2 2 2 2 0
0
2
f n Tn f
C
= σ
T
π
e
−4σπ (11)In this formula,
T
0 is sampling cycle, the relationship between the filter coefficientg
and the Fourier seriesC
is1
0
2
1
2
i
i
i
C
i
N
a
C
N
i
N
≤ ≤
=
≤ ≤ 2
(12)
Through the analysis above, the filter coefficient can be determined. The power spectrum of the sequence of random after getting through this filter has the characteristics of Gaussian spectrum. Then we will make Rayleigh distribution clutter simulation in a certain condition through the steps we have told above, and analyze the results of simulation.
The following are the situations whose amplitude obeys Rayleigh distribution.
(1) Ground clutter, sea clutter and weather clutter of low-resolution radar;
(2) Weather clutter, foil and sea clutter of high-resolution radar under big grazing angle; (3) Ground clutter in undeveloped terrain under
big grazing angle.
4. SIMULATIONS
In this section, we will compare the generated clutter with the theoretical value.
deviation of random sequence
s
v=
1.2
, the center frequencyf
0=
0
Hz
, wavelength0
0.08
l
=
. Simulation results are in figure 5 to figure 8.0 1000 2000 3000 4000 5000 6000 7000 8000 -8
[image:5.612.108.302.79.479.2]-6 -4 -2 0 2 4 6 8
Figure 5: Independent Non-Relevant Gaussian Random Sequence
0 1000 2000 3000 4000 5000 6000 7000 8000 0
1 2 3 4 5 6
Figure 6: Rayleigh Distribution Clutter
Figure 5 to figure 8 present the results of Rayleigh distribution clutter simulation with the method of ZMNL. Figure 5 is independent non-relevant Gaussian random sequence, and figure 6 is Rayleigh distribution clutter obtained in simulation. We can get the changes of sequences before and after the simulation comparing figure 5 with figure 6.
0 0.5 1 1.5 2 2.5 3 3.5 4 4.5 5 0
0.1 0.2 0.3 0.4 0.5 0.6 0.7
clutter amplitude
pr
obabi
lit
y dens
[image:5.612.333.520.147.304.2]ity
Figure 7: Distribution Of Clutter Amplitude
Figure 7 shows the comparison between actual amplitude distribution of clutter and the theoretical amplitude distribution of clutter. It can be seen that both are basically consistent with each other.
-10000 -800 -600 -400 -200 0 200 400 600 800 1000
0.1 0.2 0.3 0.4 0.5 0.6 0.7 0.8 0.9 1
frequency/Hz
pow
er
s
pec
tr
um
dens
it
y
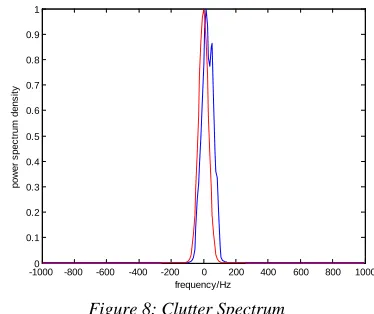
[image:5.612.123.299.169.304.2]Figure 8: Clutter Spectrum
Figure 8 adopts the method of Pburg to estimate the power spectrum of clutter that has been generated, and shows the comparison with theoretical Gaussian power distribution. It can be seen that both are consistent with each other. Spectrum broadening is small, and the error of high frequency part is smaller.
5. CONCLUSIONS
In this paper, take cognitive radar for example, we describe the importance of radar clutter modeling and analysis. After making a detailed analysis of ZMNL, we use it to generate Rayleigh distribution clutter. Simulation results show that actual amplitude distribution of clutter and the theoretical amplitude distribution of clutter are basically consistent with each other. Actual Gaussian power distribution and theoretical Gaussian power distribution are consistent with each other. Spectrum broadening is small, and the error of high frequency part is smaller. So we can conclude that the generated clutter approaches the theoretical value and our method is effective.
[image:5.612.125.298.333.466.2] [image:5.612.107.295.584.706.2]ACKNOWLEDGEMENTS
This work was supported by the National Natural Science Foundation of China, under Grant No.
60904035, 61004052 and 61104005. It was also supported by the Fundamental Research Funds for the Central Universities, under Grant No. N110323005.
REFRENCES:
[1] S. Haykin, “Cognitive radar: a way of the future”, IEEE Signal Processing Magazine, Vol. 23, No. 1, 2006, pp. 30-40.
[2] F. Daum, J. Huang, “MIMO radar: Snake oil or good idea? ” IEEE Aerospace and Electronic Systems Magazine, Vol. 24, No. 5, 2009, pp. 8-12.
[3] L. Teng, H. Dan, “Model for spatial-correlated clutter and its application to temporal-spatial correlated clutter”, IET Microwaves, Antennas & Propagation, Vol. 5, No. 3, 2011, pp. 298-304.
[4] L. P. Roy, R. V. Kumar, “Accurate K-distributed clutter model for scanning radar application”, IET Radar, Sonar & Navigation, Vol. 4, No. 2, 2010, pp. 158-167.
[5] R. Duan, X. G. Wang, “Space-time clutter model for airborne bistatic radar with non-Gaussian statistics”, Systems Engineering and Electronics journal, Vol. 20, No. 2, 2009, pp. 283-290.
[6] V. G. Hansen, R. Mital, “An improved empirical model for radar sea clutter reflectivity”, IEEE Aerospace and Electronic Systems, Vol. 48, No. 4, 2012, pp. 3512-3524. [7] J. A. Jackson, R. L. Moses, “A model for
generating synthetic VHF SAR forest clutter images”, IEEE Aerospace and Electronic Systems, Vol. 45, No. 3, 2009, pp. 1138-1152. [8] G. Hennessey, H. Leung, “Sea-clutter modeling using a radial-basis-function neural network”, IEEE Oceanic Engineering, Vol. 26, No. 3, 2001, pp. 358-372.
[9] A. Karimian, C. Yardim, “Multiple grazing angle sea clutter modeling”, IEEE Antennas and Propagation, Vol. 60, No. 9, 2012, pp. 4408-4417.
[10] M. Greco, P. Stinco, “Identification and analysis of sea radar clutter spikes”, IET Radar, Sonar & Navigation, Vol. 4, No. 2, 2010, pp. 239-250.