Issued September 2015
P60-253
By Jessica C. Smith and Carla Medalia
Health Insurance Coverage in the United States: 2014
Current Population Reports
Issued September 2015 P60-253
By Jessica C. Smith and Carla Medalia
Health Insurance in the United States: 2014
Current Population Reports
U.S. Department of Commerce Economics and Statistics Administration U.S. CENSUS BUREAU
#
%
Acknowledgments
Jessica Smith and Carla Medalia prepared this report under the direction of
Marina Vornovitsky, Chief of the Health and Disability Statistics Branch.
Jennifer Cheeseman Day, Assistant Division Chief for Employment
Characteristics, of the Social, Economic, and Housing Statistics Division, provided overall direction.
David E. Adams, Vonda M. Ashton, Susan S. Gajewski,and Richard Lee,
Demographic Surveys Division, and Tim J. Marshall and Lisa Cheok, Associate Directorate Demographic Programs, processed the Current Population Survey 2015 Annual Social and Economic Supplement file. Christopher J. Boniface,
Kirk E. Davis, Raymond Dowdy, Van P. Duong, Thy K. Le, and
Chandararith R. Phe programmed and produced the detailed and
publica-tion tables under the direcpublica-tion of Hung X. Pham, Chief of the Tabulation and Applications Branch.
Deborah M. Stempowski, current Chief of the American Community Survey
Office, and James B. Treat, former Chief of the American Community Survey Office, provided overall direction for the implementation of the 2014 American Community Survey. Jennifer W. Reichert, Judy G. Belton, Donna M. Daily,and
Dameka M. Reese of the American Community Survey Office oversaw the data
collection including content, group quarters, and mail and automated collection.
Kenneth B. Dawson, Gail M. Denby,and Arumugam Sutha of the Decennial
Information Technology Division directed the edit and processing tasks for the 2014 1-Year American Community Survey file.
Stephen Clark, under the supervision of David V. Hornick, both of the
Demographic Statistical Methods Division, conducted sample review of all Current Population Survey data.
B. Dale Garrett, under the supervision of Karen E. King, both of the Decennial
Statistical Studies Division, conducted the statistical review of all American Community Survey data.
Lisa Clement, Survey Director of the Current Population Survey, provided overall
direction for the survey implementation. Greg Weyland, Tim J. Marshall,
Lisa Cheok, and Aaron Cantu, Associate Directorate Demographic Programs, and
Roberto Picha, Agatha Jung, and Johanna Rupp, Technologies Management
Office, prepared and programmed the computer-assisted interviewing instrument used to conduct the Annual Social and Economic Supplement.
Additional people within the U.S. Census Bureau also made significant contributions to the preparation of this report. Joelle Abramowitz, Alfred Gottschalck,
Kelly Holder, Jeongsoo Kim, Brett O’Hara, Adam Smith, Amy Steinweg,
Sharon Stern, Danielle Taylor, Victoria Udalova, Susan Walsh,and
Monica Wiedemann reviewed the contents.
Census Bureau field representatives and telephone interviewers collected the data. Without their dedication, the preparation of this report or any report from the Current Population Survey would be impossible.
Linda Chen of the Census Bureau’s Center for New Media and Promotion and
Donna Gillis and Anthony Richards of the Public Information Office provided
publication management, graphics design and composition, and editorial review for print and electronic media. George E. Williams of the Census Bureau’s Administrative and Customer Services Division provided printing management.
U.S. Department of Commerce
Penny Pritzker,
Secretary
Bruce H. Andrews,
Deputy Secretary
Economics and Statistics AdministrationMark Doms, Under Secretary for Economic Affairs
U.S. CENSUS BUREAU John H. Thompson,
Director
P60-253
Health Insurance Coverage in
Suggested Citation
Smith, Jessica C. and Carla Medalia, U.S. Census Bureau, Current Population Reports, P60-253, Health Insurance Coverage in the United States: 2014, U.S. Government Printing Office, Washington, DC, 2015.Economics and Statistics Administration
Mark Doms,
Under Secretary for Economic Affairs
U.S. CENSUS BUREAU John H. Thompson, Director
Nancy A. Potok,
Deputy Director and Chief Operating Officer
Enrique Lamas,
Associate Director for Demographic Programs
Victoria Velkoff,
Chief, Social, Economic, and Housing Statistics Division
ECONOMICS AND STATISTICS ADMINISTRATION
U.S. Census Bureau Health Insurance Coverage in the United States: 2014 iii
Contents
TEXT
Introduction ... 1
National Changes in Health Insurance Coverage ... 1
What Is Health Insurance Coverage? ... 1
Two Measures of Health Insurance Coverage ... 2
Health Insurance Coverage and the Affordable Care Act ... 2
Highlights ... 3
Estimates of the Population Without Health Insurance Coverage ... 4
Multiple Coverage Types ... 6
Health Insurance Coverage by Selected Characteristics ... 6
Age ... 6
Marital Status ... 8
Disability Status ... 9
Work Experience ... 9
Educational Attainment ... 11
Household Income ... 11
Income-to-Poverty Ratios ... 13
Family Status ... 14
Residence ... 16
Race and Hispanic Origin... 16
Nativity ... 16
Children and Adults Without Health Insurance Coverage ... 17
State Estimates of Health Insurance Coverage ... 18
More Information About Health Insurance Coverage ... 21
Additional Data and Contacts ... 21
State and Local Estimates of Health Insurance Coverage ... 21
Health Insurance Coverage Dynamics ... 21
Comments ... 22
Sources of Estimates ... 22
2014 and 2015 CPS ASEC Estimates ... 22
Statistical Accuracy... 23
TEXT TABLES
Table 1. Coverage Rates by Type of Health Insurance: 2013 and 2014 ... 5Table 2. Percentage of People by Type of Health Insurance Coverage by Age: 2013 and 2014 ... 7
Table 3. Percentage of People by Type of Health Insurance Coverage for Working-Age Adults: 2013 and 2014 ... 10
Table 4. Percentage of People by Type of Health Insurance Coverage by Household Income and Income-to-Poverty Ratio: 2013 and 2014 ... 12
Table 5. Percentage of People by Type of Health Insurance Coverage by Selected Demographic Characteristics: 2013 and 2014 ... 15
FIGURES
Figure 1. Uninsured Rate: 2008 to 2014 ...3
Figure 2. Percentage of People by Type of Health Insurance Coverage and Change From Last Year: 2014 ...4
Figure 3. Percentage With One or Multiple Coverage Types: 2014 ...6
Figure 4. Uninsured Rate by Single Year of Age: 2013 and 2014 ...9
Figure 5. Uninsured Rate by Poverty Status and Medicaid Expansion of State for Adults Aged 19 to 64 Years: 2013 and 2014 ...14
Figure 6. Children Under 19 Years of Age and Adults Aged 19 to 64 Years Without Health Insurance Coverage by Selected Characteristics: 2014 ...17
Figure 7. Uninsured Rate by State: 2014 ...19
Figure 8. Decrease in the Uninsured Rate by State: 2013 to 2014 ...20
APPENDIXES
Appendix A.Estimates of Health Insurance Coverage
... 25Quality of Health Insurance Coverage Estimates ... 25
Appendix B.
Replicate Weights
... 31Appendix C.
Additional Data and Contacts
... 32Customized Tables ... 32
The CPS Table Creator ... 32
American FactFinder ... 32
DataFerrett ... 32
Public Use MicroData ... 32
CPS ASEC ... 32
ACS ... 32
Topcoding ... 32
APPENDIX TABLES
Table A-1. Population Without Health Insurance Coverage by State: 2013 and 2014 ... 26Table A-2. Number of People by Type of Health Insurance Coverage by Age: 2013 and 2014 ... 27
Table A-3. Number of People by Type of Health Insurance Coverage for Working-Age Adults: 2013 and 2014 ... 28
Table A-4. Number of People by Type of Health Insurance Coverage by Household Income and Income-to-Poverty Ratio: 2013 and 2014 ... 29
Table A-5. Number of People by Type of Health Insurance Coverage by Selected Demographic Characteristics: 2013 and 2014 ... 30
Health Insurance Coverage in the United States: 2014
Health Insurance Coverage
in the United States: 2014
IntroductionHealth insurance is a means for financ-ing a person’s health care expenses. While the majority of people have private health insurance, primarily through an employer, many others obtain coverage through programs offered by the government. Other indi-viduals do not have health insurance at all (see the text box “What Is Health Insurance Coverage?”).
Over time, changes in the rate of health insurance coverage and the distribution of coverage types may reflect economic trends, shifts in the demographic composition of the popu-lation, and policy changes that impact access to care. Several such policy changes occurred in 2014, when many provisions of the Patient Protection
and Affordable Care Act (ACA) went into effect (see the text box “Health Insurance Coverage and the Affordable Care Act”).
This report presents statistics on health insurance coverage in the United States in 2014 and also focuses on changes between 2013 and 2014. The statistics in this report are based on information collected in two surveys conducted by the U.S. Census Bureau, the Current Population Survey Annual Social and Economic Supplement (CPS ASEC) and the American Community Survey (ACS) (see the text box “Two Measures of Health Insurance Coverage”). Throughout the report, unless other-wise noted, estimates come from the CPS ASEC.
National Changes in Health Insurance Coverage
The percentage of people without health insurance coverage decreased sharply between 2013 and 2014 by just under 3.0 percentage points, specifically, by 2.9 percentage points as measured by the CPS ASEC. The ACS measured a comparable decline (Figure 1).1
The CPS ASEC uninsured rate, which represents the percentage of the population who had no health insur-ance coverage during the entire year, changed from 13.3 percent in 2013 to 10.4 percent in 2014. As expected, the CPS ASEC estimates were lower for both years than comparable estimates from the ACS, which measures health insur-ance coverage status at the time of the survey interview. However, the unin-sured rate between 2013 and 2014 fell in parallel between the two surveys.2 After several years of a relatively stable uninsured rate between 2008 and 2013, as measured by the ACS, the percentage of the population who were uninsured dropped between 2013 and 2014, marking the largest percentage-point decline in the unin-sured rate during this period (Figure 1 and Table A-1).3
1 The decrease of 2.9 percentage points in the percentage with no health insurance cover-age at any time during the year (as measured by the CPS ASEC) was not statistically different from the decrease of 2.8 percentage points in the per-centage of people without coverage at the time of the interview (as measured by the ACS).
2 With the recent redesign of the CPS ASEC health insurance questions, the estimates from the 2013 calendar year and later are not directly comparable to 2012 and prior years. However, the health insurance questions in the ACS have remained unchanged since they were added to the survey in 2008. Therefore, data from the ACS provide a longer view of change in health insur-ance coverage between 2008 and 2014.
3 Between 2008 and 2013, the uninsured rate ranged from 14.5 percent to 15.5 percent. What Is Health Insurance Coverage?
Health insurance coverage in the Current Population Survey Annual Social and Economic Supplement (CPS ASEC) refers to comprehensive coverage during the calendar year.* For reporting purposes, the Census Bureau broadly classifies health insurance coverage as private insurance or government insurance. The CPS ASEC defines private health insurance as a plan provided through an employer or a union and coverage pur-chased directly by an individual from an insurance company or through an exchange. Government health insurance includes federal programs such as Medicare, Medicaid, the Children’s Health Insurance Program (CHIP), individual state health plans, TRICARE, CHAMPVA (Civilian Health and Medical Program of the Department of Veterans Affairs), as well as care provided by the Department of Veterans Affairs and the military. In the CPS ASEC, people were considered “insured” if they were covered by any type of health insurance for all or part of the previous calendar year. They were considered uninsured if, for the entire year, they were not covered by any type of health insurance. Additionally, people were considered uninsured if they only had coverage through the Indian Health Service (IHS). For more information, see Appendix A, “Estimates of Health Insurance Coverage.”
* Comprehensive health insurance covers basic healthcare needs. This definition excludes single service plans, such as accident, disability, dental, vision, or prescription medicine plans.
Two Measures of Health Insurance Coverage
This report includes two types of health insurance coverage measures: health insurance coverage during the entire calendar year and health insurance coverage at the time of the interview.
The first measure, coverage at any time during the calendar year, is collected with the Current Population Survey Annual Social and Economic Supplement (CPS ASEC). The CPS is the longest-running survey conducted by the Census Bureau. The key purpose of the CPS ASEC is to provide timely and detailed estimates of economic well-being, of which health insurance coverage is an important part. The CPS ASEC is conducted annually between February and April, and the resulting measure of health insurance coverage reflects an individual’s coverage during the entire previous calendar year.
The second measure is the health insurance coverage status an individual reported at the time of the interview, which is collected in the American Community Survey (ACS). The ACS is an ongoing survey that collects comprehen-sive information on social, economic, and housing topics. Due to its large sample size, the ACS provides estimates at many levels of geography. Estimates reflect an annual average of current health insurance coverage status.
As a result of the difference in the collection of health insurance coverage status, the resulting uninsured rates measure different concepts. The CPS ASEC uninsured rate represents the percentage of people who had no health insurance coverage at any time during the previous calendar year. The ACS uninsured rate is a measure of the percentage of people who were uninsured at the time of the interview.
For more information on health insurance coverage estimates from these two surveys, see the section “National Changes in Health Insurance Coverage.”
Health Insurance Coverage and the Affordable Care Act
Since the passage of the Patient Protection and Affordable Care Act (ACA) in 2010, several provisions of the ACA have gone into effect at different times. For example, in 2010, the Young Adult Provision enabled adults under age 26 to remain as dependents on their parents’ health insurance plans. Many more of the main provisions went into effect on January 1, 2014, including the expansion of Medicaid eligibility and the establishment of health insurance marketplaces (e.g., healthcare.gov).
As described in this report, decreases in the uninsured rates between 2013 and 2014 are consistent with what some provisions of the ACA intended. In 2014, people under age 65, particularly adults aged 19 to 64 years, may have become eligible for coverage options under the ACA. Based on family income, some people may have qualified for subsidies or tax credits to help pay for premiums associated with health insurance plans. In addition, the population with lower income may have become eligible for Medicaid coverage if they resided in one of the 24 states (or the District of Columbia) that expanded Medicaid eligibility.*
* For a list of the states and their Medicaid expansion status as of January 1, 2014, see Table A-1: Population Without Health Insurance Coverage by State: 2013 and 2014.
Health Insurance Coverage in the United States: 2014
Highlights
• The uninsured rate decreased between 2013 and 2014 by 2.9 percentage points.4 In 2014, the percentage of people without health insurance coverage for the entire calendar year was 10.4 per-cent, or 33.0 million, lower than the rate and number of uninsured in 2013 (13.3 percent or 41.8 mil-lion) (Figure 2 and Table 1).5, 6
4 Estimates for the 2013 calendar year are from the 2014 CPS ASEC and are based on the full sample of approximately 98,000 addresses. For more information, see the section on “Source of Estimates: 2014 and 2015 CPS ASEC Estimates.”
5 For a brief description of how the Census Bureau collects and reports on health insurance data, see the text box “What Is Health Insurance Coverage?” For a discussion of the quality of the CPS ASEC health insurance coverage estimates, see Appendix A.
6 For information on recessions, see Appendix A, P60-252, Income and Poverty in the United States: 2014 at <www.census.gov /content/dam/Census/library/publications /2015/demo/p60-252.pdf>.
• Between 2008 and 2013, the uninsured rate was relatively stable. In 2014, the uninsured rate sharply decreased, which was the largest change in the unin-sured rate throughout this period (Figure 1).7
• The percentage of people with health insurance coverage for all or part of 2014 was 89.6 percent, higher than the rate in 2013 (86.7 percent) (Table 1).
• In 2014, more people had pri-vate health insurance coverage (66.0 percent) than government coverage (36.5 percent). Of the subtypes of health insur-ance, employer-based insurance covered the most people (55.4 percent of the population), fol-lowed by Medicaid (19.5 percent), Medicare (16.0 percent), direct-purchase (14.6 percent), and 7 Estimates are from the 2008 to 2014 1-Year American Community Surveys.
military coverage (4.5 percent) (Table 1 and Figure 2).
• Between 2013 and 2014, the increase in the percentage of the population covered by health insurance was due to an increase in the rates of both private and government coverage. The rate of private coverage increased by 1.8 percentage points to 66.0 percent in 2014 (up from 64.1 percent in 2013), and the government coverage rate increased by 2.0 percentage points to 36.5 percent (up from 34.6 percent in 2013) (Table 1 and Figure 2).
• Between 2013 and 2014, the greatest changes in coverage rates were the increases in direct-purchase health insurance and Medicaid. The largest percentage-point change in coverage was for direct-purchase, which increased by 3.2 percentage points to cover 14.6 percent of people for some Figure 1.
Uninsured Rate: 2008 to 2014
Percent Uninsured at the time of the interview (American Community Survey)
Uninsured for the entire calendar year (Current Population Survey)
Note: For the American Community Survey, estimates are for the civilian noninstitutionalized population. For the Current Population Survey, estimates reflect the population as of March of the following year. For information on confidentiality protection, sampling error, nonsampling error, and definitions in the Current Population Survey, see <www2.census.gov/programs-surveys/cps/techdocs/cpsmar15.pdf>. For information on confidentiality protection, sampling error, nonsampling error, and definitions in the American Community Survey, see <www2.census.gov /programs-surveys/acs/tech_docs/accuracy/ACS_Accuracy_of_Data_2014.pdf>.
Source: U.S. Census Bureau, 2014 and 2015 Current Population Survey Annual Social and Economic Supplements and 2008 to 2014 1-Year American Community Surveys.
0 4 8 12 16
2014 2013
2012 2011
2010 2009
or all of 2014 (up from 11.4 percent in 2013). The percentage of people with Medicaid cover-age during all or part of the year increased by 2.0 percentage points to 19.5 percent in 2014 (compared with 17.5 percent in 2013) (Table 1 and Figure 2). • In 2014, the percentage of
uninsured children under age 19 was 6.2 percent (Table 2). This was a decrease from 7.5 percent in 2013.
• In 2014, the uninsured rate for children under age 19 in poverty, 8.6 percent, was higher than the uninsured rate for children not in poverty, 5.6 percent (Figure 6). • In 2014, non-Hispanic Whites had
the lowest uninsured rate among race and Hispanic-origin groups, at 7.6 percent. The uninsured rates for Blacks and Asians were higher than for non-Hispanic Whites, at 11.8 percent and 9.3 percent, respectively. Hispanics
had the highest uninsured rate in 2014, at 19.9 percent (Table 5).8 • Between 2013 and 2014, the
overall rate of health insurance
8 Federal surveys give respondents the option of reporting more than one race. Therefore, two basic ways of defining a race group are pos-sible. A group such as Asian may be defined as those who reported Asian and no other race (the race-alone or single-race concept) or as those who reported Asian regardless of whether they also reported another race (the race-alone-or-in-combination concept). The body of this report (text, figures, and tables) shows data using the first approach (race alone). Use of the single-race population does not imply that it is the preferred method of presenting or analyzing data. The Census Bureau uses a variety of approaches.
In this report, the term “non-Hispanic White” refers to people who are not Hispanic and who reported White and no other race. The Census Bureau uses non-Hispanic Whites as the compari-son group for other race groups and Hispanics.
Since Hispanics may be any race, data in this report for Hispanics overlap with data for race groups. Being Hispanic was reported by 14.6 percent of White householders who reported only one race, 5.0 percent of Black householders who reported only one race, and 2.0 percent of Asian householders who reported only one race.
Data users should exercise caution when interpreting aggregate results for the Hispanic population or for race groups because these populations consist of many distinct groups that differ in socioeconomic characteristics, culture, and recent immigration status. For further infor-mation, see <www.census.gov/cps>.
coverage increased for all race and Hispanic-origin groups. The increase was comparable for Blacks, Asians, and Hispanics (just over 4.0 percentage points), and lower for non-Hispanic Whites (2.1 percentage points).
• Between 2013 and 2014, every state and the District of Columbia experienced a decrease in their uninsured rate (Figure 8 and Table A-1).9
Estimates of the Population Without Health Insurance Coverage
In 2014, 10.4 percent of people (or 33.0 million) were uninsured for the entire calendar year (Table 1). This was a decrease of 2.9 percentage points from 2013, when 13.3 percent (or 41.8 million) were uninsured for the entire calendar year.
9 Estimates are from the 2013 and 2014 1-Year American Community Surveys. Note: Between 2013 and 2014, there was not a statistically significant change in the percentage of people covered by employment-based health insurance or military health care.
*Military health care includes TRICARE and CHAMPVA (Civilian Health and Medical Program of the Department of Veterans Affairs), as well as care provided by the Department of Veterans Affairs and the military.
For information on confidentiality protection, sampling error, nonsampling error, and definitions in the Current Population Survey, see <www2.census.gov/programs-surveys/cps/techdocs/cpsmar15.pdf>.
Source: U.S. Census Bureau, Current Population Survey, 2014 and 2015 Annual Social and Economic Supplements. Figure 2.
Percentage of People by Type of Health Insurance Coverage and Change From Last Year: 2014
0 20 40 60 80 100
Military health care* Medicaid Medicare Any government plan Direct-purchase Employment-based Any private plan With health insurance Uninsured
–4 –2 0 2 4
Percent in 2014 Percentage point change:
2014 minus 2013 (Population as of March of the following year)
Health Insurance Coverage in the United States: 2014
Table 1.
Coverage Rates by Type of Health Insurance: 2013 and 2014
(Numbers in thousands, margins of error in thousands or percentage points as appropriate. Population as of March of the following year. For information on confidentiality protection, sampling error, nonsampling error, and definitions, see www2.census.gov/programs -surveys/cps/techdocs/cpsmar15.pdf)
Coverage type
2013 2014 Change
in number (2014 less 2013)
Change in rate (2014 less 2013) Number Margin of error1 (±) Rate
Margin of
error1 (±) Number
Margin of
error1 (±) Rate
Margin of error1 (±)
Any health plan . . . . 271,606 636 86 .7 0 .2 283,200 568 89 .6 0 .2 *11,594 *2 .9 Any private plan2, 3 . . . . 201,038 1,140 64 .1 0 .4 208,600 1,221 66 .0 0 .4 *7,562 *1 .8 Employment-based2 . . . . 174,418 1,160 55 .7 0 .4 175,027 1,188 55 .4 0 .4 609 –0 .3 Direct-purchase2 . . . . 35,755 615 11 .4 0 .2 46,165 798 14 .6 0 .3 *10,411 *3 .2 Any government plan2, 4 . . . . 108,287 1,115 34 .6 0 .4 115,470 1,035 36 .5 0 .3 *7,183 *2 .0 Medicare2 . . . . 49,020 377 15 .6 0 .1 50,546 339 16 .0 0 .1 *1,526 *0 .3 Medicaid2 . . . . 54,919 969 17 .5 0 .3 61,650 931 19 .5 0 .3 *6,731 *2 .0 Military health care2, 5 . . . . 14,016 595 4 .5 0 .2 14,143 568 4 .5 0 .2 127 Z Uninsured6 . . . . 41,795 614 13 .3 0 .2 32,968 561 10 .4 0 .2 *–8,828 *–2 .9
* Changes between the 2013 and 2014 estimates are statistically different from zero at the 90 percent confidence level . Z Represents or rounds to zero .
1 A margin of error is a measure of an estimate’s variability . The larger the margin of error in relation to the size of the estimate, the less reliable the estimate . This number,
when added to and subtracted from the estimate, forms the 90 percent confidence interval . Margins of error shown in this table are based on standard errors calculated using replicate weights . For more information, see “Standard Errors and Their Use” at <www2 .census .gov/library/publications/2015/demo/p60-253sa .pdf> .
2 The estimates by type of coverage are not mutually exclusive; people can be covered by more than one type of health insurance during the year .
3 Private health insurance includes coverage provided through an employer or union, coverage purchased directly by an individual from an insurance company, or coverage
through someone outside the household .
4 Government health insurance coverage includes Medicaid, Medicare, TRICARE, CHAMPVA (Civilian Health and Medical Program of the Department of Veterans Affairs),
and care provided by the Department of Veterans Affairs and the military .
5 Military health care includes TRICARE and CHAMPVA (Civilian Health and Medical Program of the Department of Veterans Affairs), as well as care provided by the
Department of Veterans Affairs and the military .
6 Individuals are considered to be uninsured if they do not have health insurance coverage for the entire calendar year .
Source: U .S . Census Bureau, Current Population Survey, 2014 and 2015 Annual Social and Economic Supplements .
This report classifies health insur-ance coverage into three different groups: private health insurance, government health insurance, and the uninsured. Private health insurance includes coverage provided through an employer or union and coverage purchased directly by an individual from an insurance company or through an exchange.10 Government health insurance coverage includes federal programs such as Medicare, Medicaid, the Children’s Health Insurance Program (CHIP), individual state health plans, TRICARE, CHAMPVA (Civilian Health and Medical Program of the Department of Veterans Affairs), as well as care provided by the Health and Medical Program of the Department of Veterans Affairs and the military (VA Care). Individuals are con-sidered to be uninsured if they do not
10 Exchange plans include coverage purchased through the federal Health Insurance Marketplace as well as other state-based marketplaces and include both subsidized and unsubsidized plans.
have health insurance coverage for the entire calendar year. For more informa-tion, see the text box “What Is Health Insurance Coverage?”
In 2014, most people (89.6 percent) had health insurance coverage at some point during the calendar year, with more people having private health insurance coverage (66.0 percent) than government coverage (36.5 percent). Of the subtypes of health insurance, employer-based insurance covered the most people (55.4 percent of the population), followed by Medicaid (19.5 percent), Medicare (16.0 per-cent), direct-purchase (14.6 perper-cent), and military health care (4.5 percent) (Table 1).
Between 2013 and 2014, the percent-age of people covered by any type of health insurance increased by 2.9 percentage points to 89.6 percent in 2014, up from 86.7 percent in 2013. The increase in the percentage of the
population covered by health insur-ance was due to an increase in the rates of both private and government coverage. The rate of private coverage increased by 1.8 percentage points to 66.0 percent in 2014 (up from 64.1 percent in 2013), and the govern-ment coverage rate increased by 2.0 percentage points to 36.5 percent (up from 34.6 percent in 2013).
While the overall coverage rates of both private and government health insurance increased, coverage rates have not changed for every subtype of health insurance. Between 2013 and 2014, coverage rates increased for three types of coverage: direct- purchase health insurance, Medicaid, and Medicare. The largest percentage- point change in coverage was for direct-purchase, which increased by 3.2 percentage points to cover 14.6 percent of people for some or all of 2014 (up from 11.4 percent in 2013). The percentage of people
with Medicaid coverage during all or part of the year increased by 2.0 percentage points to 19.5 percent in 2014 (compared with 17.5 percent in 2013). Between 2013 and 2014, the Medicare coverage rate increased by 0.3 percentage points for the population as a whole. However, this increase was due to an increase in the number of people aged 65 years and over and not to changes in Medicare coverage rates within a particular age group.11 Coverage rates did not change for the other types of health insurance between 2013 and 2014, including employment-based insur-ance and plans through the military.
11 Between 2013 and 2014, the Medicare rate did not change for the population under age 65 or for individuals aged 65 years and older. In 2014, the Medicare rate was 2.9 percent for the population under age 65, which was not differ-ent from the rate in 2013 (2.8 percdiffer-ent). For the population aged 65 years and over, 93.1 percent were covered by Medicare in 2014, not different from the rate in 2013 (93.4 percent). Between 2013 and 2014, the percentage of the popula-tion who were age 65 and older increased by 0.4 percentage points, from 14.2 percent of the population to 14.5 percent of the population.
Multiple Coverage Types
Individuals may have multiple types of coverage at one time to supple-ment their primary insurance type, or switch coverage types over the course of the year. Of the population with health insurance coverage in 2014, 79.2 percent had one coverage type during the year and 20.8 percent had multiple coverage types over the course of the year (Figure 3).
Some types of health insurance cover-age were more likely to be held alone, while other types of health insurance coverage were more likely to be held in combination with another type of insurance at some point during the year. The majority of people with employment-based health insurance or Medicaid coverage had only one plan type during 2014 (79.3 percent and 67.3 percent, respectively). People were more likely to have had more than one coverage type during the year if they had direct-purchase insurance coverage, Medicare, or military health care. In 2014, 58.2
percent of people with direct-purchase health insurance had some other type of health insurance, along with 61.9 percent of people with Medicare and 60.7 percent of people with military health care.12
Health Insurance Coverage by Selected Characteristics Age
Age is strongly associated with the likelihood that a person has health insurance and the type of health insurance a person has. In 2014, 98.6 percent of adults aged 65 years or over had some type of health insur-ance during the year, compared with 93.8 percent of children under age 19 and 85.7 percent of working-age adults aged 19 to 64 years (Table 2). Adults aged 65 years and over had the highest rate of health insurance coverage because most are eligible
12 The percentage of people with Medicare and some other type of health insurance in 2014 was not statistically different from the percent-age of people with military health care and some other type of health insurance in 2014.
*Military health care includes TRICARE and CHAMPVA (Civilian Health and Medical Program of the Department of Veterans Affairs), as well as care provided by the Department of Veterans Affairs and the military.
For information on confidentiality protection, sampling error, nonsampling error, and definitions in the Current Population Survey, see <www2.census.gov/programs-surveys/cps/techdocs/cpsmar15.pdf>.
Source: U.S. Census Bureau, Current Population Survey, 2015 Annual Social and Economic Supplement. Figure 3.
Percentage With One or Multiple Coverage Types: 2014
Percent within coverage typeOne coverage type Multiple coverage types
0 10 20 30 40 50 60 70 80 90 100
Military health care* Medicaid Medicare
Any government plan
Direct-purchase Employment-based
Any private plan Any health plan
Health Insurance Coverage in the United States: 2014
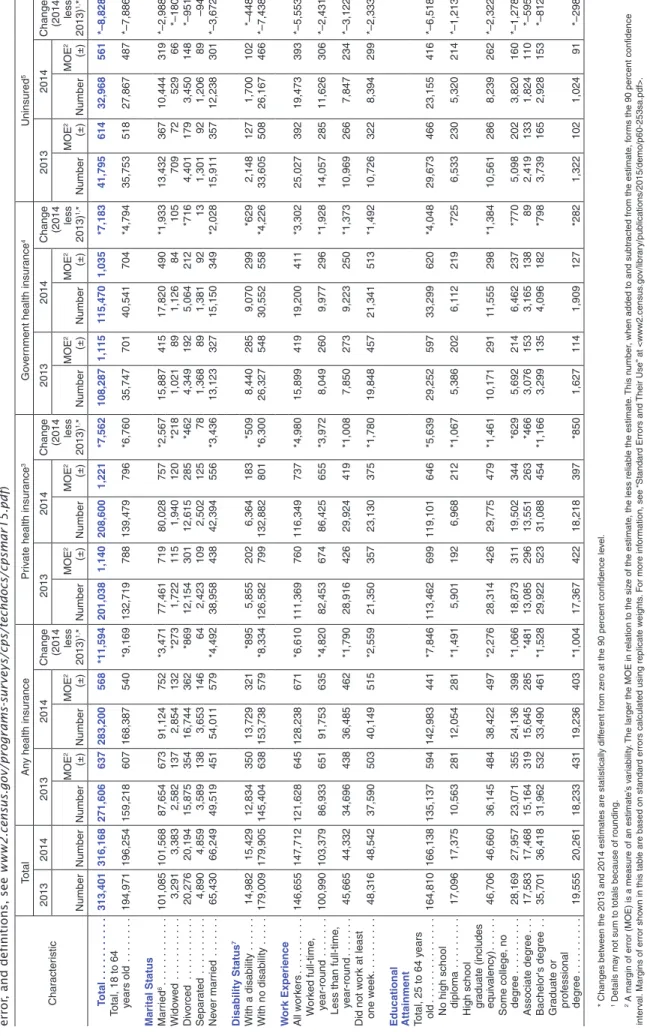
Table 2.
Percentage of People by T
ype of Health Insurance Coverage by Age: 2013 and 2014
(Numbers in thousands, mar
gins of err
or in per
centage points. Population as of Mar
ch of the following year
. For information on confidentiality pr
otection, sampling err
or
,
nonsampling err
or
, and definitions, see
www2.census.gov/programs-surveys/cps/techdocs/cpsmar15.pdf ) Char acter istic Total An
y health insur
ance
Pr
iv
ate health insur
ance
3
Go
ver
nment health insur
ance 4 Uninsured 5 2013 2014 2013 2014 Change
(2014 less 2013)
1,* 2013 2014 Change (2014 less 2013) 1,* 2013 2014 Change
(2014 less 2013)
1,*
2013
2014
Change
(2014 less 2013)
1,* Number Number Pe r-cent MOE 2 (±) Pe r-cent MOE 2 (±) Pe r-cent MOE 2 (±) Pe r-cent MOE 2 (±) Pe r-cent MOE 2 (±) Pe r-cent MOE 2 (±) Pe r-cent MOE 2 (±) Pe r-cent MOE 2 (±) Total . . . . . 313,401 316,168 86 .7 0 . 2 89 .6 0 . 2 *2 .9 64 .1 0 . 4 66 .0 0 . 4 *1 .8 34 .6 0 . 4 36 .5 0 . 3 *2 .0 13 .3 0 . 2 10 .4 0 . 2 *–2 .9 Ag e
Under age 65
. . . . . 268,924 270,174 84 .7 0 . 2 88 .0 0 . 2 *3 .3 65 .8 0 . 4 68 .2 0 . 4 *2 .5 24 .7 0 . 4 26 .8 0 . 4 *2 .1 15 .3 0 . 2 12 .0 0 . 2 *–3 .3
Under age 19
6 . . .
. 78,051 78,119 92 .5 0 . 3 93 .8 0 . 3 *1 .3 60 .1 0 . 6 61 .0 0 . 6 *1 .0 40 .9 0 . 7 42 .6 0 . 6 *1 .7 7 . 5 0 . 3 6 . 2 0 . 3 *–1 .3
Aged 19 to 64
. . . . . 190,874 192,055 81 .5 0 . 3 85 .7 0 . 2 *4 .2 68 .1 0 . 4 71 .1 0 . 4 *3 .1 18 .1 0 . 4 20 .4 0 . 4 *2 .3 18 .5 0 . 3 14 .3 0 . 2 *–4 .2
Aged 19 to 25
7 . .
. 30,454 30,508 77 .9 0 . 7 82 .9 0 . 6 *5 .0 62 .9 0 . 9 67 .5 0 . 8 *4 .6 20 .1 0 . 7 22 .1 0 . 7 *2 .0 22 .1 0 . 7 17 .1 0 . 6 *–5 .0
Aged 26 to 34
. . . . 38,058 38,415 76 .3 0 . 6 81 .8 0 . 5 *5 .5 62 .6 0 . 7 67 .2 0 . 7 *4 .6 17 .6 0 . 6 20 .3 0 . 6 *2 .7 23 .7 0 . 6 18 .2 0 . 5 *–5 .5
Aged 35 to 44
. . . . 39,789 39,919 81 .1 0 . 5 84 .6 0 . 4 *3 .5 69 .8 0 . 6 71 .5 0 . 6 *1 .8 15 .5 0 . 5 18 .2 0 . 5 *2 .7 18 .9 0 . 5 15 .4 0 . 4 *–3 .5
Aged 45 to 64
. . . . 82,572 83,213 85 .4 0 . 3 89 .0 0 . 3 *3 .6 71 .7 0 . 5 74 .1 0 . 5 *2 .4 18 .9 0 . 5 20 .9 0 . 5 *2 .0 14 .6 0 . 3 11 .0 0 . 3 *–3 .6
Aged 65 and older
. . . 44,477 45,994 98 .5 0 . 2 98 .6 0 . 1 0 . 1 54 .4 0 . 8 52 .8 0 . 9 *–1 .6 93 .9 0 . 3 93 .6 0 . 3 –0 .3 1 . 5 0 . 2 1 . 4 0 . 1 –0 .1
* Changes betw
een the 2013 and 2014 estimates are statistically diff
erent from z
ero at the 90 percent confidence le
vel
.
1 Details ma
y not sum to totals because of rounding
.
2 A margin of error (MOE) is a measure of an estimate’
s v
ar
iability
. The larger the MOE in relation to the siz
e of the estimate
, the less reliab
le the estimate
. This n
umber
, when added to and subtr
acted from the estimate
, f
or
ms the 90 percent confidence
inter
val
. Margins of error sho
wn in this tab
le are based on standard errors calculated using replicate w
eights
. F
or more inf
or
mation, see
“Standard Errors and
Their Use” at <www2 .census .go v/libr ar y/pub lications/2015/demo/p60-253sa .pdf> .
3 Pr
iv
ate health insur
ance includes co
ver
age pro
vided through an emplo
yer or union, co
ver
age purchased directly b
y an individual from an insur
ance compan
y, or co
ver
age through someone outside the household
.
4 Go
ver
nment health insur
ance co
ver
age includes Medicaid, Medicare
, TRICARE, CHAMPV
A (Civilian Health and Medical Prog
ram of the Depar
tment of
V
eter
ans Aff
airs), and care pro
vided b
y the Depar
tment of
V
eter
ans Aff
airs and the militar
y .
5 Individuals are considered to be uninsured if the
y do not ha
ve health insur
ance co
ver
age f
or the entire calendar y
ear
.
6 Children under the age of 19 are eligib
le f
or Medicaid/CHIP
.
7 This age is of special interest because of the Aff
ordab
le Care Act’
s dependent co
ver
age pro
vision
. Individuals aged 19 to 25 y
ears ma
y be eligib
le to be a dependent on a parent’
s health insur
ance plan
.
Note:
The estimates b
y type of co
ver age are not m utually e xclusiv e;
people can be co
vered b
y more than one type of health insur
ance dur
ing the y
ear
.
Source:
U
.S
. Census Bureau, Current P
opulation Sur
ve
y, 2014 and 2015 Ann
ual Social and Economic Supplements
for Medicare. In 2014, 93.6 percent of older adults were covered by a gov-ernment plan and 52.8 percent were covered by a private plan, which may have supplemented their government coverage. The rate of health insurance coverage overall, as well as the rate of government coverage, did not change between 2013 and 2014 for the popu-lation aged 65 years and over, while the rate of private health insurance decreased by 1.6 percentage points. Children under age 19 were covered by health insurance at a higher rate than working-age adults and at a lower rate than older adults. One reason for this could be that some children from lower income fami-lies are eligible for programs such as Medicaid or the Children’s Health Insurance Program (CHIP).13 In 2014, 42.6 percent of children under age 19 had government coverage, while 61.0 percent were covered by private insur-ance. Some children were covered by both private and government cover-age for all or part of the calendar year. Between 2013 and 2014, the overall rate of health insurance coverage for children under 19 increased by 1.3 percentage points. The rate of government coverage increased by 1.7 percentage points, while the rate of private coverage increased by 1.0 percentage point.14
Compared with children and older adults, working-age adults (people aged 19 to 64 years) had the low-est health insurance coverage rate in 2014, at 85.7 percent. Within that group, the population aged 26 to 34 years were least likely to be insured, with a coverage rate of 81.8 percent. For younger adults aged 19 to 25 years, the health insurance coverage
13 The Children’s Health Insurance Program (CHIP) is a government program that provides health insurance to children in families with incomes too high to qualify for Medicaid, but who are unable to afford private health insurance.
14 The percentage point increase between 2013 and 2014 in the overall health insurance rate for children under 19 was not statistically different from the percentage point increase between 2013 and 2014 in government health insurance for children under 19.
rate of 82.9 percent was lower than that for children under age 19 but higher than that for adults aged 26 to 34 years. For the age groups between 26 and 64 years, the rate of health insurance coverage increased as age increased.
Compared with other age groups, working-age adults were the most likely to be covered by private health insurance, which provided coverage to 71.1 percent of the population aged 19 to 64 years in 2014. They also had the lowest rate of coverage through the government, at 20.4 percent. Between 2013 and 2014, the per-centage of adults aged 19 to 64 years with health insurance coverage increased by 4.2 percentage points. The rates of private and government coverage increased for working-age adults by 3.1 percentage points and 2.3 percentage points, respectively. Increases in private coverage were more pronounced for adults in the age groups between 19 and 34 years than for the age groups between 35 and 64 years, while changes in government coverage between 2013 and 2014 did not differ by age within the working-age adult population.15
The percentage of people without health insurance coverage dropped for every single age under 65 between 2013 and 2014 (Figure 4). However, the change was not uniform for every age. Older children tended to experience larger changes in the uninsured rate than younger children. Younger adults tended to experience a larger drop than older adults. For example, the uninsured rate declined by 5.0 percentage points for 20-year-olds and 2.7 percentage points for 64-year-olds.16
15 The percentage of adults aged 19 to 25 years with private health insurance in 2014 was not statistically different from the percentage of adults aged 26 to 34 years with private health insurance in 2014.
16 Estimates on single-year of age come from the 2013 and 2014 1-Year American Community Surveys.
The uneven downward shift in uninsured rates reduced some of the rate differences, leaving a more even uninsured rate curve across the age spectrum, with the highest uninsured rate of 25.1 percent at age 26 (Figure 4). Three notable sharp dif-ferences occurred between single age years, specifically between 18- and 19-year-olds, between 25- and 26-year-olds, and between 64- and 65-year-olds. In 2014, the uninsured rate was over one-and-a-half times greater for 19-year-olds compared with 18-year-olds, almost one-and-a-quarter times greater for 26-year-olds compared with 25-year-olds, and the uninsured rate for 65-year-olds was about one-quarter of the rate of 64-year-olds.
Even within the broad age groups, uninsured rates for single years of age differed. In 2014, for children under age 19, the uninsured rate was greater with increasing age, with 4.0 percent for children under 1 year of age and 11.0 percent for 18-year-olds. Among young adults between the ages of 19 and 25, the uninsured rate was 17.7 percent for 19-year-olds and 21.2 percent for 25-year-olds. For adults between ages 26 and 64, the uninsured rate declined gener-ally across all ages from 25.1 percent for 26-year-olds to 8.8 percent for 64-year-olds. Among older adults aged 65 years and over, the uninsured rate varied little by age.
Marital Status
In 2014, married adults aged 18 to 64 years were more likely to have had health insurance coverage for all or part of the year (89.7 percent), compared with individuals who were divorced (82.9 percent) or never married (81.5 percent) (Table 3). While 78.8 percent of married adults had private coverage, the second highest private coverage rate was 64.0 percent for people who were never married. The population aged 18 to 64 years old who were sepa-rated or widowed had the lowest rates
Health Insurance Coverage in the United States: 2014
of private coverage (51.5 percent and 57.3 percent, respectively) and the highest rates of government cover-age (28.4 percent and 33.3 percent, respectively). Married adults had the lowest rate of government coverage (17.5 percent).
Between 2013 and 2014, every group experienced an increase in their coverage rate except for people who were separated. The health insurance coverage rate for the married popu-lation increased by 3.0 percentage points, compared with 5.9 percentage points for people who were widowed, 4.6 percentage points for people who were divorced, and 5.8 percentage points for people who were never married.17
17 The percentage point increase between 2013 and 2014 for widowed individuals was not statistically different from the percentage point difference between 2013 and 2014 for people who were divorced and people who were never married.
Disability Status
The percentage of working-age adults with a disability who had any type of health insurance coverage in 2014 was higher than for the population with no disability. In 2014, 89.0 percent of adults aged 18 to 64 years with a disability had insurance cover-age, compared with 85.5 percent of adults without a disability (Table 3). The type of health insurance cover-age a person had varied by disability status. Among adults aged 18 to 64 years with a disability, 41.2 percent had private health insurance cover-age for all or part of 2014, compared with 73.9 percent of adults with no disability.
Government programs, such as Medicaid and Medicare, assist some qualifying people with disabilities. In 2014, 58.8 percent of people with a disability had government-provided
health insurance, compared with 17.0 percent of people without a disability. Between 2013 and 2014, the unin-sured rate decreased more for the population without a disability than for the population with a disability. The uninsured rate decreased by 3.3 percentage points to 11.0 percent in 2014 for people with a disability.18 For people without a disability, the unin-sured rate decreased by 4.2 percent-age points to 14.5 percent in 2014. Work Experience
For many adults, their health insur-ance coverage is related to their work status, such as working full time and year round, working less than full time and year round, or not working
18 The percentage of individuals with a dis-ability who were uninsured in 2013 was not statistically different from the percentage of indi-viduals without a disability who were uninsured in 2014.
Figure 4.
Uninsured Rate by Single Year of Age: 2013 and 2014
Percent(Civilian noninstitutionalized population) 2013
2014
Age
For information on confidentiality protection, sampling error, nonsampling error, and definitions in the American Community Survey,
see <www2.census.gov/programs-surveys/acs/tech_docs/accuracy/ACS_Accuracy_of_Data_2014.pdf>. Source: U.S. Census Bureau, 2013 and 2014 1-Year American Community Surveys.
0 5 10 15 20 25 30 35
75+ 70
65 60 55 50 45 40 35 30 25 20 15 10 5
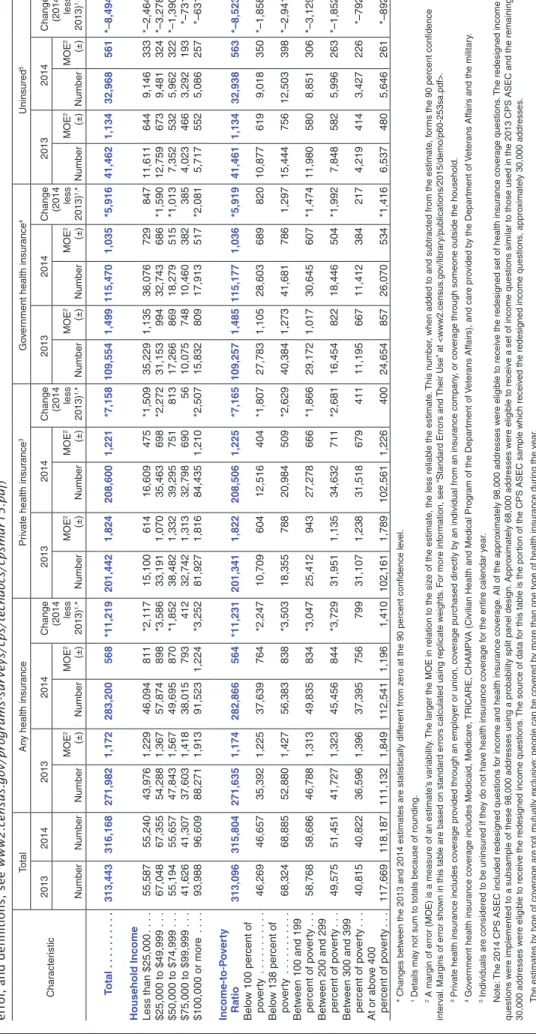
Table 3.
Percentage of People by T
ype of Health Insurance Coverage for W
orking-Age Adults: 2013 and 2014
(Numbers in thousands, mar
gins of err
or in per
centage points. Population as of Mar
ch of the following year
. For information on confidentiality pr
otection, sampling err
or
,
nonsampling err
or
, and definitions, see
www2.census.gov/programs-surveys/cps/techdocs/cpsmar15.pdf) Char acter istic Total An
y health insur
ance
Pr
iv
ate health insur
ance
3
Go
ver
nment health insur
ance 4 Uninsured 5 2013 2014 2013 2014 Change (2014 less 2013) 1,* 2013 2014 Change
(2014 less 2013)
1,*
2013
2014
Change
(2014 less 2013)
1,*
2013
2014
Change
(2014 less 2013)
1,* Number Number Pe r-cent MOE 2 (±) Pe r-cent MOE 2 (±) Pe r-cent MOE 2 (±) Pe r-cent MOE 2 (±) Pe r-cent MOE 2 (±) Pe r-cent MOE 2 (±) Pe r-cent MOE 2 (±) Pe r-cent MOE 2 (±) Total . . . . . 313,401 316,168 86 .7 0 . 2 89 .6 0 . 2 *2 .9 64 .1 0 . 4 66 .0 0 . 4 *1 .8 34 .6 0 . 4 36 .5 0 . 3 *2 .0 13 .3 0 . 2 10 .4 0 . 2 *–2 .9
Total, 18 to 64
y ears old . . . . . 194,971 196,254 81 .7 0 . 3 85 .8 0 . 2 *4 .1 68 .1 0 . 4 71 .1 0 . 4 *3 .0 18 .3 0 . 3 20 .7 0 . 4 *2 .3 18 .3 0 . 3 14 .2 0 . 2 *–4 .1 Marital Status Marr ied
6 . . . .
. 101,085 101,568 86 .7 0 . 3 89 .7 0 . 3 *3 .0 76 .6 0 . 5 78 .8 0 . 4 *2 .2 15 .7 0 . 4 17 .5 0 . 5 *1 .8 13 .3 0 . 3 10 .3 0 . 3 *–3 .0 Wido w ed . . . . . 3,291 3,383 78 .5 1 . 8 84 .4 1 . 7 *5 .9 52 .3 2 . 3 57 .3 2 . 4 *5 .0 31 .0 2 . 3 33 .3 2 . 1 2 . 3 21 .5 1 . 8 15 .6 1 . 7 *–5 .9 Div orced . . . . . 20,276 20,194 78 .3 0 . 7 82 .9 0 . 6 *4 .6 59 .9 0 . 9 62 .5 0 . 9 *2 .5 21 .4 0 . 8 25 .1 0 . 8 *3 .6 21 .7 0 . 7 17 .1 0 . 6 *–4 .6 Separ ated . . . . . 4,890 4,859 73 .4 1 . 6 75 .2 1 . 5 1 . 8 49 .6 1 . 6 51 .5 1 . 9 1 . 9 28 .0 1 . 5 28 .4 1 . 6 0 . 4 26 .6 1 . 6 24 .8 1 . 5 –1 .8 Ne ver marr ied . . . . . 65,430 66,249 75 .7 0 . 5 81 .5 0 . 4 *5 .8 59 .5 0 . 6 64 .0 0 . 6 *4 .5 20 .1 0 . 5 22 .9 0 . 5 *2 .8 24 .3 0 . 5 18 .5 0 . 4 *–5 .8 Disability Status 7
With a disability
. . . . . . 14,982 15,429 85 .7 0 . 8 89 .0 0 . 6 *3 .3 39 .1 1 . 0 41 .2 1 . 1 *2 .2 56 .3 1 . 1 58 .8 1 . 2 *2 .4 14 .3 0 . 8 11 .0 0 . 6 *–3 .3
With no disability
. . . . . 179,009 179,905 81 .2 0 . 3 85 .5 0 . 3 *4 .2 70 .7 0 . 4 73 .9 0 . 4 *3 .1 14 .7 0 . 3 17 .0 0 . 3 *2 .3 18 .8 0 . 3 14 .5 0 . 3 *–4 .2 W ork Experience All w or kers . . . . . 146,655 147,712 82 .9 0 . 3 86 .8 0 . 3 *3 .9 75 .9 0 . 4 78 .8 0 . 3 *2 .8 10 .8 0 . 3 13 .0 0 . 3 *2 .2 17 .1 0 . 3 13 .2 0 . 3 *–3 .9 W or ked full-time , y ear-round . . . . . 100,990 103,379 86 .1 0 . 3 88 .8 0 . 3 *2 .7 81 .6 0 . 4 83 .6 0 . 3 *2 .0 8 . 0 0 . 3 9 . 7 0 . 3 *1 .7 13 .9 0 . 3 11 .2 0 . 3 *–2 .7
Less than full-time
, year-round . . . . . 45,665 44,332 76 .0 0 . 5 82 .3 0 . 5 *6 .3 63 .3 0 . 7 67 .5 0 . 6 *4 .2 17 .2 0 . 5 20 .8 0 . 5 *3 .6 24 .0 0 . 5 17 .7 0 . 5 *–6 .3
Did not w
or
k at least
one w eek . . . . . 48,316 48,542 77 .8 0 . 6 82 .7 0 . 6 *4 .9 44 .2 0 . 7 47 .6 0 . 8 *3 .5 41 .1 0 . 7 44 .0 0 . 8 *2 .9 22 .2 0 . 6 17 .3 0 . 6 *–4 .9
Educational Attainment Total, 25 to 64 y
ears old . . . . . 164,810 166,138 82 .0 0 . 3 86 .1 0 . 3 *4 .1 68 .8 0 . 4 71 .7 0 . 4 *2 .8 17 .7 0 . 3 20 .0 0 . 4 *2 .3 18 .0 0 . 3 13 .9 0 . 3 *–4 .1
No high school diploma
. . . . . 17,096 17,375 61 .8 1 . 0 69 .4 1 . 0 *7 .6 34 .5 0 . 9 40 .1 1 . 0 *5 .6 31 .5 0 . 9 35 .2 1 . 0 *3 .7 38 .2 1 . 0 30 .6 1 . 0 *–7 .6 High school gr aduate (includes equiv alency) . . . . . . 46,706 46,660 77 .4 0 . 5 82 .3 0 . 5 *5 .0 60 .6 0 . 7 63 .8 0 . 7 *3 .2 21 .8 0 . 5 24 .8 0 . 6 *3 .0 22 .6 0 . 5 17 .7 0 . 5 *–5 .0 Some college , no deg ree . . . . . 28,169 27,957 81 .9 0 . 6 86 .3 0 . 5 *4 .4 67 .0 0 . 7 69 .8 0 . 7 *2 .8 20 .2 0 . 7 23 .1 0 . 7 *2 .9 18 .1 0 . 6 13 .7 0 . 5 *–4 .4 Associate deg ree . . . 17,583 17,468 86 .2 0 . 7 89 .6 0 . 6 *3 .3 74 .4 1 . 0 77 .6 0 . 8 *3 .2 17 .5 0 . 8 18 .1 0 . 7 0 . 6 13 .8 0 . 7 10 .4 0 . 6 *–3 .3 Bachelor's deg ree . . 35,701 36,418 89 .5 0 . 5 92 .0 0 . 4 *2 .4 83 .8 0 . 5 85 .4 0 . 6 *1 .6 9 . 2 0 . 4 11 .2 0 . 5 *2 .0 10 .5 0 . 5 8 . 0 0 . 4 *–2 .4 Gr aduate or prof essional deg ree . . . . . 19,555 20,261 93 .2 0 . 5 94 .9 0 . 4 *1 .7 88 .8 0 . 6 89 .9 0 . 6 *1 .1 8 . 3 0 . 6 9 . 4 0 . 6 *1 .1 6 . 8 0 . 5 5 . 1 0 . 4 *–1 .7
* Changes betw
een the 2013 and 2014 estimates are statistically diff
erent from z
ero at the 90 percent confidence le
vel
.
ms the 90 percent confidence
.y
.
.pdf>
airs and the militar
or
, f
y/pub
lications/2015/demo/p60-253sa
ans Aff
acted from the estimate
eter . V tment of ar v/libr go
age through someone outside the household
y the Depar
, when added to and subtr
vided b
census
.
.
at <www2
airs), and care pro
” .
umber
Their Use”
er
ans Aff
This n eter
.
ance compan
y, or co
v
ied, spouse absent
“Standard Errors and
“marr
V
tment of
le the estimate
and .
” ear
y an individual from an insur
am of the Depar
ing the y
, the less reliab
med F
mation, see
e of the estimate
or
A (Civilian Health and Medical Prog
r
orces spouse present,
.
orces
ance dur
. med F
or more inf
ear
ied, Ar or individuals in the Ar
.
The larger the MOE in relation to the siz
“marr
eights
F .
age purchased directly b
”
ered bv
yer or union, co
v
TRICARE, CHAMPV
age f
or the entire calendar y y more than one type of health insur
er
er
ance co
v
ied, civilian spouse present, ual Social and Economic Supplements
“marr
,
ies: people can be co
iability
.
v
ar
le are based on standard errors calculated using replicate w
vided through an emplo
age includes Medicaid, Medicare
e health insur
includes three individual categor
The sum of those with and without a disability does not equal the total because disability status is not defined f
e;
xclusiv
s v , 2014 and 2015 Annyev
.
y not sum to totals because of rounding
A margin of error (MOE) is a measure of an estimate’
y do not ha utually e
age pro
er
ance co
v
Individuals are considered to be uninsured if the
m
not
wn in this tab
er
age are
opulation Sur
ance includes co
v
er
ied” v
“marr
y
ate health insur nment health insur
Details ma
The margins of error sho
y type of co
Census Bureau, Current P
er
The combined categor
The estimates b
Note: . S U . iv v .
al Pr
2 v Go
1 3 4 5 6 7 Source:
Health Insurance Coverage in the United States: 2014
at all during the calendar year.19 Of people aged 18 to 64 years who worked at some point during the year, 86.8 percent had health insur-ance coverage for all or part of 2014 (Table 3). In 2014, full-time, year-round workers were more likely to be covered by health insurance (88.8 percent) than the population who worked less than full time, year round (82.3 percent) or nonworkers (82.7 percent).20
In 2014, 83.6 percent of full-time, year-round workers had private insur-ance coverage, compared with 67.5 percent of people who worked less than full time, year round and 47.6 percent of nonworkers. Nonworkers were more than three times as likely to have government health insur-ance (44.0 percent) than people who worked (13.0 percent).
Between 2013 and 2014, all groups experienced an increase in the per-centage of people with health insur-ance coverage, though the size of the change varied by work status.21 The largest coverage rate increase was for the population who worked less than full time, year round. Of this group, 82.3 percent were covered by health insurance in 2014, an increase of 6.3 percentage points from the level in 2013. The smallest percentage point increase, 2.7 percentage points, was for the population who worked full time, year round.
In 2013, nonworkers were more likely to be insured than less than full-time, year-round workers. By 2014, both
19 A full-time, year-round worker is a person who worked 35 or more hours per week (full-time) and 50 or more weeks during the previous calendar year (year-round). For school personnel, summer vacation is counted as weeks worked if they are scheduled to return to their job in the fall.
20 The percentage of insured individuals who worked less than full time, year round in 2014 was not statistically different from the percent-age of insured nonworkers in 2014.
21 The insured rate for nonworkers in 2014 was not statistically different from the insured rate for all workers in 2013. The insured rate for individuals who work less than full time, year round in 2014 was not statistically different from the insured rate for nonworkers in 2014.
groups had comparable coverage rates of about 82.0 percent. While both groups experienced increases in health insurance coverage, this shift was due to the greater increase in the coverage rate for the population who worked less than full time, year round relative to nonworkers.
Educational Attainment
People with higher levels of educa-tional attainment were more likely to have health insurance coverage com-pared with people with lower levels of education in 2014. The population aged 25 to 64 years who had a gradu-ate or professional degree were more likely to be covered by health insur-ance than people with less education. In 2014, 94.9 percent of people with a graduate or professional degree were insured, compared with 92.0 percent of people with a bachelor’s degree, 82.3 percent of high school graduates, and 69.4 percent of the population with no high school diploma (Table 3). Differences in private coverage rates by educational attainment were larger than differences for overall health insurance coverage rates. In 2014, 89.9 percent of the population with a graduate or professional degree had private health insurance, compared with 85.4 percent of people with a bachelor’s degree, 63.8 percent of high school graduates, and 40.1 percent of individuals with no high school diploma.
In comparison, the population with no high school diploma were the most likely to have government coverage (35.2 percent) compared with high school graduates (24.8 percent) and people with a bachelor’s or graduate or professional degree (11.2 percent and 9.4 percent, respectively). People of all education levels expe-rienced an increase in the rate of health insurance coverage between 2013 and 2014. The population with less education experienced a larger increase in their health insurance
coverage rate compared with the population with more education: the coverage rate increased by 7.6 percentage points for people with no high school diploma, 5.0 percentage points for high school graduates, 2.4 percentage points for people with a bachelor’s degree, and 1.7 percent-age points for the population with a graduate or professional degree.22
Household Income
People with lower household income had lower health insurance coverage rates than people with higher income. In 2014, 83.4 percent of people in households with annual household income of less than $25,000 had health insurance coverage, com-pared with 89.3 percent of people in households with income ranging from $50,000 to $74,999 and 94.7 percent of people in households with income of $100,000 or more (Table 4).23 The relationship between household income and private health insur-ance coverage was also positive, but varied more by income level than did the rate of overall health insur-ance coverage. In 2014, 30.1 percent of people with household income below $25,000 had private coverage, compared with 87.4 percent of people with household income at or above $100,000.
The distribution of private coverage rates for lower income groups was more spread out relative to private coverage rates among higher income groups. For example, the private coverage rate for people with house-hold income between $25,000 and $49,999 was 22.6 percentage points higher than for people with house-hold income below $25,000. The difference in private health insurance
22 The percentage point difference between 2013 and 2014 for people with a bachelor’s degree was not statistically different from the percentage point difference between 2013 and 2014 for people with a graduate or professional degree.
23 The 2013 income estimates are inflation-adjusted and presented in 2014 dollars.
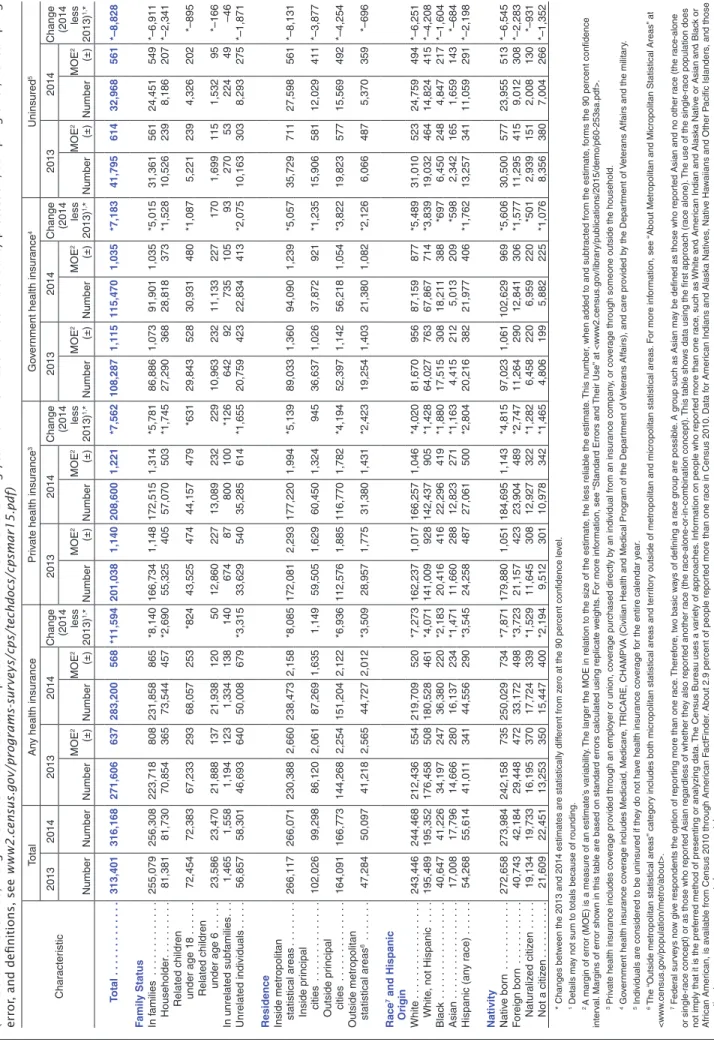
Table 4.
Percentage of People by T
ype of Health Insurance Coverage by Household Income and Income-to-Poverty Ratio:
2013 and 2014
(Numbers in thousands, margins of err
or in per
centage points. Population as of Mar
ch of the following year
. For information on confidentiality pr
otection, sampling err
or
,
nonsampling err
or
, and definitions, see
www2.census.gov/programs-surveys/cps/techdocs/cpsmar15.pdf ) Char acter istic Total An
y health insur
ance
Pr
iv
ate health insur
ance
3
Go
ver
nment health insur
ance 4 Uninsured 5 2013 2014 2013 2014 Change (2014 less 2013) 1,* 2013 2014 Change
(2014 less 2013)
1,* 2013 2014 Change (2014 less 2013) 1,* 2013 2014 Change
(2014 less 2013)
1,* Number Number Pe r-cent MOE 2 (±) Pe r-cent MOE 2 (±) Pe r-cent MOE 2 (±) Pe r-cent MOE 2 (±) Pe r-cent MOE 2 (±) Pe r-cent MOE 2 (±) Pe r-cent MOE 2 (±) Pe r-cent MOE 2 (±) Total . . . . . 313,443 316,168 86 .8 0 . 4 89 .6 0 . 2 *2 .8 64 .3 0 . 6 66 .0 0 . 4 *1 .7 35 .0 0 . 5 36 .5 0 . 3 *1 .6 13 .2 0 . 4 10 .4 0 . 2 *–2 .8 Household Income
Less than $25,000
. . . . . 55,587 55,240 79 .1 1 . 0 83 .4 0 . 6 *4 .3 27 .2 1 . 1 30 .1 0 . 7 *2 .9 63 .4 1 . 1 65 .3 0 . 7 *1 .9 20 .9 1 . 0 16 .6 0 . 6 *–4 .3
$25,000 to $49,999
. . . . 67,048 67,355 81 .0 0 . 9 85 .9 0 . 4 *5 .0 49 .5 1 . 3 52 .7 0 . 8 *3 .1 46 .5 1 . 1 48 .6 0 . 7 *2 .1 19 .0 0 . 9 14 .1 0 . 4 *–5 .0
$50,000 to $74,999
. . . . 55,194 55,657 86 .7 0 . 9 89 .3 0 . 5 *2 .6 69 .7 1 . 2 70 .6 0 . 9 0 .9 31 .3 1 . 2 32 .8 0 . 7 *1 .6 13 .3 0 . 9 10 .7 0 . 5 *–2 .6
$75,000 to $99,999
. . . . 41,626 41,307 90 .3 1 . 0 92 .0 0 . 4 *1 .7 78 .7 1 . 7 79 .4 0 . 7 0 .7 24 .2 1 . 5 25 .3 0 . 7 1 .1 9 . 7 1 . 0 8 . 0 0 . 4 *–1 .7
$100,000 or more
. . . . . 93,988 96,609 93 .9 0 . 6 94 .7 0 . 3 *0 .8 87 .2 0 . 8 87 .4 0 . 4 0 . 2 16 .8 0 . 8 18 .5 0 . 5 *1 .7 6 . 1 0 . 6 5 . 3 0 . 3 *–0 .8 Income-to-P over ty Ratio . . . . . 313,096 315,804 86 .8 0 . 4 89 .6 0 . 2 *2 .8 64 .3 0 . 6 66 .0 0 . 4 *1 .7 34 .9 0 . 5 36 .5 0 . 3 *1 .6 13 .2 0 . 4 10 .4 0 . 2 *–2 .8 Belo
w 100 percent of
po ver ty . . . . . 46,269 46,657 76 .5 1 . 1 80 .7 0 . 7 *4 .2 23 .1 1 . 1 26 .8 0 . 7 *3 .7 60 .0 1 . 4 61 .3 0 . 8 1 .3 23 .5 1 . 1 19 .3 0 . 7 *–4 .2 Belo
w 138 percent of
po ver ty . . . . . 68,324 68,885 77 .4 0 . 9 81 .9 0 . 5 *4 .5 26 .9 1 . 0 30 .5 0 . 7 *3 .6 59 .1 1 . 1 60 .5 0 . 7 *1 .4 22 .6 0 . 9 18 .1 0 . 5 *–4 .5 Betw
een 100 and 199
percent of po
ver ty . . . . 58,768 58,686 79 .6 0 . 9 84 .9 0 . 5 *5 .3 43 .2 1 . 2 46 .5 0 . 8 *3 .2 49 .6 1 . 1 52 .2 0 . 7 *2 .6 20 .4 0 . 9 15 .1 0 . 5 *–5 .3 Betw
een 200 and 299
percent of po
ver ty . . . . 49,575 51,451 84 .2 1 . 1 88 .3 0 . 4 *4 .2 64 .5 1 . 4 67 .3 0 . 8 *2 .9 33 .2 1 . 2 35 .9 0 . 7 *2 .7 15 .8 1 . 1 11 .7 0 . 4 *–4 .2 Betw
een 300 and 399
percent of po
ver ty . . . . 40,815 40,822 89 .7 0 . 9 91 .6 0 . 5 *1 .9 76 .2 1 . 4 77 .2 0 . 8 1 . 0 27 .4 1 . 3 28 .0 0 . 8 0 .5 10 .3 0 . 9 8 . 4 0 . 5 *–1 .9
At or abo
ve 400 percent
of po ver ty . . . . . 117,669 118,187 94 .4 0 . 4 95 .2 0 . 2 *0 .8 86 .8 0 . 6 86 .8 0 . 4 Z 21 .0 0 . 7 22 .1 0 . 4 *1 .1 5 . 6 0 . 4 4 . 8 0 . 2 *–0 .8
* Changes betw
een the 2013 and 2014 estimates are statistically diff
erent from z
ero at the 90 percent confidence le
vel
.
Z Represents or rounds to z
ero
.
1 Details ma
y not sum to totals because of rounding
.
2 A margin of error (MOE) is a measure of an estimate’
s v
ar
iability
. The larger the MOE in relation to the siz
e of the estimate
, the less reliab
le the estimate
. This n
umber
, when added to and subtr
acted from the estimate
, f
or
ms the 90 percent confidence
inter
val
. Margins of error sho
wn in this tab
le are based on standard errors calculated using replicate w
eights
. F
or more inf
or
mation, see
“Standard Errors and
Their Use” at <www2 .census .go v/libr ar y/pub lications/2015/demo/p60-253sa .pdf> .
3 Pr
iv
ate health insur
ance includes co
ver
age pro
vided through an emplo
yer or union, co
ver
age purchased directly b
y an individual from an insur
ance compan
y, or co
ver
age through someone outside the household
.
4 Go
ver
nment health insur
ance co
ver
age includes Medicaid, Medicare
, TRICARE, CHAMPV
A (Civilian Health and Medical Prog
ram of the Depar
tment of
V
eter
ans Aff
airs), and care pro
vided b
y the Depar
tment of
V
eter
ans Aff
airs and the militar
y .
5 Individuals are considered to be uninsured if the
y do not ha
ve health insur
ance co
ver
age f
or the entire calendar y
ear
.
Note:
The 2014 CPS ASEC included redesigned questions f
or income and health insur
ance co
ver
age
. All of the appro
ximately 98,000 addresses w
ere eligib
le to receiv
e the redesigned set of health insur
ance co
ver
age questions
. The redesigned income
questions w
ere implemented to a subsample of these 98,000 addresses using a probability split panel design
. Appro
ximately 68,000 addresses w
ere eligib
le to receiv
e a set of income questions similar to those used in the 2013 CPS ASEC and the remaining
30,000 addresses w
ere eligib
le to receiv
e the redesigned income questions
. The source of data f
or this tab
le is the por
tion of the CPS ASEC sample which receiv
ed the redesigned income questions
, appro
ximately 30,000 addresses
.
The estimates b
y type of co
ver age are not m utually e xclusiv e;
people can be co
vered b
y more than one type of health insur
ance dur
ing the y
ear
.
Source:
U
.S
. Census Bureau, Current P
opulation Sur
ve
y, 2014 and 2015 Ann
ual Social and Economic Supplements