SmartView Monitor
NG with Application Intelligence (R55)
For additional technical information about Check Point products, consult Check Point’s SecureKnowledge at:
http://support.checkpoint.com/kb/
See the latest version of this document in the User Center at:
http://www.checkpoint.com/support/technical/documents/ docs_r55.html
IMPORTANT
Check Point recommends that customers stay up-to-date with the latest service packs and versions of security products, as they contain security
enhancements and protection against new and changing attacks.
Part No.: 700728 January 2004
© 2003-2004 Check Point Software Technologies Ltd.
All rights reserved. This product and related documentation are protected by copyright and distributed under licensing restricting their use, copying, distribution, and decompilation. No part of this product or related documentation may be reproduced in any form or by any means without prior written authorization of Check Point. While every precaution has been taken in the preparation of this book, Check Point assumes no responsibility for errors or omissions. This publication and features described herein are subject to change without notice.
RESTRICTED RIGHTS LEGEND:
Use, duplication, or disclosure by the government is subject to restrictions as set forth in subparagraph (c)(1)(ii) of the Rights in Technical Data and Computer Software clause at DFARS 252.227-7013 and FAR 52.227-19.
TRADEMARKS:
Check Point, the Check Point logo, ClusterXL, ConnectControl, FireWall-1, FireWall-1 GX, FireWall-1 SecureServer, FireWall-1 SmallOffice, FireWall-1 VSX, FireWall-1 XL, FloodGate-1, INSPECT, INSPECT XL, IQ Engine, MultiGate, Open Security Extension, OPSEC, Provider-1, SecureKnowledge, SecurePlatform, SecureXL, SiteManager-1, SmartCenter, SmartCenter Pro, SmartDashboard, SmartDefense, SmartLSM, SmartMap, SmartUpdate, SmartView, SmartView Monitor, SmartView Reporter, SmartView Status, SmartView Tracker, SmartConsole, TurboCard, Application Intelligence, SVN, UAM, User-to-Address Mapping, UserAuthority, VPN-1, VPN-1 Accelerator Card, VPN-1 Net, VPN-1 Pro, VPN-1 SecureClient, VPN-1 SecuRemote, VPN-1 SecureServer, VPN-1 SmallOffice and VPN-1 VSX are trademarks or registered trademarks of Check Point Software Technologies Ltd. or its affiliates. All other product names mentioned herein are trademarks or registered trademarks of their respective owners.
The products described in this document are protected by U.S. Patent No. 6,496,935, 5,606,668, 5,699,431 and 5,835,726 and may be protected by other U.S. Patents, foreign patents, or pending applications.
THIRD PARTIES:
Entrust is a registered trademark of Entrust Technologies, Inc. in the United States and other countries. Entrust’s logos and Entrust product and service names are also trademarks of Entrust Technologies, Inc. Entrust Technologies Limited is a wholly owned subsidiary of Entrust Technologies, Inc. FireWall-1 and SecuRemote incorporate certificate management technology from Entrust.
Verisign is a trademark of Verisign Inc.
The following statements refer to those portions of the software copyrighted by University of Michigan. Portions of the software copyright © 1992-1996 Regents of the University of Michigan. All rights reserved. Redistribution and use in source and binary forms are permitted provided that this notice is preserved and that due credit is given to the University of Michigan at Ann Arbor. The name of the University may not be used to endorse or promote products derived from this software without specific prior written permission. This software is provided “as is” without express or implied warranty. Copyright © Sax Software (terminal emulation only).
The following statements refer to those portions of the software copyrighted by Carnegie Mellon University.
Copyright 1997 by Carnegie Mellon University. All Rights Reserved.
Permission to use, copy, modify, and distribute this software and its documentation for any purpose and without fee is hereby granted, provided that the above copyright notice appear in all copies and that both that copyright notice and this permission notice appear in supporting documentation, and that the name of CMU not be used in advertising or publicity pertaining to distribution of the software without specific, written prior permission.CMU DISCLAIMS ALL WARRANTIES WITH REGARD TO THIS SOFTWARE, INCLUDING ALL IMPLIED WARRANTIES OF MERCHANTABILITY AND FITNESS, IN NO EVENT SHALL CMU BE LIABLE FOR ANY SPECIAL, INDIRECT OR CONSEQUENTIAL DAMAGES OR ANY DAMAGES WHATSOEVER RESULTING FROM LOSS OF USE, DATA OR PROFITS, WHETHER IN AN ACTION OF CONTRACT, NEGLIGENCE OR OTHER TORTIOUS ACTION, ARISING OUT OF OR IN CONNECTION WITH THE USE OR PERFORMANCE OF THIS SOFTWARE.
The following statements refer to those portions of the software copyrighted by The Open Group.
THE SOFTWARE IS PROVIDED "AS IS", WITHOUT WARRANTY OF ANY KIND, EXPRESS OR IMPLIED, INCLUDING BUT NOT LIMITED TO THE WARRANTIES OF MERCHANTABILITY, FITNESS FOR A PARTICULAR PURPOSE AND
NONINFRINGEMENT. IN NO EVENT SHALL THE OPEN GROUP BE LIABLE FOR ANY
CLAIM, DAMAGES OR OTHER LIABILITY, WHETHER IN AN ACTION OF CONTRACT, TORT OR OTHERWISE, ARISING FROM, OUT OF OR IN CONNECTION WITH THE SOFTWARE OR THE USE OR OTHER DEALINGS IN THE SOFTWARE.
The following statements refer to those portions of the software copyrighted by The OpenSSL Project. This product includes software developed by the OpenSSL Project for use in the OpenSSL Toolkit (http://www.openssl.org/).* THIS SOFTWARE IS PROVIDED BY THE OpenSSL PROJECT ``AS IS'' AND ANY * EXPRESSED OR IMPLIED WARRANTIES, INCLUDING, BUT NOT LIMITED TO, THE IMPLIED WARRANTIES OF
MERCHANTABILITY AND FITNESS FOR A PARTICULAR PURPOSE ARE DISCLAIMED. IN NO EVENT SHALL THE OpenSSL PROJECT OR ITS CONTRIBUTORS BE LIABLE FOR ANY DIRECT, INDIRECT, INCIDENTAL, SPECIAL, EXEMPLARY, OR
CONSEQUENTIAL DAMAGES (INCLUDING, BUT NOT LIMITED TO, PROCUREMENT OF SUBSTITUTE GOODS OR SERVICES; LOSS OF USE, DATA, OR PROFITS; OR BUSINESS INTERRUPTION) HOWEVER CAUSED AND ON ANY THEORY OF LIABILITY, WHETHER IN CONTRACT, STRICT LIABILITY, OR TORT (INCLUDING NEGLIGENCE OR OTHERWISE) ARISING IN ANY WAY OUT OF THE USE OF THIS SOFTWARE, EVEN IF ADVISED OF THE POSSIBILITY OF SUCH DAMAGE.
The following statements refer to those portions of the software copyrighted by Eric Young. THIS SOFTWARE IS PROVIDED BY ERIC YOUNG ``AS IS'' AND ANY EXPRESS OR IMPLIED WARRANTIES, INCLUDING, BUT NOT LIMITED TO, THE IMPLIED WARRANTIES OF MERCHANTABILITY AND FITNESS FOR A PARTICULAR PURPOSE ARE DISCLAIMED. IN NO EVENT SHALL THE AUTHOR OR CONTRIBUTORS BE LIABLE FOR ANY DIRECT, INDIRECT, INCIDENTAL, SPECIAL, EXEMPLARY, OR
CONSEQUENTIAL DAMAGES (INCLUDING, BUT NOT LIMITED TO, PROCUREMENT OF SUBSTITUTE GOODS OR SERVICES; LOSS OF USE, DATA, OR PROFITS; OR BUSINESS INTERRUPTION) HOWEVER CAUSED AND ON ANY THEORY OF LIABILITY, WHETHER IN CONTRACT, STRICT LIABILITY, OR TORT (INCLUDING NEGLIGENCE OR OTHERWISE) ARISING IN ANY WAY OUT OF THE USE OF THIS SOFTWARE, EVEN IF ADVISED OF THE POSSIBILITY OF SUCH DAMAGE. Copyright © 1998 The Open
Group.
The following statements refer to those portions of the software copyrighted by Jean-loup Gailly and Mark Adler Copyright (C) 1995-2002 Jean-loup Gailly and Mark Adler. This software is provided 'as-is', without any express or implied warranty. In no event will the authors be held liable for any damages arising from the use of this software. Permission is granted to anyone to use this software for any purpose, including commercial applications, and to alter it and redistribute it freely, subject to the following restrictions:
1. The origin of this software must not be misrepresented; you must not claim that you wrote the original software. If you use this software in a product, an acknowledgment in the product documentation would be appreciated but is not required.
2. Altered source versions must be plainly marked as such, and must not be misrepresented as being the original software.
3. This notice may not be removed or altered from any source distribution. The following statements refer to those portions of the software copyrighted by the Gnu Public License. This program is free software; you can redistribute it and/or modify it under the terms of the GNU General Public License as published by the Free Software Foundation; either version 2 of the License, or (at your option) any later version. This program is distributed in the hope that it will be useful, but WITHOUT ANY WARRANTY; without even the implied warranty of
MERCHANTABILITY or FITNESS FOR A PARTICULAR PURPOSE. See the GNU General Public License for more details.You should have received a copy of the GNU General Public License along with this program; if not, write to the Free Software Foundation, Inc., 675 Mass Ave, Cambridge, MA 02139, USA. The following statements refer to those portions of the software copyrighted by Thai Open Source Software Center Ltd and Clark Cooper Copyright (c) 2001, 2002 Expat maintainers. Permission is hereby granted, free of charge, to any person obtaining a copy of this software and associated documentation files (the "Software"), to deal in the Software without restriction, including without limitation the rights to use, copy, modify, merge, publish, distribute, sublicense, and/or sell copies of the Software, and to permit persons to whom the Software is furnished to do so, subject to the following conditions: The above copyright notice and this permission notice shall be included in all copies or substantial portions of the Software. THE SOFTWARE IS PROVIDED "AS IS", WITHOUT WARRANTY OF ANY KIND, EXPRESS OR IMPLIED, INCLUDING BUT NOT LIMITED TO THE WARRANTIES OF MERCHANTABILITY, FITNESS FOR A PARTICULAR PURPOSE AND NONINFRINGEMENT. IN NO EVENT SHALL THE AUTHORS OR COPYRIGHT HOLDERS BE LIABLE FOR ANY CLAIM, DAMAGES OR OTHER LIABILITY, WHETHER IN AN ACTION OF CONTRACT, TORT OR OTHERWISE, ARISING FROM, OUT OF OR IN CONNECTION WITH THE SOFTWARE OR THE USE OR OTHER DEALINGS IN THE SOFTWARE.
Table of Contents 3
Table Of Contents
Chapter 1
SmartView Monitor Overview
SmartView Monitor Technologies 7 Overview 7
SmartView Monitor Features 8
Installing Check Point SmartView Monitor 9
Chapter 2
SmartView Monitor Sessions
Starting SmartView Monitor Sessions 11
Certificate Management, Compression Optimization and Advanced Options 13 Defining a SmartView Monitor Session 14
Recording Monitoring Sessions 15 To record a monitoring session 15
To stop recording a monitoring session or a playing a previously recorded session 15 To play a previously recorded session 15
To fast play a previously recorded session 15 To pause playing 16
Viewing Monitored Information 16 Legend 16
Scaling 17
Viewing Previous Data 17 Enabling Graph Values Display 17
Interrupting the Monitoring Session Process 17 Change Data Display for Monitoring Sessions 18
Changing the display using other SmartConsole options 20
Chapter 3
Monitoring — Check Point System Counters
Overview 21
Monitoring Check Point System Counters 22 Session Properties Window — Counters Tab 23 Displaying Check Point System Counters Data 23
Example — Check Point System Counters 24
Chapter 4
Monitoring — Real-Time Traffic
Overview 25
Monitoring Services 26
Session Properties Window — Monitor by Services Tab 27 Monitoring Network Objects 28
Session Properties Window — Monitor by Network Objects Tab 29 Example — Services and Network Objects 30
Generating a Report 31 Conclusion 32
Monitoring by QoS Policy Rules 32
Session Properties Window — Monitor by QoS Rules Tab 33 Example — QoS Rules 34
Suspending QoS Policy 36 Monitoring by Top Security Rules 37
Session Properties Window — Monitor by Top Security Rules Tab 38 Example —Top Security Rules 38
Filtering Traffic 41
Chapter 5
Blocking Real-Time Traffic
Blocking Traffic 43
Suspicious Activity Rules 43
Managing Suspicious Activity Rules 45
Chapter 6
Virtual Link Monitoring (VLM)
Overview 47
Creating a Virtual Link 48
Editing or Deleting a Virtual Link 49
Virtual Link Properties Window — General Tab 50 Virtual Link Properties Window — SLA Parameters Tab 51 Global Properties Window — Log and Alert Page 52 Monitoring a Virtual Link 52
Session Properties Window — Virtual Link Monitoring Tab 54 Settings Tab — Virtual Link Monitoring 55
Displaying Virtual Link Monitoring Data 55 Virtual Link Monitoring Display 55 SmartView Tracker 57
Virtual Link Monitoring Example 57 Displaying Monitoring Data 62
Virtual Link Monitoring 63
Chapter 7
Report Mode
Overview 65 Configuration 65
Report Mode — Check Point System Counters 66 Session Properties Window — Counters Tab 67 Displaying Reports — Check Point System Counters 68 Report Mode — Traffic 68
Session Properties Window — Traffic History Tab 69 Displaying Reports — Traffic 69
Chapter 8
Graphical User Interface
Check Point SmartView Options 71 File Options 71
Table of Contents 5
Session Options 72 Recording Options 74 View Options 74 Window Options 75 Help Options 76
SmartView Monitor Toolbars 77 Standard Toolbar 77
SmartView Monitor Status Bar 78
7 C H A P T E R
1
SmartView Monitor
Overview
In This Chapter
SmartView Monitor Technologies
Overview
Check Point SmartView Monitor is an easy-to-use monitoring tool that allows you to inspect network traffic and connectivity. In addition, it provides real-time information about the performance and security state of both FireWall-1 and VPN-1 operations. As an administrator you have to ensure high network availability, efficient bandwidth usage and data integrity. If your network experiences problems such as sluggishness, loss of data or security related problems, you need to be able to immediately identify changes in the network traffic flow patterns or security activities. You need to find out the cause of these problems, when and why they occur, and fix them. An enterprise
implementing its data network on the Internet must monitor connectivity to ensure high network availability and efficient bandwidth usage. Check Point SmartView Monitor User Guide provides network administrators with the tools they need to monitor traffic and identify bottlenecks as they occur.
Many Internet Service Providers (ISPs) contractually commit to a Service Level Agreement (SLA) under which they undertake to provide a guaranteed level of service, usually defined in terms of network delay, CIR (Committed Information Rate), percentage of dropped packets etc.
SmartView Monitor Technologies page 7
SmartView Monitor Technologies
SmartView Monitor provides network administrators with the following tools. 1) Analysis capabilities
• Diagnose network, security and performance problems.
• Inspect various Check Point products such as FireWall-1,VPN-1, FloodGate-1.
• Target specific network activities for monitoring.
• Get information about services that are being used, servers and clients that are being accessed and by whom.
• Inspect bandwidth and get hardware indicators such as CPU usage, used memory, etc.
2) Management and control capabilities
• Assume instant control of traffic flow on a Gateway.
• Block a specific traffic when a threat is imposed.
• Track Service Level between two Gateways, and receive alarms when the Service Level agreement (SLA) is violated.
• Recall past activities, create reports and record monitored activities.
SmartView Monitor Features
Check Point System Counters
Check Point System Counters collect information about the status, activities, hardware and software usage of different Check Point products in real-time mode. You can use System Counters to plot graphs and to view reports of current or archived data collected by Counter Logs. For example, if you want to focus on VPN tracking, you can use System Counters to ascertain how many tunnels are currently open.
Traffic Flow Through a Single / All Interfaces of a Gateway Traffic flow can be monitored per service or network object. In addition, SmartView Monitor enables monitoring based on a variety of parameters, for example the QoS Policy rules installed on an interface, or the top Security Rules set for an interface, or the SL (Service Level) of an end-to-end link, between two Check Point VPN-1 Pro or FloodGate-1 Modules. In addition, the degree of compliance to a Service Level Agreement (SLA) can be monitored on the Virtual Link, and alerts can be generated in the event that there are SLA violations. For information on how to use traffic
SmartView Monitor Features
Chapter 1 SmartView Monitor Overview 9 Virtual Link Monitoring
Monitor traffic between two Check Point VPN-1 Pro modules or two FloodGate-1 Modules for real time analysis of bandwidth and latency. Virtual Link Monitoring can track compliance with a Service Level Agreement (SLA). SmartView Monitor has to be installed on the module in order to enable traffic monitoring and in order to support the process by which reports are generated. It is not required for running Counters. For more information, see “Report Mode” on page 65.
Blocking Suspicious Connections
Suspicious Activity rules are security rules, which once set can be applied immediately without the need to perform the "Install Policy" action. These rules enable the system administrator to instantly block suspicious connections that are not restricted by the currently enforced Security Policy.
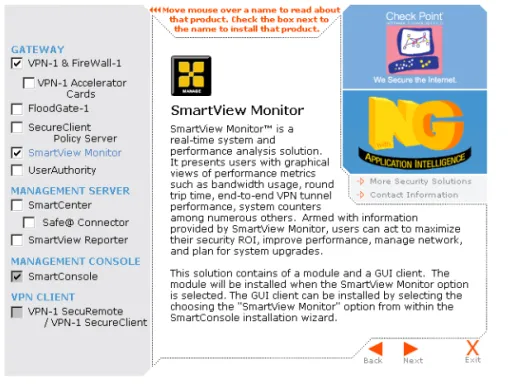
Installing Check Point SmartView Monitor
To install a Check Point SmartView Monitor Module from the Check Point installation CD (see Check Point Getting Started Guide), select SmartView Monitor in the
Server/Gateway Components window (FIGURE 1-1).
Installing Check Point SmartView Monitor
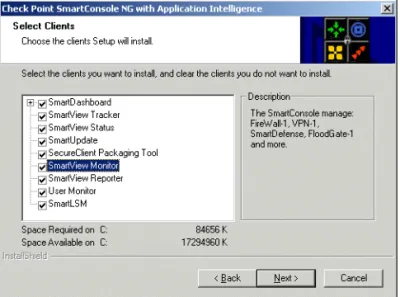
To install a SmartView Monitor SmartConsole, select SmartConsole Clients in the
Server/Gateway Components window. Then select SmartView Monitor in the Check Point SmartConsole window (FIGURE 1-2).
11 C H A P T E R
2
SmartView Monitor
Sessions
In This Chapter
Starting SmartView Monitor Sessions
To start SmartView Monitor, do one of the following:
• Double-click the SmartView Monitor icon.
• Choose SmartView Monitor from the Window menu in the SmartDashboard window. The SmartView Monitor Login window (FIGURE 2-1) is displayed.
Starting SmartView Monitor Sessions page 11 Defining a SmartView Monitor Session page 11
Recording Monitoring Sessions page 16
Viewing Monitored Information page 16
Interrupting the Monitoring Session Process page 17 Change Data Display for Monitoring Sessions page 18
Starting SmartView Monitor Sessions
FIGURE 2-1 SmartView Monitor Login window
You can log in using either your:
• User name and password:
1 Select User Name.
2 Enter your user name and password.
3 Click OK.
• Certificate:
1 Select Certificate.
2 Enter the name of your PKCS#12 certificate file. You can browse for the file using by clicking .
3 Enter the password you used to create the certificate.
4 ClickOK.
Enter the name of the machine on which the SmartCenter Server is running. You can enter one of the following:
• A resolvable machine name.
• A dotted IP address.
To work in local mode, check Demo Mode.
If you do not wish to modify a policy, check Read Only before clicking on OK.
Note - If you are not defined as a user, and therefore do not possess a user name, see “To Add an Administrator” on page 49, for information how to define users on the
Certificate Management, Compression Optimization and Advanced Options
Chapter 2 SmartView Monitor Sessions 13
Certificate Management, Compression Optimization and
Advanced Options
In the SmartView Monitor Login window (FIGURE 2-1), click More Options >> to display the Certificate Management, Connection Optimizations and Advanced options (FIGURE 2-2).
FIGURE 2-2 SmartView Monitor login window — More Options
To change the certificate password, click Change Password.
To compress the connection to the SmartCenter Server, check Use compressed connection.
Enter the text describing why the administrator wants to make a change in the security policy in Session ID (optional). The text appears as a log entry in the SmartView Tracker in the Session ID column (in Audit mode only). If the Session ID column does not appear in the SmartView Tracker, use the Query Properties pane to display it. For more information on the SmartView Tracker, see the chapter called SmartView Tracker in the Check Point SmartCenter Guide.
To hide the Certificate Management, Connection Optimizations and Advanced options, click Less Options <<.
Defining a SmartView Monitor Session
Defining a SmartView Monitor Session
The Session Pane provides an easy-to-use interface for performing the following actions:
• Configuring new monitoring sessions.
• Running pre-defined (already-configured) sessions.
• Managing sessions, for instance renaming, deleting or modifying sessions. You can also copy and paste Custom or Predefined sessions into the custom sessions tree. The properties of a monitoring session are defined in the Session Properties window. While monitoring, you can open the Session Properties window for a new monitoring session by choosing New from the File menu.
New or modified sessions are marked by an asterisk (*). This mark remains till the configuration is saved. If you exit SmartView Monitor without saving your new configuration, you will be prompted to save it. To save your new configuration, select the session name from a displayed list of sessions.
In addition to modifying a configuration through the Session pane, you can modify a specific session by right click on the session view. You can also configure custom sessions.
Predefined Sessions
These are already-configured sessions that enable you to monitor different aspects of network activities. This is done by the following easy two steps:
1 Double click on the Predefined Sessions. A list of modules and their interfaces is displayed.
2 Select the module or interface you wish to monitor. The View window displays the session parameters. No further configuration is required.
This feature also provides an efficient and quicker way for configuring new sessions. This is achieved by modifying a predefined session and copy the modified session's settings into a new created custom session.
The followings are some of the different predefined sessions variables for monitoring a selected module or interface:
• Top Destinations - the top active destination servers.
• Top Matched Security rules - the most used Security Rules.
• Top Services - the top active services.
• Top Sources - the top active clients.
To record a monitoring session
Chapter 2 SmartView Monitor Sessions 15 Run a Sessions
To run either a custom or predefined session double click the session.
Recording Monitoring Sessions
It is possible to make instantaneous live recording sessions.
To record a monitoring session
1) Click in the toolbar, or select Record from the Recording menu. The Save As
window appears.
2) Specify the name and location of the recording session. The default file name for the recording session consists of the monitoring session configuration name (see “Defining a SmartView Monitor Session” on page 14), the current date and the current time. The default location is the MonitorData directory which is found
under the directory in which the Check Point SmartConsole Clients are located. 3) Click Save to begin recording. The word Recording appears in the top-right corner
of the window.
To stop recording a monitoring session or a playing a
previously recorded session
Click in the toolbar, or select Stop from the Recording menu.
To play a previously recorded session
1) Click in the toolbar, or select Play from the Recording menu. The Select Recorded window appears.
2) Select the desired file and click Open. The word Playing appears in the top-right corner of the window.
To fast play a previously recorded session
1) Click in the toolbar, or select Fast Play from the Recording menu. The Select Recorded window appears.
2) Select the desired file and click Open. The word Fast Playing appears in the top-right corner of the window.
Viewing Monitored Information
To pause playing
1) Click in the toolbar, or select Pause from the Recording menu. The word
Pausing appears in the top-right corner of the window.
2) To resume playing, click in the toolbar, or select Play from the Recording
menu.
Viewing Monitored Information
The Pane in which the monitored information is displayed, consists of either a line graph or a bar chart, depending on whether or was selected respectively. Each monitor has a significant title which explains what is being monitored. Below this heading, In Real-time mode there is a clock which displays the current time, during which the information is being monitored.
Legend
Below the monitor is a new enhanced Legends view. This view consists of a table. This table classifies all significant information appearing in the monitor according to:
• Color — the color which represents the object in the monitor
• Counter Name — the name of the object being monitored
• Current — the current number of the option being passed
• Av erage — the average number of the option usually generated
• Maximum — the maximum number of the option that has been generated thus far
• Minimum — the minimum number of the option that has been generated thus far
• Y-Scale, Units — length, units of Y-Scale When tracking Services and Network Objects:
• If you select to monitor specific Services or Network Objects, the Aggregate Data, that is the total amount of Services and Network Objects traffic in the system will be displayed.
• If you select to monitor top Services or Network Objects you can capture the current objects displayed in the monitor, by clicking the Lock icon . This icon ensures that the currently displayed top objects will continue to be monitored, and the monitor will not be constantly updating with new objects as they are being updated.
Scaling
Chapter 2 SmartView Monitor Sessions 17
Scaling
Use the scaling option to provide an enhanced view of the monitored information. The current scaling range appears on the vertical axis of the display graph itself, or in the Scaling toolbar.
You can enter new upper and lower limits in the Scaling toolbar text boxes. To optimize scaling, click in the Scaling toolbar.
If you wish to return to the default scaling setting, open the Settings tab of the Session Properties window and reselect Set to automatic scaling.
Viewing Previous Data
If you have chosen to view a line chart, you can use the horizontal scroll bar to view previous monitoring data.
When you move the scrollbar to the left, the chart will return to the time period defined by the scrollbar position. The data in the chart will be static, but monitoring will continue.
To return to the current time, move the scrollbar back to the right.
Enabling Graph Values Display
When graph values are enabled, you can click on a line or bar in the display graph and see the exact value of the corresponding monitoring data.
To select a bar or line graph, select Chart Type from the View menu.
Interrupting the Monitoring Session Process
Monitoring can be interrupted and resumed at any time by selecting Freeze Viewfrom theViewmenu, or by clicking in the SmartView Monitor toolbar.
After an interruption, monitoring will resume at current values. Changes that occurred during the interruption will not be displayed.
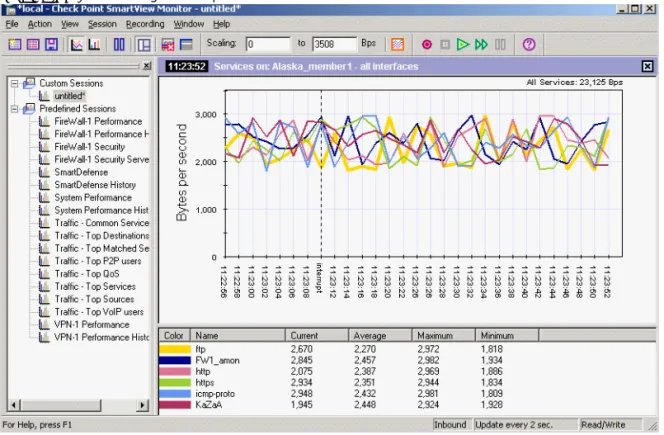
In line graphs, the interrupted time range will be indicated by a dotted black line and the word Interrupt (FIGURE 2-3).
Change Data Display for Monitoring Sessions
FIGURE 2-3 Monitoring Interruption
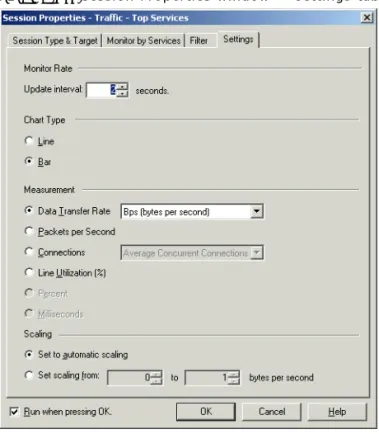
Change Data Display for Monitoring Sessions
You can change the way traffic statistics are displayed at any time during a monitoring session by choosing Properties from the Session menu, or by clicking in the SmartView Monitor toolbar. In the Settings tab of the Session Properties window you can modify the display settings.
Enabling Graph Values Display
Chapter 2 SmartView Monitor Sessions 19 Change the Display — Settings Tab
FIGURE 2-4 Session Properties window — Settings tab
Chart Type — Select Line or Bar.
Measurement — Select one of the following measurement options:
• Data Transfer Rate — If you choose to monitor data transfer rate, select a unit of measurement from the Units drop down menu.
• Packets per second • Line Utilization (%)
• Percent
• Milliseconds
Scaling — Select one of the following:
Change Data Display for Monitoring Sessions
• Set scaling from... to... — Specify the upper and lower limits of the scaling range in the appropriate text boxes. Measurement units depend on the option selected in the
Measurement field.
Monitor Rate — Specify the rate at which the display will be updated.
Update interval...seconds — Click the appropriate arrow to increase or decrease the number of seconds between updates.
Changing the display using other SmartConsole options
The following menu items and toolbar buttons also allow you to change the graph display:.Note - You can change setup parameters during a session by choosing Properties from the Sessions menu.
TABLE 2-1 Toolbar Buttons and Menu Options
Toolbar Button
Menu Option
View > Chart Type > Line Graph
View > Chart Type > Bar Graph
Action > Suspend QoS Policy
View > Optimize Scaling
21 C H A P T E R
3
Monitoring — Check
Point System Counters
In This Chapter
Overview
Check Point SmartView Monitor allows you to monitor Check Point System Counters. Check Point System Counters are collectors of information about the status, activities, hardware and software usage of different Check Point products in real-time. You can use System Counters to design graphs and to view reports of current or archived data collected by Counter Logs. For instance, for VPN, you can ascertain how many tunnels are currently open.
Overview page 21
Monitoring Check Point System Counters page 22 Displaying Check Point System Counters Data page 23
Monitoring Check Point System Counters
Monitoring Check Point System Counters
FIGURE 3-1 Session Properties window — Session Type tab (Check Point System Counters)
To set up SmartView Monitor for monitoring a Check Point System Counter:
1 Select Real Time in the Mode drop-down menu of the Session Type & Target tab of the Session Properties window.
2 Select Check Point System Counters.
3 Select a module under Select monitored Module/Interface. Only one module can be monitored at any given time.
4 In the Counters tab select the Counters to display.
For information about the fields in the Counters tab, see “Session Properties Window — Counters Tab” on page 23.
5 In the Settings tab, specify the display parameters for the session.
For information about the fields in the Settings tab, see “Change the Display — Settings Tab” on page 19.
When the Counters parameters have been set up, you can begin the monitoring display (see “Displaying Check Point System Counters Data” on page 23).
Session Properties Window — Counters Tab
Chapter 3 Monitoring — Check Point System Counters 23
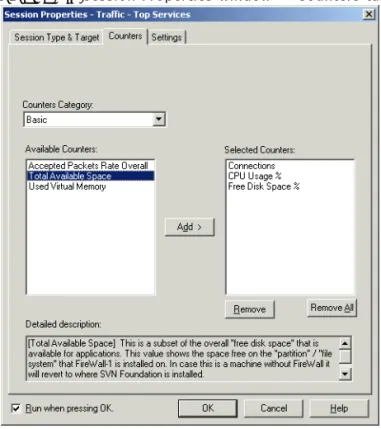
Session Properties Window — Counters Tab
FIGURE 3-2 Session Properties window — Counters tabCounters Category — select a category:
The Available Counters box lists currently defined counters. To add an object, select it in the Available box and click on Add.
To remove an object, select it in the Selected Counters box, and click on Remove.
Detailed description — view a detailed description about the selected category.
Displaying Check Point System Counters Data
After you define monitoring parameters in the tabs of the Session Properties window, click OK to view monitoring data.
Displaying Check Point System Counters Data
Example — Check Point System Counters
Generating a Real Time Session
It is the start of the working day, the whole of the Marketing and Sales department of company ABCD are attending a conference away from the office and they need to connect remotely using SecuRemote/SecureClient. Much to their dismay they are unable to connect to the network and to start working. Kate is told to generate a Report immediately in order to see what is holding the system back.
Kate decides to make report for several Check Point System Counters that have been in use on the Remote_Gateway module over the past hour. In SmartConsole:
• She opens a new session, by selecting Session > New
• In the Session Type & Target tab, she chooses the Real-Time Mode and she makes sure that Check Point System Counter is selected.
• In the Counters tab, she chooses the following Counters Categories:
• VPN Tunnels — IKE Failures Rate, IKE Successes Rate, IKE Concurrent, Active Tunnels.
• OS CPU — Cpu Usage %.
• OS MEMORY — Total Physical Memory.
• She clicks on OK, and the monitor is displayed. In the graph, Kate right-clicks on the Y-axis and selects Modify Y Xcale. She adjusts the value of the Y scale so that the selected field is emphasized and Kate can examine it more clearly.
• Conclusions: the SmartView Monitor indicates that there are more failures than successes, therefore, the system administrator understands that the company ABCD
cannot accommodate all the employees attempting to log on at once. Once the system administrator has used SmartView Monitor in order to discover the problem, she can now concentrate on finding a solution!
25 C H A P T E R
4
Monitoring — Real-Time
Traffic
In This Chapter
Overview
SmartView Monitor allows you to monitor the traffic that flows through a single interface. You can choose to monitor:
• The traffic that flows through a single interface of by service.
• For information see “Monitoring Services” on page 26.
• The traffic that flows through a single interface by network object.
• For information see “Monitoring Network Objects” on page 28.
• By QoS Rules, based on the QoS Policy installed on a Check Point FloodGate-1 Module.
• For information on Monitoring by QoS Rules, see “Monitoring by QoS Policy Rules” on page 32.
• By top Security Rules.
• For information on Monitoring by top Security Rules, see “Monitoring by Top Security Rules” on page 37.
Overview page 25
Monitoring Services page 26
Monitoring Network Objects page 28
Monitoring by QoS Policy Rules page 32
Monitoring by Top Security Rules page 37
Monitoring Services
Monitoring Services
FIGURE 4-1 Session Properties window — Session Type & Target tab (Services)
To set up SmartView Monitor for monitoring an interface:
1 Select Real Time Mode in the Session Type & Target tab of the Session Properties
window.
2 Select Services in the Traffic by section in the Session Type & Target tab of the
Session Properties window.
3 Select an interface under Select Monitored Module/Interface. Only one interface can be monitored at any given time.
4 In the Monitor by Services tab, select the services to display.
For information about the fields in the Monitor by Services tab, see “Session Properties Window — Monitor by Services Tab” on page 27.
5 In the View Settings tab specify the display parameters for the session.
For information about the fields in the View Settings tab, see “Change the Display — Settings Tab” on page 19.
Session Properties Window — Monitor by Services Tab
Chapter 4 Monitoring — Real-Time Traffic 27 When the interface monitoring parameters have been set up, you can begin the monitoring display (see “Monitoring Services” on page 26).
Session Properties Window — Monitor by Services Tab
FIGURE 4-2 Session Properties window — Monitor by Services tabServices — select one of the following:
• Top Services — display the top services in use.
• Specific Services — select specific services to be displayed:
• The Available box lists currently defined services.
• To add an object, select it in the Available box and click on Add.
• To remove an object, select it in the Selected box, and click on Remove.
Data Direction — Choose the direction of monitored traffic. Select one of the following:
• Eitherbound — traffic passing through the specified interface in either direction.
• Outbound — traffic exiting the gateway through the specified interface.
Monitoring Network Objects
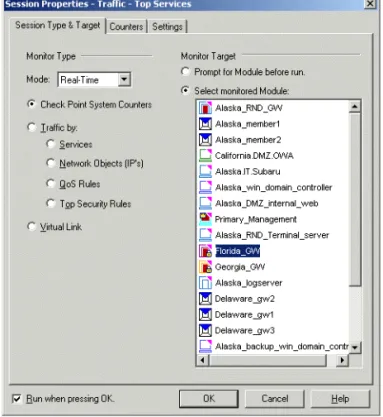
Monitoring Network Objects
FIGURE 4-3 Session Properties window — Session Type & Target tab [Network Objects (IPs)]
To set up SmartView Monitor for monitoring an interface:
1 Select Real Time Mode in the Session Type & Target tab of the Session Properties
window.
2 Select Network Objects (IP) in Traffic by under the Monitor section in the Session Type & Target tab of the Session Properties window.
3 Select an interface under Select Monitored Module/Interface. Only one interface can be monitored at any given time.
4 In the Monitor by Network Objects tab, select the network objects to display. For information about the fields in the Monitor by Network Objects tab, see “Session Properties Window — Monitor by Network Objects Tab” on page 29.
5 In the Settings tab, specify the display parameters for the session.
For information about the fields in the Settings tab, see “Change the Display — Settings Tab” on page 19.
Session Properties Window — Monitor by Network Objects Tab
Chapter 4 Monitoring — Real-Time Traffic 29 When the interface monitoring parameters have been set up, you can begin the monitoring display (see “Monitoring Network Objects” on page 28).
Session Properties Window — Monitor by Network Objects
Tab
FIGURE 4-4 Session Properties window — Monitor by Network Objects tab
Network Objects — select one of the following.
Top Network Objects —display the top network objects in use.
Specific Network Objects —s elect specific network objects to be displayed. The Available box lists currently defined network objects.
To add an object, select it in the Available box and click on Add. To remove an object, select it in the Selected box, and click on Remove.
Data Direction — Choose the direction of monitored traffic. Select one of the following:
• Eitherbound — traffic passing through the specified interface in either direction.
• Outbound — traffic exiting the gateway through the specified interface.
Example — Services and Network Objects
Data Origin — check one of the following:
• Source — Display connections if the source is any of the selected network objects.
• Destination — Display connections if the destination is any of the selected network objects.
• Source or Destination — Display connections if the source or destination is one of the selected network objects.
If you check both Source and Destination, connections will be displayed if either their source or destination is any of the selected network objects.
Example — Services and Network Objects
Generating a Real-Time Session
The Help Desk in a company called ABCD gets many complaints that Internet access is slow and sluggish. A junior administrator called Kate is told to determine what is slowing down the system. She opens a SmartView Monitor, so that she can create a traffic report for the Company_Gateway interface.
• In SmartView Monitor she opens a new session, by selecting Session > New • In the Session Type & Target tab, she chooses the Real-Time Session Mode and she
makes sure that Traffic by > Services is selected. She choose to monitor the
Company_Gateway module monitored.
• In the Monitor by Services tab, she chooses to select KaZaA and H323 from the
Specific Services listbox, since she knows that these are services that often impede the smooth running of the system. She decides to monitor this traffic in both direction, therefore she selects eitherbound.
• In the Settings tab, she set the Chart Type as Line in order that she can see the interaction of the two Services. She selects the Measurement as the Data transfer Rate in BPs, and she click on OK.
• When the monitor is displayed, Kate sees that in real-time the rate of KaZaA and H323 traffic is heightened.
• Whenever specific services or network objects are displayed, the Legend displays the Aggregate system information as well, this is the total amount of Network Objects and Services traffic in the system at the present time. Since Kate has no current use for this Aggregate information, she selects it in the Legend and deletes it.
Kate decides to check the most prominent users.
Generating a Report
Chapter 4 Monitoring — Real-Time Traffic 31
• Kate examines the list of ten top H323 service users and may decide to record the behavior of the aggressive users so that she can show it to her Manager at the first opportunity.
Generating a Report
For the purpose of comparison, Kate wants to make sure that the level of H323 and KaZaA that have been identified in the Check Point SmartView Monitor User Guide are indeed higher than usual, so she decides to make a traffic report for the same services from the previous week. She opens the SmartView Monitor, so that she can create a traffic reports for the Company_Gateway interface.
Kate decides that she want to make a traffic report on the Services that have been in use over the past hour on the Company_Gateway module, so in her SmartConsole she proceeds as follows
• She opens a new session, by selecting Session > New.
• In the Session Type & Target tab, she chooses the History Report Mode and she makes sure that Traffic is selected. She choose the module for which she wishes to examine the traffic (Company_Gateway).
• In the Traffic History tab, she chooses to create a Report from the Time Frame of the Last week. In the Select Throughput Report listbox she selects the Top Services
report. She clicks on OK, and the report is displayed.
• From the monitor, Kate sees that the top Services in use are HTTP, KaZaA and H323. She notices that the average number of HTTP and H323 from the previous week are not as high as the levels being generated in real-time. She considers this fact for a moment, and then moves on.
Kate continues by making a similar traffic report for the Network Objects that have been in use on the Company_Gateway module over the last week. So she opens a second SmartConsole and she proceeds as follows:
• She opens a new session, by selecting Session > New
• In the Session Type & Target tab, she chooses the History Report Mode and she makes sure that Traffic is selected. She makes sure that she selects the same module that she selected for the Services Report (Company_Gateway).
• In the Traffic History tab, she chooses to create a Report from the Time Frame from the Last Hour. In the Select Throughput Report listbox she selects the top network objects report. She clicks on OK, and the report is displayed.
• The Legend of the monitor displays the top Network Objects in use. Kate optimizes the monitor view, by selecting Monitor > Optimize Scaling. When Kate selects a Network Object in the Legend, the Network Object is marked in the monitor.
Monitoring by QoS Policy Rules
• Conclusion: Kate sees that in the monitor there are no specifically aggressive users in the previous week’s monitor.
Conclusion
Once her manager is in her office, Kate shows the saved file recorded from real-time as well as the report generated in Report mode and the Real-real-time charts that she created. Kate and her manager conclude that they need to contact the
aggressive users and reduce the heightened Services count.
• Kate’s manager calls Joe_user_ABCD. Joe_user_ABCD admits to downloading multiple MP3s, thereby causing over-use of KaZaA.
• Kate’s manager also calls the CEO’s secretary, to discover that the CEO is in a video conference, thus explaining the increased H323 services.
Monitoring by QoS Policy Rules
FIGURE 4-5 Session Properties — selecting to monitor traffic by QoS Rules
To set up SmartView Monitor for monitoring an interface by QoS Policy rules:
1 Select Real Time Mode in the Session Type & Target tab of the Session Properties
Session Properties Window — Monitor by QoS Rules Tab
Chapter 4 Monitoring — Real-Time Traffic 33
2 Select Monitor by QoS Policy Rules in the Session Type & Target tab of the Session Properties window.
3 Select an interface under Select Monitored Module/Interface. Only one interface can be monitored at any given time.
4 In the Monitor by QoS Rules tab, select the rules by which you wish to monitor. For information about the fields in the Monitor by QoS Rules tab, see “Session Properties Window — Monitor by QoS Rules Tab” on page 33.
5 In the View Settings tab, specify the display parameters for the session.
For information about the fields in the View Settings tab, see “Change the Display — Settings Tab” on page 19.
When the monitoring parameters have been set up, you can begin the monitoring display. See “Monitoring by QoS Policy Rules” on page 32.
Session Properties Window — Monitor by QoS Rules Tab
FIGURE 4-6 Session Properties window — Monitor by QoS Rules tabData Direction — Choose the direction of monitored traffic. Select one of the following:
Monitoring by QoS Policy Rules
• Inbound — traffic entering the gateway through the specified interface.
• Outbound — traffic exiting the gateway through the specified interface.
• Eitherbound — traffic passing through the specified interface in either direction.
Installed QoS Policy — Choose the rules you wish to monitor. Click Refresh Rules to display all the rules in the installed rule base.
All the rules will be selected by default. If there are rules that you do not wish to monitor, deselect them. You may also click:
• Select All — to reselect all the rules.
• Clear All — to deselect all the rules.
• Select Main Rules — to select only the rules at the first level of the QoS Policy, without subrules.
Example — QoS Rules
Kate decides to check the status of traffic distribution by QoS rules using the
SmartView Monitor in order to validate the effectiveness of the QoS policy. Therefore:
1 She opens a new session, by selecting Session > New
2 In the Session Type & Target tab, she chooses the Real-Time Session Mode and she makes sure that Traffic > Top QoS Rules is selected. She choose the same module monitored as in the previous reports.
3 In the Monitor by Top QoS Rules tab, she clicks Refresh Rules to ensure that the QoS rules displayed in the Installed QoS policy listbox are up-to-date. She selects the QoS rules that she would like to monitor.
Example — QoS Rules
Chapter 4 Monitoring — Real-Time Traffic 35
FIGURE 4-7 Monitor by QoS Rules
Monitoring by QoS Policy Rules
FIGURE 4-8 top QoS rules
Suspending QoS Policy
If there is a FloodGate-1 QoS Policy installed on the monitored interface, you can choose to suspend it and view unrestricted traffic at any time during a monitoring session.
Suspending QoS Policy
Chapter 4 Monitoring — Real-Time Traffic 37
Monitoring by Top Security Rules
FIGURE 4-9 Top Security RulesTo set up SmartView Monitor for monitoring by Top Security rules:
1 Select Real Time Mode in the Session Type & Target tab of the Session Properties
window.
2 Select Monitor by Top Security Rules in the Session Type & Target tab of the Session Properties window.
3 Choose an interface under Select Monitored Module/Interface. Only one interface can be monitored at any given time.
4 In the Monitor by Top FW Rules tab, select the rules by which you wish to monitor. For information about the fields in the Monitor by Top FW Rules tab, see “Session Properties Window — Monitor by Top Security Rules Tab” on page 38.
5 In the View Settings tab, specify the display parameters for the session.
For information about the fields in the View Settings tab, see “Change the Display — Settings Tab” on page 19.
Monitoring by Top Security Rules
After you have set up the monitoring parameters, click OK and the monitoring display opens.
Session Properties Window — Monitor by Top Security Rules
Tab
FIGURE 4-10 Session Properties window — Monitor by Top FW Rules tab
Data Direction — Choose the direction of monitored traffic. Select one of the following:
• Eitherbound — traffic passing through the specified interface in either direction
• Outbound — traffic exiting the gateway through the specified interface
• Inbound — traffic entering the gateway through the specified interface
Example —
Top Security Rules
Generating a Report
Kate decides to make traffic report for the top Security rules that have been in use on the London_Gateway module over the past hour. In SmartConsole:
Example —Top Security Rules
Chapter 4 Monitoring — Real-Time Traffic 39
• In the Session Type & Target tab, she chooses the History Report Mode and she makes sure that Traffic is selected. She makes sure that she selects the same module that she selected for the Services Report.
• In the Traffic History tab, she chooses to create a Report with a Time Frame of the
Last Hour.In the Report listbox she selects the Top Security Rules report. She clicks
OK, and the report is displayed.
FIGURE 4-11 Top Security Rules
• Kate discovers that she can stand on the bars in the monitor and a tooltip is displayed. This tooltip displays information about the selected top security rule
• Conclusions —
Kate discovers that the FireWall-1 rule that is in most frequent use is rule 17. She goes to the SmartDashboard to see what this rule is about:
TABLE 4-1 The drop rule on the Rule Base
No. Source Destination Services Action
Monitoring by Top Security Rules
Kate discovers that the FireWall-1 rule that is in the next most frequent use is rule 39. She goes to the SmartDashboard to see what this rule is about:
Generating a Real Time Monitor
In her SmartConsole, Kate has discovered that rule 17 is the most prolific rule. Kate decides to check if this is still the case in real-time. Therefore:
• She opens a new session, by selecting Session > New
• In the Session Type & Target tab, she chooses the Real-Time Session Mode and she makes sure that Traffic > Top Security Rules is selected. She choose the same module monitored in the previous reports.
• In the Monitor by Top FW Rules tab, she chooses to monitor the Top Security Rules. She decides to monitor whether the specified rule still occurs within the top rules. She leaves the number of top rules to be monitored at its default - 6. She decides to monitor this traffic in both direction, therefore she selects eitherbound.
• In the Settings tab, she set the Chart Type as Bar so that she will be able to see an effect distinctly if it occurs. She selects the Measurement to be Line Utilization.
• Kate clicks OK, and the SmartView Monitor displays the top six rules. The monitor is dynamic and every few seconds the rules change, but Kate is able to see that Rule 17 does indeed recur on several occasions.
When Kate sees that Rule 17 recurs, she decides to investigate further. She selects
View > Freeze View. The Top Security Rules monitoring ceases to run. Kate changes the Chart Type from Bar to Line, since in Line charts, when the monitoring is interrupted, the chart is marked by a broken line at the place where the monitor was interrupted.
• Conclusions:
Rule 17 stipulates that all connections should be dropped. In a typical system the drop rule is the last rule in the Rule Base and is generally added in to ensure that all connections that cannot be matched against the Rule Base are immediately dropped. In this scenario, where there are many connections being dropped. When Kate sees the prolific appearance of the drop rule, she feels that there may be some suspicious activities going on. Since this suspicious activity may indicate some sort of security hazard, she decides to further her investigations in order to ensure that there is not some form of attack being performed.
TABLE 4-2 The drop rule on the Rule Base
No. Source Destination Services Action
Example —Top Security Rules
Chapter 4 Monitoring — Real-Time Traffic 41 Kate sees that Rule 39 is a very influential rule. She decides to move it to the beginning of the Rule Base in the SmartDashboard in order to improve the performance and effectiveness of the policy.
Filtering Traffic
Filtering enables you to target specific network activities for monitoring. It provides you narrow view angle of the specific components you have selected. You can focus on a specific user's activities or target the source and destination of a particular service. How to Configure Filtering
You can configure filtering in one of the following ways:
• through the Session View window.
• through the Session Properties window.
When monitoring services and your goal is to focus on the HTTP service and to find out which IP machine is the heaviest HTTP service consumer.
Filtering from the Session View window
Right click on the http bar/line and select Top Sources on http. The View window displays the top ten IP machines that generate the heaviest http traffic (that passes through the monitored module). The session properties change according to the new settings.
Filtering from the Session Properties window
1 In the Traffic by section select the Network Objects (IP's).
2 In the Monitor by Network Object section select Top Network Objects.
3 In the Data Direction section select the appropriate choice.
4 In the Data Origin section select Source.
5 In the Filter tab, enable filtering by selecting the traffic types to be monitored. Click Monitor Traffic that Matches the Below, then check Services.
6 Select http from the Available Services list and click Add. The http appears on the
Match window.
7 Click OK.
Other options include:
• Monitor all traffic: this option disables filtering, resulting in monitoring all types of traffic that passes through the selected module/interface.
Filtering Traffic
• The Not check box in the Match section enables you to filter out traffic types you do not wish to include in the monitoring process. Hence, all categories except those that are specified in the Not section will be included in the monitoring scheme.
• The Custom IP or Custom Service button (depending on the highlighted traffic filter type) enables you to include a specific user machine or a service that is not provided by the SmartCenter database.
When using Filtering, only traffic that matches at least one of the categories you have selected is displayed. For example, you configure the Filter to monitor Top IP and match
http and Telnet services. The view will display the following top IP machines that use either HTTP or Telnet. In addition, you can add another server machine by following these steps:
• In the Monitor trafficthat matches the below, check the Destination-Network Objects box.
• Select the appropriate machine to be the destination (i.e. London_Server).
The View window displays a bar representing the following result: Top heaviest traffic consumer machines of either HTTP or Telnet traffic that is sent to the London_Server.
43 C H A P T E R
5
Blocking Real-Time
Traffic
In This Chapter
Blocking Traffic
Blocking can be enabled through suspicious activity rules, which allow the system administrator to instantly block suspicious connections.
Suspicious Activity Rules
Suspicious Activity rules are security rules that enable the system administrator to instantly block suspicious connections that are not restricted by the currently enforced Security Policy. These rules, once set, can be applied immediately without the need to perform an Install Policy action.
There are two ways to block suspicious activity: using the Action menu or by right clicking in the Session View.
Using the Action menu
1 Select Action > Block Suspicious Activity. The Block Suspicious Activity window is displayed.
2 Select Apply On for either all VPN-1 & FireWall-1 modules or for a specific module.
Suspicious Activity Rules page 43
Blocking Traffic
3 In the Source section select Any to define blockage of all source machines or indicate a specific IP address/ network. If you would like to indicate a specific network source, define both the source machine’s IP and its netmask
4 In the Destination section select Any to define blockage of all destination machines or define a specific IP address. If you would like to indicate a specific network destination, define both the destination machine’s IP and its netmask. In the Service section either select Any for blocking all services or define the specific service you wish to block.
5 In the Expiration section either select time of expiration or check the box for defining an Absolute Date and Time.
6 Click the Advanced button to:
a Select either Drop, Reject or Notify in the Action drop-down list.
• Notify - a notification about the defined activity will be sent but the activity will not be blocked.
• Drop - will drop the packets without sending the communicating peer a notification.
• Reject - will reject the packets while informing the communicating peer it had rejected it.
b Select No Log, Log or Alarm in the Track drop-down list.
c Check Close Connections in order to close all active connections that match the defined rule.
By Right Clicking in the Session View
The Session View allows you a quick way to block traffic by right clicking on its bar/line. This action opens up the Block Suspicious Activity window. This window will already have the appropriate settings of the particular session’s parameters you wish to block (either Service or IP parameters).
For example, assume you are viewing a session by Top Services on a specific client machine defined as a source and you wish to block KaZaA service simply right click on the KaZaA’s bar or line. The Block Suspicious Activity window is displayed. This window will already have the following settings:
• KaZaA service defined as the Blocked service.
• The client machine IP is defined as the source IP Address.
• Any in the destination field.
You can modify all the parameters in this session including the default Expiration Date
Managing Suspicious Activity Rules
Chapter 5 Blocking Real-Time Traffic 45
Managing Suspicious Activity Rules
Suspicious Activity rules are security rules, which, once they are set they can be applied immediately without the need to perform "Install Policy". These rules enable the system administrator to instantly block suspicious connections that are not restricted by the currently enforced Security Policy.
In the Enforced Suspicious Activity Rules window you can:
• View the rules that are currently being enforced on a module.
• Remove or add new rules. There are two View types:
• Rules that are being enforced on the specific module.
• Rules that are being enforced on all of the modules. To view these rules perform the following steps:
• From the main menu select Action • Select Suspicious Activity Rules.
Note - Since the Suspicious Activity Rules View window provides a display of the currently enforced rules, if the system administrator adds a rule that is shadowed by another rule, the shadowed rule remains hidden. For example, if a rule was defined for dropping all http traffic and an additional rule is defined for rejecting http traffic, only the drop rule, which is the dominant rule, will be displayed.
47 C H A P T E R
6
Virtual Link Monitoring
(VLM)
In This Chapter
Overview
Virtual Link Monitoring allows you to monitor traffic between two Check Point VPN-1 Pro or FloodGate-VPN-1 Modules and to track compliance with a Service Level
Agreement (SLA).
A Virtual Link is a path between two Check Point VPN-1 Pro or FloodGate-1 Modules (gateways), defined in SmartDashboard. You can monitor the following data on a Virtual Link:
• Committed Information Rate (CIR), or bandwidth
• Throughput loss, or bandwidth loss
• Round trip time
Monitoring a Virtual Link using SmartView Monitor requires the following:
• A Virtual Link between two gateways must first be created in the VPN-1 Pro SmartDashboard.
Overview page 47
Creating a Virtual Link page 48
Monitoring a Virtual Link page 52
Displaying Virtual Link Monitoring Data page 55
Virtual Link Monitoring Example page 57
Creating a Virtual Link
To track compliance with SLA parameters, SLA parameters and Log and Alert parameters must also be defined in the SmartDashboard.
For information on creating a Virtual Link and defining SLA parameters and Log and Alert parameters, see “Creating a Virtual Link” on page 48.
• Once a Virtual Link has been created and its properties have been defined, you can use SmartView Monitor to monitor traffic between the two gateways that define the link.
For information on monitoring a Virtual Link, see “Monitoring a Virtual Link” on page 52.
For information on using SmartView Monitor to monitor other types of traffic, see Chapter 4, “Monitoring — Real-Time Traffic.
Creating a Virtual Link
To create a Virtual Link and define SLA parameters and Log and Alert parameters, proceed as follows:
1 In the SmartDashboard choose SmartView Monitor > Virtual Links from the Manage
menu.
The Virtual Links window is displayed (FIGURE 6-1).
FIGURE 6-1 Virtual Links window
2 Click New and choose Virtual Link.
The Virtual Link Properties window will be displayed.
3 In the General tab of Virtual Link Properties window (FIGURE 6-2 on page 50):
• Specify the Name and Color of the Virtual Link. You may also include a
Editing or Deleting a Virtual Link
Chapter 6 Virtual Link Monitoring (VLM) 49
• Choose the Virtual Link End Points, the two gateways that define the Virtual Link.
• Check Activate Virtual Link to enable the Virtual Link.
For detailed information about the fields in the General tab, see “Virtual Link Properties Window — General Tab” on page 50.
4 In the SLA Parameters tab of the Virtual Link Properties window, define the following SLA parameters:
• Thresholds — limits on Committed Information Rate, bandwidth loss and/or round trip time. You may choose to be informed when these limits are violated.
• SLA Statistics — specify whether or not Virtual Link information will be logged in the Check Point SmartView Tracker.
For detailed information about the fields in the SLA Parameters tab, see “Virtual Link Properties Window — SLA Parameters Tab” on page 51.
5 Click OK.
The Virtual Link and its SLA Parameters have been defined.
6 Display the Global Properties window by choosing Global Properties from the Policy
menu, or by clicking in the SmartDashboard Toolbar.
7 Specify Log and Alert parameters in the Log and Alert page of the Global Properties
window.
For information about the Log and Alert page, see “Global Properties Window — Log and Alert Page” on page 52.
8 Click OK.
Editing or Deleting a Virtual Link
After a Virtual Link has been created, you can edit its properties or delete it. Enter the
Virtual Links window and select the link from the list of Virtual Links. To delete the selected Virtual Link, click Remove.
To edit the selected Virtual Link, click Edit and redefine the desired parameters in the
General and SLA Parameters tabs. You may go directly to these tabs by double-clicking the name of the Virtual Link in the SmartDashboard Objects Tree.


![FIGURE 4-3 Session Properties window — Session Type & Target tab [Network Objects (IPs)]](https://thumb-us.123doks.com/thumbv2/123dok_us/8543809.2303099/28.892.133.512.139.554/figure-session-properties-window-session-target-network-objects.webp)

