Ohio at a Crossroads:
The Developmental Disabilities
System
Rose Frech, Fellow
Jon Honeck, Ph.D., Director of Public Policy and Advocacy
Kate Warren, Graduate Assistant
March, 2015
2 2KLRDWD&URVVURDGV7KH'HYHORSPHQWDO'LVDELOLWLHV6\VWHPȽMarch, 2015
Executive Summary
Ohio’s Developmental Disabilities System Faces Transformational
Change
Ohio relies heavily on institutional care and sheltered workshops for individuals with developmental disabilities, which many advocates argue are isolating, restrictive, and don’t promote independence. The system will undergo profound change in the coming years, and additional measures are needed to strengthen its ability to adapt to change. This study explains the developmental disabilities system in Ohio, and analyzes these recent important changes, including the impact of new federal Medicaid rules and changes proposed in the governor’s budget. We outline a series of recommendations that will help the system to increase access to integrated, community-based services and fully realize the rights of individuals with
developmental disabilities. Recommendations include:
x Improve the availability of Medicaid Waiver services & identify a plan to eliminate the
waiting list
x Examine funding inequity among counties and improve funding for the tax-equity line
item in the state budget
x Enhance funding for community employment supports and streamline access to services
x Accelerate ICF downsizing and conversion
x Address wage issues of the direct care workforce, and monitor employee turnover and
provider quality
x Develop additional housing supports which are necessary to fully support community
integration
An Overview of the Developmental Disabilities System in Ohio
The Ohio Department of Developmental Disabilities (DODD) provides general oversight to the state’s system of supports and services for individuals with developmental disabilities. Locally, county boards of DD are responsible for facilitating these services. County boards serve nearly 90,000 individuals each year; about half are adults. While historically service provision has favored institutional settings, the pendulum has swung toward a preference for community-based services and independent living, which decrease isolation and increase integration for individuals with developmental disabilities. Finding the proper balance between settings is an ongoing discussion across the state and country.
www.CommunitySolutions.com 3
ICFs and Developmental Centers
A range of services and supports are available for individuals with developmental disabilities, including various residential options. Intermediate Care Facilities (ICFs) include both privately operated facilities, board-operated facilities, and 10 state-run Developmental Centers (DCs). In 2014, these residential options accounted for about 6,700 beds. The size of these facilities varies; while many are smaller and more “home-like,” others are large and deemed by many to be “institution-like.” In total in 2014, almost 3,000 individuals lived in facilities with more than 16 beds, while only 529 were living in six-bed or smaller facilities.
The advocacy group Disability Rights Ohio recently called into question the state’s heavy reliance on ICFs, which many believe promote segregation, impede the rights of those with developmental disabilities, and may violate federal law. The state is currently working to convert ICF beds to Medicaid Waivers, which allow individuals to waive their right to institutional care in favor of receiving services in a home or community-based setting.
Relatedly, efforts are underway to decrease the size of large-bed facilities. To date, these efforts have been slow. And, because the state pays the nonfederal Medicaid match for ICFs, boards may have a financial incentive to direct individuals into ICFs rather than onto waivers, where county boards are responsible for the nonfederal Medicaid match.
Medicaid Waivers
Waiver programs include services such as nonmedical transportation, employment and day services, nutrition assistance, respite for caregivers, certain therapies, accessibility
modifications, and personal care assistance. Ohio currently has four DD waiver programs that serve people with different types and levels of need, including the Individual Options (IO) Waiver, the SELF (Self Empowered Life Funding) Waiver, Transitions (TDD) Waiver, and the Level One Waiver. As of February, 2015, over 35,000 people were receiving services through DD waivers across the state. Since 2002, waiver growth has quadrupled. DD waiver reimbursement in Ohio totaled approximately $1.5 billion in 2014.
As of October, 2014, there were over 45,000 people on county waiver waiting lists across the state. The median wait time is about 6.4 years. A 2014 study suggests that approximately 22,000 individuals on waiting lists had current unmet needs for services. The number of individuals on waiting lists varies significantly by county, but overall, DODD reports that the statewide list grows by 100 to 200 individuals each month. Several counties only remove individuals from the waiting list on an emergency basis or as other individuals with waivers no longer require these services, due to death or relocation.
Many factors contribute to long waiver waiting lists, including a lack of adequate local funds to make the match. However, data demonstrate that funding alone does not determine waiver accessibility. County boards may elect to divert available funds to other programming. Given the many restrictions and requirements tied to waiver services, counties may be reluctant to expand their waiver programs for fear of losing local control. The IO Waiver, the most
4 2KLRDWD&URVVURDGV7KH'HYHORSPHQWDO'LVDELOLWLHV6\VWHPȽMarch, 2015 frequently utilized waiver, has no monetary cap, and boards may be cautious to offer new waivers without knowing what their contribution will be in future years.
Day and Employment Services
Ohio’s developmental disability system also includes services that offer support for social and employment needs. Medicaid is the primary payer for most day and employment supports, though county boards often heavily supplement this funding. Adult day programs engage individuals, teach life skills, help with social interaction, and provide opportunities for community integration. Adult programs may also be vocational in nature, including facility-based sheltered workshops. Another more independent and integrated option is community employment, with support services such as job coaching or aides as needed.
Many advocates argue that sheltered workshops and adult day programs segregate individuals with developmental disabilities from the community, do not provide adequate employment training, and often pay less than a minimum wage. Others praise the benefits of sheltered work, maintaining that many individuals with developmental disabilities cannot fully adjust to
community employment and will face harassment or bullying, and that local communities are not ready and willing to accept integrated employment.
Ohio’s Employment First Initiative emphasizes the importance of integrated employment for all persons with developmental disabilities and consequently is working to design a funding system to shift resources to accommodate that vision. However, since its inception,
Employment First has not led to significant change in the employment landscape throughout the state.
The Governor’s Budget
In February, 2015, Governor John Kasich announced his 2016-2017 biennial budget, which requires approval by the Ohio legislature. The budget included substantial investments in developmental disability services: $112 million above 2015 levels over the course of the two years. DODD has announced that, if approved, spending would target ICF downsizing efforts, increased funding for community employment, and most notably, the addition of 3,000 HCBS Waivers.
System Funding
Ohio’s funding structure is unique in that a large portion of its funding for services for persons with developmental disabilities comes from local revenue streams, primarily property tax levies. Due to this reliance on local money, discrepancies in funding across the state are vast. In some cases, this means that Ohioans with developmental disabilities can't access equitable services. However, increased funding doesn't always lead to increased access to community-based services. Counties may elect to spend money on less-integrated services.
www.CommunitySolutions.com 5
CMS Rule Change
Ohio is preparing to implement changes to Medicaid rules that have narrowed the types of settings in which Medicaid reimbursable services can take place, with a greater emphasis on integrated, community-based settings and outcomes. This will have a significant impact on services.
x Sheltered work and day services, as they have traditionally been delivered in Ohio, will no longer meet the requirements outlined in the new rules, as these settings largely isolate individuals and don’t allow for full access to the community.
x The Centers for Medicare and Medicaid Services (CMS) rule calls for “conflict-free” case management. Boards directly employ Service and Support Administrators who
complete eligibility determinations, develop service plans, and connect people to recommended services. In addition to this case management service, many county boards also provide services directly to individuals, including Medicaid Waiver home and community-based services. According to CMS, there is an inherent conflict of interest in this structure.
States will have as many as five years to come into full compliance on the new rule; Ohio is requesting 10 years for certain provisions, including changes to sheltered work settings. Transition plans were submitted to CMS in mid-March, 2015.
Key Recommendations for System Change
As a result of our research, we recommend the following changes to improve the Ohio developmental disabilities system.
x Develop a long-term solution to the state’s complex waiver problem. The current system is not sustainable. This should include examining options to increase the financial capacity of counties and additional state-funded waivers.
x Increase funding for Employment First. Improve the partnership with Opportunities for Ohioans with Disabilities (OOD) and streamline access to employment services.
x Implement changes to accelerate ICF downsizing and conversion, including decreasing rates for beds serving those with lesser levels of acuity.
x Add additional housing supports to fully support community integration. x Undertake an examination of the SELF Waiver to remediate barriers to use.
x Assess waiting lists to identify who has the greatest levels of unmet need and assure that these individuals are targeted for enrollment in the most appropriate waiver.
x Increase collaboration among boards to lead to cost savings and increased efficiency.
6 2KLRDWD&URVVURDGV7KH'HYHORSPHQWDO'LVDELOLWLHV6\VWHPȽMarch, 2015
Table of Contents
An Overview of the Developmental Disabilities System in Ohio ... 7
Background ... 7
Prevalence ... 9
Service Delivery... 11
Service Overview ... 13
Residential Services and Supports... 16
Intermediate Care Facilities and Developmental Centers ... 16
Home and Community-Based Residential Services ... 21
Conversions and Downsizing ... 32
Day and Employment Services ... 34
Employment First ... 37
System Funding ... 40
State Spending and Revenue ... 40
County Board Revenue and Expenditures ... 43
County Board Funding Trends ... 48
Recent Concerns and Issues ... 50
CMS Rule Change ... 50
Concerns around Quality and Monitoring ... 54
Advances in Technology ... 55
Service Providers and Wages ... 55
The Governor’s Budget ... 56
Ohio at a Crossroads: Recommendations ... 58
Appendices ... 64
Authors
Rose Frech, Fellow, Applied Research
Jon Honeck, Ph.D, Director of Public Policy and Advocacy
Kate Warren, Graduate Assistant, Cleveland State University, Maxine Goodman Levin College of Urban Affairs
www.CommunitySolutions.com 7
An Overview of the Developmental Disabilities System in Ohio
Background
Ohio is at a turning point in establishing best practices for serving persons with developmental disabilities, as
philosophies of best practice are evolving. Due to the changing landscape, it is an opportune time to examine how these services are provided and funded, and explore the significant variations in funding and administration that occur across the state. Key stakeholders believe that impending changes are likely to be the most significant transformation the system has experienced in decades. Ohio remains reliant on certain services that are no longer considered to be best practices (including sheltered-work and large institutional facilities), and while system reform is undoubtedly necessary, promises of large-scale change have led to much uncertainty on the part of individuals with developmental disabilities, family
members, and providers alike. In this report, we explain the service system in Ohio, review recent or forthcoming changes, and explore in-depth the complex funding structure that complicates the delivery of services and projected system change.
For centuries, developmental disabilities were misunderstood by educators, doctors, family members of individuals with developmental disabilities, and society at large. Until as recently as the late 1800s, many believed the misconceptions that disabilities were the result of the moral failure of parents, that they could be “cured” through training and education programs, that they were hereditary disorders, and that individuals with disabilities were the cause of many of society’s moral ills. These fallacies often resulted in the development of paternalistic programs and policies that
isolated individuals with disabilities and limited their ability to live fully integrated into the community. A system of public and private institutions emerged, and while they were often founded with the intentions to protect individuals, scarce funding, a lack of properly trained staff, overcrowding, and a perception of individuals as burdens on society led to often
terrible conditions inside the facilities. Abuse and neglect were common.1
By the 1970s, much of the stigma surrounding people with disabilities had dissipated. People with disabilities were increasingly being empowered to make decisions for themselves, and a
How Does Having a Disability Affect Someone’s Life?
“The effects of intellectual disabilities vary considerably among people who have them, just as the range of abilities varies considerably among all people. Children may take longer to learn to speak, walk and take care of their personal needs, such as dressing or eating. It may take students with intellectual disabilities longer to learn in school. As adults, some will be able to lead independent lives in the community without paid supports, while others will need significant support throughout their lives. In fact, a small percentage of those with
intellectual disabilities will have serious, lifelong limitations in functioning. However, with early intervention, appropriate
education and supports as an adult, every person with an intellectual disability can lead a satisfying, meaningful life in the community.”
Source: The Arc
http://www.thearc.org/what-we- do/resources/fact-sheets/introduction-to-intellectual-disabilities
8 2KLRDWD&URVVURDGV7KH'HYHORSPHQWDO'LVDELOLWLHV6\VWHPȽMarch, 2015 movement began to end the institutional system in favor of independent, community living. Parents and caregivers, who sought better, fuller, lives for their loved ones, were at the crux of the movement. The changing language used to refer to people with disabilities also signaled changing societal attitudes toward them. At the turn of the century and up until the 1950s, people with disabilities were often referred to as “idiots,” “morons,” “feebleminded,” and even “almosts,” signaling their social status as not entirely human.2 In more recent decades, accepted terminology included “mentally retarded,” “handicapped,” and “disabled.” Today, in contrast, we refer to “individuals” or “persons with developmental disabilities” (DD) as a way to
emphasize their personhood, as opposed to focusing on their limitations. Both the Americans with Disabilities Act (1990), which prohibits discrimination against individuals with disabilities, and the Olmsted Decision (1999), 1were key turning points in advancing the perception and treatment of individuals with developmental disabilities. And while significant strides have been made, continued work is necessary by policy makers, providers, and family members to fully recognize their civil rights.
“Developmental disability” is an umbrella term that includes a wide range of specific conditions, including intellectual (cognitive) disabilities, Down Syndrome, Cerebral Palsy, Autism Spectrum disorders, language and learning disorders, and others. However, due to eligibility criteria, outlined below, not everyone with a developmental disability will qualify for services and supports.
The Ohio Revised Code (5126.01) provides the following definition of “developmental
disability.” It is this definition that primarily guides eligibility assessment and determination in the state; however, federal definitions vary from program to program, complicating eligibility and resulting in inconsistency in benefit determination:
"Developmental disability" means a severe, chronic disability that is characterized by all of the following:
(1) It is attributable to a mental or physical impairment or a combination of mental and physical impairments, other than a mental or physical impairment solely caused by mental illness as defined in division (A) of section 5122.01 of the Revised Code; (2) It is manifested before age twenty-two; (3) It is likely to continue indefinitely;
(4) It results in one of the following:
(a) In the case of a person under age three, at least one developmental delay or a diagnosed physical or mental condition that has a high probability of resulting in a developmental delay;
(b) In the case of a person at least age three but under age six, at least two developmental delays; (c) In the case of a person age six or older, a substantial functional limitation in at least three of the following areas of major life activity, as appropriate for the person's age: self-care, receptive and
expressive language, learning, mobility, self-direction, capacity for independent living, and, if the person is at least age sixteen, capacity for economic self-sufficiency.
(5) It causes the person to need a combination and sequence of special, interdisciplinary, or other type of
www.CommunitySolutions.com 9 care, treatment, or provision of services for an extended period of time that is individually planned and coordinated for the person.
Prevalence
For a variety of reasons, it is difficult to know exactly how many people there are with
developmental disabilities. Diagnoses can be unreliable, not all individuals with developmental disabilities are enrolled in or receive services, and definitions of DD can be inconsistent.
Furthermore, increased early identification and intervention and the explosion in autism
diagnoses mean that estimates are changing rapidly. General population estimates range from 1 to 2 percent. However, there may be geographic variations in prevalence due to environmental factors, service availability, local screening procedures, or variable rates of preterm birth. Nonetheless, it is useful to make informed estimates about the prevalence of developmental disabilities in order to make helpful observations and recommendations about the DD system. For the purposes of this report, we are using prevalence estimates provided by the Scripps Gerontology Center at Miami University.3 The Scripps Center provides figures at the county level for people with severe and moderate intellectual or developmental disabilities. Estimates are generated using 2010 population data from the American Community Survey. Scripps’ methodology relies on two sources. Rates for individuals living with severe developmental disabilities are based on the number of individuals who meet the Intermediate Care Facilities (ICF) level of care, provided from the Ohio Department of Developmental Disabilities (DODD) data system. ICF level of care assessments are typically conducted by county boards of
developmental disabilities, and those eligible must have a diagnosed developmental disability and be determined to require assistance in areas such as economic independence,
communication, independent living, personal care, or daily life activities.4 Estimated
prevalence rates for individuals with moderate disabilities are based on data from the 2004-2005 Survey of Income and Program Participation (SIPP), a household survey of community
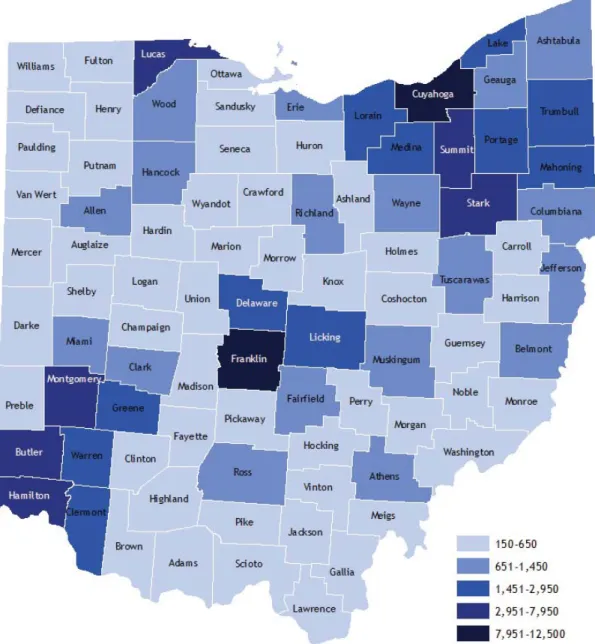
residents. This report combines these figures to generate one prevalence number for each county, as services are often made available to both populations. To emphasize that figures are only estimates, numbers were then rounded to the nearest 50. Overall, these data estimate a prevalence rate for individuals with developmental disabilities of about 1 percent of the total population, or approximately 113,000 people in Ohio.
Notably, some sources estimate a much higher rate of individuals with intellectual or developmental disabilities, as high as 2.5 percent or upward of 250,000 individuals in Ohio. These inconsistences can be attributed in part to changes in definition over time, challenges with U.S. Census categorization, and disputes over the accuracy of increases in diagnoses such as attention deficit hyperactivity disorder (ADHD) and autism.5 And while data on the
prevalence of developmental disabilities among children are more readily available, studies specific to adult prevalence rates are limited. Such variances in prevalence estimates are cause for concern, as potential “undercounts” may impact the state’s ability to effectively plan and monitor services.
10 2KLRDWD&URVVURDGV7KH'HYHORSPHQWDO'LVDELOLWLHV6\VWHPȽMarch, 2015 The aging population is anticipated to have a significant impact on this demographic. Life expectancies are increasing for both disabled and nondisabled individuals. As a result of
medical advancements and more evolved support services, even people with severe disabilities can expect to live longer than they may have 50 years ago. Therefore, individuals will require care for a longer period of time, leading to increased costs. Similarly, adult caregivers are living longer, creating complex family dynamics that will certainly have serious implications for the DD system. However, data suggest that more than 1,000 developmentally disabled individuals in Ohio waiting for community supports will lose their primary caregiver each year, requiring a need for increased external supports. 6
Figure 1. Estimated Number of Individuals with
Developmental Disabilities by County
www.CommunitySolutions.com 11
Service Delivery
The Ohio Department of Developmental Disabilities (DODD) provides general oversight to the state’s system of supports and services for individuals with developmental disabilities. Locally, county boards of DD are responsible for facilitating these services. Ohio’s Developmental Disabilities system is a prime example of the state’s “home rule” governing structure, as government-sponsored services are administered and provided at the local level. Every county is served by a local board, responsible for coordinating services for children and adults with developmental disabilities. Boards, established in 1967 through a legislative act, are made up of members who are appointed by local probate judges and county commissioners or executives. Each board is comprised of seven individuals, including no less than three individuals eligible to receive services or family members of persons with developmental disabilities.7 Very few boards in Ohio currently have representation by members with developmental disabilities. County boards are headed by a Superintendent (the title reflects the board’s historic role as an operator of schools for children with developmental disabilities), who is responsible for overall administration, though many boards also employ a business manager responsible for financial management and annual budget development.
County boards make eligibility determinations for those with an accepted diagnosis using an assessment tool called the Ohio Eligibility Determination Instrument (OEDI), or COEDI (for children), or other approved instruments. Only those who qualify may receive services (see Appendix I for Eligibility Flow). These tools are administered locally, typically by board-employed Service and Support Administrators (SSA). Across the state, county boards serve nearly 90,000 individuals with developmental disabilities, or about 80 percent of the population with developmental disabilities in Ohio, based on prevalence estimates. This differs widely by county, with some counties, such as Jackson, Portage and Green, serving fewer than 50 percent of their estimated population with developmental disabilities, and others serving over 100 percent of their prevalence estimate.
Depending on the county’s needs and resources, boards often elect to provide a large number of services directly, through board-employed staff, or to contract with local private agencies to provide the needed services. Currently, according to stakeholder interviews, approximately half of all day services are provided by private providers, while the rest are delivered by county boards. Most counties rely on a combination of both direct services and contracts with providers. In recent years, several local boards have “privatized” almost completely. While there are many similarities in the services and supports offered through local boards, the type, quality, variety, and volume of services offered differ from county to county. Funding for board services comes from a combination of local, state, and federal, sources, which are explored in detail later in this report.8 Many variables influence the service mix in each county, including local levy millage and property values, proximity to providers and the available provider “pool,” as well as community needs.2 The personal philosophy of local decision makers, namely
2Waivers are a Medicaid program that allows individuals to access home and community-based services as an alternative to institutional care.
12 2KLRDWD&URVVURDGV7KH'HYHORSPHQWDO'LVDELOLWLHV6\VWHPȽMarch, 2015 board superintendents and membership, can also play a role on issues around quality care, local control, and consumer choice.
In addition to support provided through local boards, individuals with developmental disabilities may also seek or receive services and supports through local education and health systems, county offices of Employment and Family Services, and others. While this report will not address these services in detail, this cross-system involvement is common, and is an important factor to meeting the full-range of needs of individuals.
Age of Individuals Served
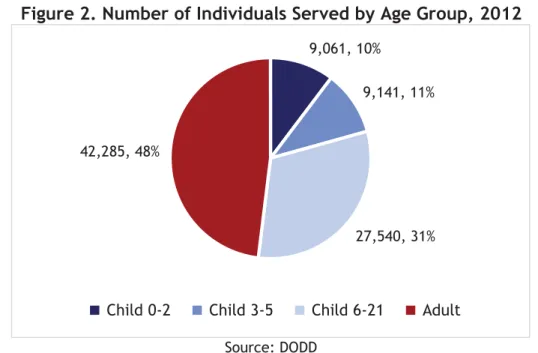
Children make up the largest percentage of individuals served through county board services. In 2012, children ages 0 to 21 represented 52 percent of those receiving services; 21 percent of individuals served were under the age of 6.
Figure 2. Number of Individuals Served by Age Group, 2012
Source: DODD
Just as service availability and funding vary significantly from county to county, the age demographics of those receiving services are similarly diverse. In several Ohio counties, children make up nearly 70 percent of total individuals served (Delaware, Shelby, Noble, Clermont, Morrow and Union counties). Others- including Marion, Monroe, Mahoning,
Putnam, and Highland counties- serve predominately adults (65 percent of individuals served). An aging population is sure to be a significant variable in service provision as life expectancies increase. Additionally, age breakdown can impact funding, as services for adults are typically more expensive, often including the provision of day services as well as other supports (whereas school-age children are served by local school districts).
9,061, 10%
9,141, 11%
27,540, 31% 42,285, 48%
www.CommunitySolutions.com 13
Service Overview
Often, individuals with developmental disabilities require some degree of supportive services in order to complete basic tasks of everyday life, like eating, bathing, dressing, and using the restroom (called activities of daily living, or ADLs), and to live healthy, fulfilling lives. However, the level of support necessary varies considerably depending on the level of disability, affecting the range of services available to achieve the needed support.
Services for individuals with developmental disabilities can take place in a variety of settings, including institutions or day facilities, as well as home and community-based locations. While service provision has historically swayed toward institutional settings, the pendulum has swung toward a preference for community-based services and independent living, which are seen to decrease isolation and increase integration for individuals with developmental
disabilities. Finding the proper balance between home, community- and facility-based settings is an ongoing discussion across the state and country.
Services for Children
For children (individuals under age 22) with developmental disabilities, common supports and services include Early Intervention, Family Support Services, and Special Education. Early Intervention services are for infants and toddlers (under the age of three) who are known to have a developmental delay or disability, or who have a diagnosed condition with a high probability of resulting in a developmental delay. Primarily federally funded, these services are available through Part C of the Individuals with Disabilities Education Act (IDEA). The Ohio Department of Health’s (ODH) Help Me Grow Program is currently the designated Part C lead in Ohio, and administers the Help Me Grow system, which is available to families in all 88 counties. Children receiving early intervention services have an IFSP, or Individualized Family Service Plan, which details the family priorities, the services needed to support those priorities (outcomes), and the progress in meeting those outcomes. The federal legislation and ODH rules list the many services that may be used to achieve the child and family IFSP outcomes (e.g., therapies, special instruction, vision, or audiological services). These services are provided through a joint effort with local county boards of developmental disabilities, as well as other providers, including those contracting directly with ODH, and include both evaluation of the child and the provision of appropriate services, supports, and therapies to promote healthy development. As children with developmental disabilities transition through the education system, children at age 3 may continue to have a disability and be eligible for special education services through their home school district. These services are provided through an
Individualized Education Plan (IEP) which contains information about the student’s disability, as well as individual educational goals and services for that student. Both IFSPs and IEPs are considered legal contracts, and adherence to the services agreed upon in the document (including frequency, intensity and method) is required by law.
Children may be “identified” at any time from birth throughout their school years, which includes the requirement to be evaluated to determine their level of disability and needed supports. Using county assessment data, and dependent on funding availability, county boards
14 2KLRDWD&URVVURDGV7KH'HYHORSPHQWDO'LVDELOLWLHV6\VWHPȽMarch, 2015 work with local districts to determine what special education services they will provide. As the child’s home school-district ultimately remains responsible for the education of the child with a disability, partnerships between boards and districts are crucial, particularly with regards to vocational training for transition-age youth.
Historically, county boards have operated schools for children with disabilities. Often well- known in the community, these schools provide specialized services specifically for children with disabilities. While some schools welcome “typical” peers to increase inclusion, others do not. This service has diminished over the past several years; however, approximately 42 county boards continue to operate center-based preschools and school-age classrooms. Additionally, public schools may have “collaborative” classrooms, wherein which the county board provides a teacher to operate a self-contained classroom for students with developmental disabilities out of a public school building. Yet, as public schools are now increasingly accommodating children with disabilities, and parents are increasingly interested in integrated schooling, support for these facilities is likely to continue to decline.
Family Support Services and funds are available to those who meet income guidelines. These services are designed to help families cope with the challenges they may face in supporting their family member with a developmental disability, and often include such services as respite care, counseling or training services, or summer camp assistance. Family Support dollars may also be used for Medicaid waiver match, and to supplement the cost of services not covered by Medicaid or other revenue sources.
As individuals transition from child services to adult life, they may face a variety of obstacles and may again rely actively on county boards for supports as they develop plans for their futures. All students aged 14 and older with developmental disabilities must have an IEP that includes plans and goals for adult life, such as vocational or postsecondary education goals, plans for independent living, and supportive services that will be needed as the individual reaches adulthood. Extensive planning and discussion should occur among the individual, family members, county board staff, school district representatives, and other team members (such as providers) to map out the best plan, as required by IDEA. Results from the Ohio Longitudinal Transition Study (2005-2012) demonstrate the impact of early planning. Students with cognitive disabilities who were able to apply for employment opportunities before they graduated were 44 percent more likely to be employed full-time after leaving school.9 It’s widely recognized that there are inconsistencies in how this planning occurs from district to district, and work is being done to improve the process through the Employment First Initiative, as well as other programs and partnerships.
Adult Services
For many adults with developmental disabilities, a multitude of services exists.Individuals who are receiving services from their county board of DD are assigned to a Service and Support Administrator (SSA), who can help eligible individuals to identify their strengths and areas of need, point them toward community resources to best meet those needs, and determine which
www.CommunitySolutions.com 15 services will be needed and how they will be paid for. Individual Service Plans, developed by SSAs with input from the individual, family members and others, dictate what services are provided at what level. SSAs act as case managers, working to coordinate services and facilitate communication among providers. SSA caseloads typically range from 35 to 50 clients, but in some instances are much higher. The primary services available to adults with developmental disabilities are residential supports (institutions or community-based), transportation, and employment or day services; however, boards may provide adaptive equipment and necessary home modifications that meet the needs of the individual with a disability. Behavioral
treatments, including psychological supports and counseling, may be provided to assist individuals with mental health problems that hinder them from leading fulfilling lives. Additionally, boards often provide services to assist individuals to access and use assistive technology. Many communities also offer classes or workshops and community groups for individuals and families. A myriad of support services are available, though the types and volume of services offered vary by county. Furthermore, funding sources for these services vary, and some services may be provided directly through board staff, while others are available through private providers.
The remainder of this report will address services that are most commonly used by adult consumers.
16 2KLRDWD&URVVURDGV7KH'HYHORSPHQWDO'LVDELOLWLHV6\VWHPȽMarch, 2015
Residential Services and Supports
Intermediate Care Facilities and Developmental Centers
Residential options for individuals with disabilities vary greatly, and there is much debate about the ideal distribution of housing options (large or small institutions, and home and community-based services). Currently, Ohio relies more heavily than other states on ICFs, or institutions intended for those with intensive physical, behavioral, or self-care needs. ICFs include both privately owned and operated facilities, board-owned-and-operated facilities, and state-run developmental centers (DCs). In 2014, these residential options (ICFs and state DCs) accounted for about 6,700 slots for individuals, often referred to as “beds.” About 5,700 of these Ohioans live in private ICFs. Figure 3 illustrates the percentage of individuals with
developmental disabilities living in private ICFs throughout the state (based on prevalence estimates).
Figure 3. Percentage of Individuals with DD living in Private ICFs, 2015
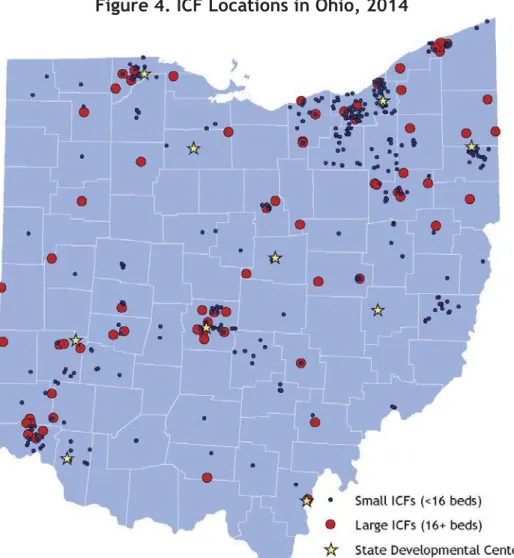
www.CommunitySolutions.com 17 DODD operates 10 facilities, in Cambridge, Columbus, Gallipolis, Montgomery, Mount Vernon, Toledo, Batavia, Tiffin, Warrensville, and Youngstown. Gallipolis houses the state’s largest DC, while the smallest is in Cambridge. 10 Despite large scale “de-institutionalization” that took place over the past 30 years, these state developmental centers continue to serve about 950 individuals. Efforts are underway to decrease this service; in early 2015, DODD announced the upcoming closure of the Montgomery and Youngstown centers, slated for July, 2017, and impacting 180 residents. DODD hopes to decrease the number of individuals living in DCs by about 25 percent over the next biennium.11
While there are many similarities between private ICFs and state DCs, developmental centers often are better able to serve individuals with significant behavioral issues, or those required to be institutionalized through court mandates, though many states serve these individuals without the use of state-operated centers. Additionally, many cite the role of DCs in providing brief respite services to individuals in crisis or those in need of stabilization, though the median length of stay is about eight months.12
Figure 4. ICF Locations in Ohio, 2014
18 2KLRDWD&URVVURDGV7KH'HYHORSPHQWDO'LVDELOLWLHV6\VWHPȽMarch, 2015 The overall institutional rate in Ohio is about 14 percent (the
number of ICF beds per total residential options, not including DCs); however, some counties have high concentrations of ICF beds, while twenty-five of Ohio’s counties have no ICF beds.13
Resident Acuity Levels
Acuity level is one factor utilized to determine
reimbursement rates at private ICFs. Acuity assessments are utilized to determine the level of staffing support and other resources necessary to provide quality services to an
individual. In Ohio, this is developed through the Resident Assessment Classification (RAC) methodology. Revised in
2013, the new methodology has six classifications. Data from 2014 demonstrate that only about 8 percent of residents have chronic medical conditions (the highest level of acuity, RAC 1), while 12 percent have typical adaptive needs (the lowest level of acuity, RAC 6). 14 Residents with higher acuity levels may find it more difficult to move to community settings.
Figure 5. Resident Acuity Levels at ICFs, 2014
Source: DODD Bed Size and Capacity
Ohio has made significant progress over the years in rebalancing its long-term care systems for the elderly and the disabled. Waiver services have grown, allowing the state to serve over 25,000 persons in smaller settings with six or fewer persons in 2011.
420 1550 868 1506 580 675 0 500 1000 1500 2000 Chronic Medical (RAC 1)
Overriding Behaviors (RAC 2) Chronic Behaviors and High Adaptive Needs (RAC 3) High Adaptive Needs and
Non-significant Behaviors (RAC 4) Chronic Behaviors and Typical
Adaptive Needs (RAC 5) Typical Adaptive Needs (RAC 6)
Number of ICF Residents
From Medicaid.gov: “ICFs/MR provides active treatment (AT), a continuous, aggressive, and consistent implementation of a program of specialized and generic training, treatment, and health or related services, directed toward helping the enrollee function with as much self-determination and
www.CommunitySolutions.com 19
Figure 6. Average Daily Residents, All Long-term Care Settings, 1994-2011
Source: United Cerebral Palsy
The size of both private and public ICFs has been heavily scrutinized by advocates, who maintain that facilities with large numbers of beds are more likely to be “institution like” and less likely to mirror independent living situations. Ohio is seventh-highest in the nation for individuals living in residential settings with seven or more beds, and ranks third for the overall number of state-operated facilities.15 According to data provided by the University of
Colorado’s “State of the States in Developmental Disabilities,” in 2013, over 77 percent of people served by the developmental disabilities system in Ohio were in residential settings with six people or fewer (primarily supported living, or home and community-based services), while the remaining 23 percent were in settings with more than six persons. However, the greatest number of individuals in this category lived in 16-bed or larger ICFs. While the number of individuals living in small (six beds or less) settings has increased dramatically over the past years, the number of individuals living in large settings has decreased only marginally. Nevertheless, new ICF beds are not being added; Ohio has had a moratorium on institutional beds for the past several years.
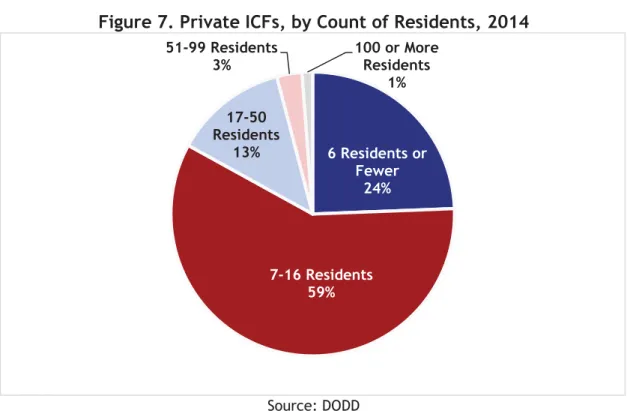
Of the approximately 420 private ICFs in operation in 2014, more than three-fourths were six beds or larger. In total, almost 3,000 individuals lived in facilities with over 16 residents, while only 529 were living in small, six bed or smaller, facilities.
5,109 25,412 3,068 2,871 11,713 11,626 5,000 10,000 15,000 20,000 25,000 30,000 35,000 40,000 45,000 1994 2011 Nu mb er of Re sid en ts Settings with 16 or more persons Settings with 7 to 15 persons Settings with 6 or fewer persons
20 2KLRDWD&URVVURDGV7KH'HYHORSPHQWDO'LVDELOLWLHV6\VWHPȽMarch, 2015
Figure 7. Private ICFs, by Count of Residents, 2014
Source: DODD
Figure 8. Residents, by size of Private ICF, 2014
Source: DODD
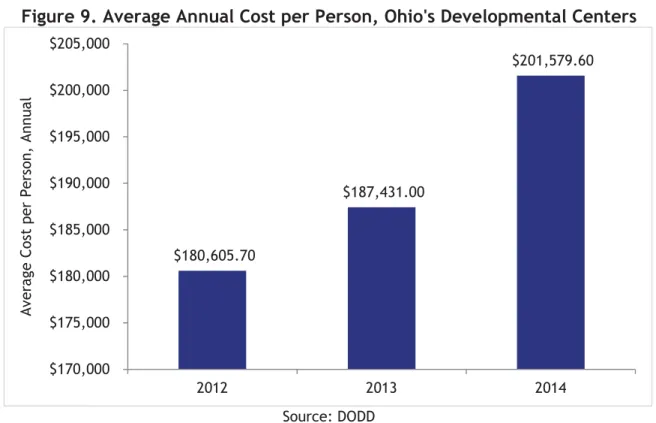
The average cost for a resident at an ICF in Ohio is about $101,000 per year, while the average cost for an individual living in a DC is much higher at about $200,000 per year.16
Reimbursement rates at private facilities are determined by a cost-based reimbursement
6 Residents or Fewer 24% 7-16 Residents 59% 17-50 Residents 13% 51-99 Residents 3% 100 or More Residents 1% 529 2,154 1,598 797 556 6 Residents or Fewer 7-16 Residents 17-50 Residents 51-99 Residents 100 or More Residents - 500 1,000 1,500 2,000 2,500 Pri va te IC F Si ze
www.CommunitySolutions.com 21 formula. Currently, beds are reimbursed, on average across the state, at the rate of $282.77 per bed per day; though the actual cost of providing services is likely slightly higher. Currently, local funding or outside fundraising may make up the difference. Asnearly everyone who is eligible for services at an ICF is also eligible, ICFs are almost exclusively Medicaid-funded, with the state responsible for covering the required nonfederal match. The daily cost of care varies greatly between ICFs and DCs, in part due to variation in wages paid to staff and variations in the needs of the populations served. Average costs per person at DCs have risen in part due to the falling number of DC residents.
Figure 9. Average Annual Cost per Person, Ohio's Developmental Centers
Source: DODD
Recent action by Disability Rights Ohio called into question the state’s heavy reliance on ICFs, which many believe promote segregation, impede the rights of those with developmental disabilities, and may violate federal law.17 Additionally, because the state pays the nonfederal Medicaid share, advocates emphasize the monetary incentive boards may have to continue to direct individuals into ICFs rather than more integrated, community-based facilities that are board-funded.
Home and Community-Based Residential Services
Despite a heavy reliance on institutions, many adults with developmental disabilities are able to live in a home setting, either alone, or with roommates or family members. Many home and community-based services (HCBS) that are available can be paid for using a Medicaid Waiver. Medicaid HCBS Waivers allow for states to make exceptions to federal Medicaid rules;
consumers “waive” their right to institutional care, allowing individuals with disabilities to receive care in their homes instead of in a long-term care facility. Waiver programs include services such as nonmedical transportation, employment and day services, nutrition assistance,
$180,605.70 $187,431.00 $201,579.60 $170,000 $175,000 $180,000 $185,000 $190,000 $195,000 $200,000 $205,000 2012 2013 2014 Av era ge C os t per Pers on , Annua l
22 2KLRDWD&URVVURDGV7KH'HYHORSPHQWDO'LVDELOLWLHV6\VWHPȽMarch, 2015 respite for caregivers, certain therapies, accessibility modifications, and personal care assistance. Waivers do not reimburse for room-and-board. Nursing services are a limited benefit available through the regular state Medicaid program.
Waiver services may be provided directly by county board staff or by local private providers. In some cases, these local waiver providers also operate ICFs, in addition to providing waiver services. Initially conceptualized to create cost savings, waiver services are intended to be more cost effective than facility-based residential services. According to the Legislative Service Commission Redbook (2016-2017), in 2014, the average monthly cost of an individual on an Individual Options Waiver was $5,721, while the average monthly cost of an individual in a state developmental center was $16,771.18 However, these savings are not always realized. While the average annual per-person waiver cost in 2014 was about $41,000, individual amounts can exceed $100,000 annually in some counties.
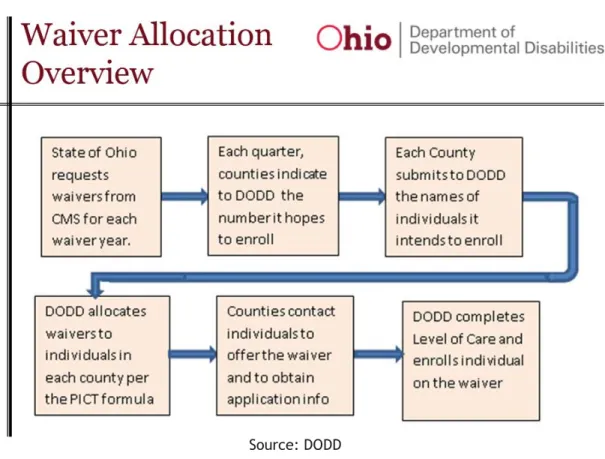
County boards are responsible for administering waiver programs, which are funded through Medicaid. However, unlike ICFs, the most commonly used waivers rely on a local match from county boards to cover the nonfederal share. The state requests a fixed number of waiver slots from the Centers for Medicare and Medicaid Services (CMS), which are allocated to counties by DODD. Each quarter, county boards make a request to DODD for the number of waivers they anticipate needing, though this can be amended as needed. Counties must identify those in the community who both want and need waiver services. DODD uses information provided by counties through the Planning and Implementation Component Tracking (PICT) tool to determine waiver distribution. If the state acquires new waivers, DODD makes adjustments using this information.
www.CommunitySolutions.com 23
Figure 10. Waiver Allocation Overview
Source: DODD
Each county has an established “floor,” or minimum number of waivers that it must offer (which assures that the waiver is “statewide”). Additional waiver allocation is intended to assure that there is proportionate access; however, this is partially determined by demand for services. The state’s waiver application specifies that “individuals who live in counties with longer waiting lists will be able to access waiver opportunities on a proportionately higher level as opportunities become available.”19
Ohio currently has four developmental disability waiver programs that serve people with different types and levels of need, including the Individual Options (IO) Waiver, the SELF (Self Empowered Life Funding) Waiver, Transitions DD(TDD) Waiver, and the Level One Waiver (see chart in Appendix II for details). The Ohio Department of Medicaid (ODM), as well as the Ohio Department of Aging also administer waivers for their consumers. The TDD Waiver is currently state-funded, as well as 1,500 Nancy Martin waivers3; county boards are responsible for the majority of the match for the other three waivers. Spending limits vary for each DODD waiver. The Level One Waiver has an annual limit of $5,000, with the possibility of adding small amounts to cover assistive technologies. The SELF Waiver has an annual limit of $25,000 for children and $40,000 for adults. The IO Waiver does not have an individual spending cap.
3The Nancy Martin Settlement (2007) was the result of a class-action lawsuit focused on congregate settings. It required Ohio to fund 1,500 IO Waivers to increase access to community-based services.
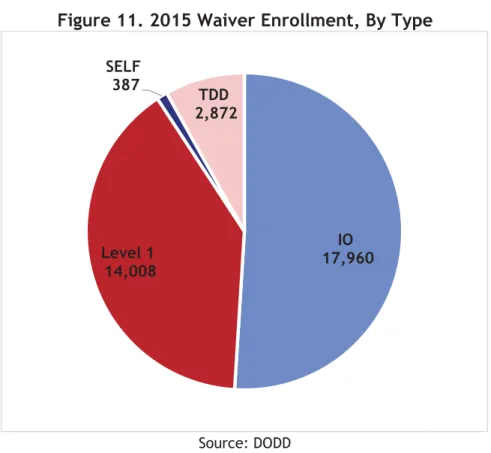
24 2KLRDWD&URVVURDGV7KH'HYHORSPHQWDO'LVDELOLWLHV6\VWHPȽMarch, 2015 According to data from DODD, as of February 2015, over 35,000 people were served through DD waivers. IO Waivers make up the largest portion of waiver enrollment across the state, then Level One Waivers, followed by state-funded TDD Waivers. SELF Waiver (the newest waiver) enrollment is currently the lowest, with 387 enrollees.20
Figure 11. 2015 Waiver Enrollment, By Type
Source: DODD
While eligibility (level of care) is the same for both ICFs and waiver services, the services covered are not comparable. ICF services are “bundled,” and intended to meet the full range of needs of their consumers, including room and board. However, waiver services are more limited. Nursing services are not currently covered under DODD waivers21 (except for the TDD Waiver, previously administered under ODJFS, and paid for by the state), and as
aforementioned, federal requirements prohibit waiver funds from reimbursing for room and board. Therefore, individuals living in the community with waivers typically rely on SSI (Supplemental Security Income)4, wages from employment, or financial support from families to pay for housing. Boards may also provide housing support in the form of rental assistance, depending on funding availability.
Since 2002, the number of waivers has quadrupled, rising from 7,797 to 35,200 waiver
participants in 2015. 22 DD waiver service reimbursement in Ohio totaled approximately $1.5 billion in 2014. In that year, the primary services supported through waivers were
homemaker/personal care services, adult day services, and nonmedical transportation. Both total waiver spending and total waiver recipients have increased since 2011, however the
4The maximum monthly SSI payment amount for 2015 is $733. The average monthly payment for an individual in 2014 was about $550.
IO 17,960 Level 1 14,008 SELF 387 TDD 2,872
www.CommunitySolutions.com 25 average per-person spending has decreased. This is largely to due to only a marginal increase in enrollment for costly uncapped IO Waivers and a greater increase in Level One Waivers (which have cost limitations). Combined IO and Level One per-person waiver spending decreased between 2011 and 2014 by nearly 7 percent, while participation increased by 23 percent. Advocates have expressed concern that, as a result of pressure to decrease waiting lists and an inability or unwillingness to tap local funds to cover the waiver match, individuals will be pushed onto less costly capped waivers, such as the SELF and Level One, which may not meet their full needs. A 2012 letter from Disability Rights Ohio (then Ohio Legal Rights Services) addressed to Department Director Martin at the time the SELF Waiver was introduced states: ”...due to matching-fund obligations, the system creates a perverse disincentive against expanding the availability of HCBS waivers for people with developmental disabilities in Ohio. Specifically, the use of local funding to match the cost of HCBS waivers (except Nancy Martin Waivers) while state funding is used to match the cost of expensive institutional care, encourages county boards of developmental disabilities to support institutional placements, thereby shiftingtheincreasedcosttothestate. Even in those situations in which county boards support community placement, thereisafiniteamount of
resourcesavailabletocountyboardsand therefore individuals will inevitably be induced into enrolling on the capped SELF Waiver rather than the uncapped I0 Waiver. This is a frightening prospect for the future of the IO Waiver specifically, and the developmental disabilities community in general. Indeed, many advocates are concerned that unless the state elevates the matching-fund obligation, the SELF Waiver will simply be a method to refinance individuals already enrolled on the IO Waiver, rather than a true effort to increase the total number of HCBS Waiver slots available in Ohio.”
26 2KLRDWD&URVVURDGV7KH'HYHORSPHQWDO'LVDELOLWLHV6\VWHPȽMarch, 2015
Figure 12. Total Waiver Reimbursement, by Waiver Type
Source: The Center for Community Solutions analysis of DODD data Note: Amount of reimbursement for SELF Waivers is too small to appear in chart.
Figure 13. Individuals Served on Waivers, by Waiver Type
Source: The Center for Community Solutions analysis of DODD data
Note: Amount of reimbursement for SELF Waivers is too small to appear in chart, but is labeled for 2013 and 2014. $0 $200,000,000 $400,000,000 $600,000,000 $800,000,000 $1,000,000,000 $1,200,000,000 $1,400,000,000 2011 2012 2013 2014 W ai ver Rei m burs ement Amo unt SELF Level 1 IO 9,594 10,985 12,043 12,894 16,770 17,230 17,729 18,039 90 236 5,000 10,000 15,000 20,000 25,000 30,000 35,000 2011 2012 2013 2014 Number o f Indi vi dua ls o n W ai ver Level 1 IO SELF
www.CommunitySolutions.com 27
Figure 14. Average Annual Per-Person Spending, by Waiver Type
Source: The Center for Community Solutions analysis of DODD data Data suggest that while the level of care for both waiver and ICF services is identical, impairment levels differ. According to data from 2007, of those with ID/DD living in ICFs, about 66 percent had profound or severe levels of impairment.23 In contrast, about 16 percent served on Level One and 23 percent on Individual Options Waivers had similar levels of impairment. And, 13 percent of those living in ICFs had mild levels of impairment, compared with 36 percent on IO Waivers and 35 percent on Level One Waivers. The exclusion of nursing services (except for the limited regular Medicaid benefit) in any current DD waiver surely affects these variances. However, these figures have implications for both the cost, and the delivery of HCBS services.
SELF Waivers, which are consumer-directed waivers, have received criticism from some and have experienced a lower than expected take-up rate, since while they have a higher cap than Level One Waivers, many boards find that they can be difficult to use. Others maintain that the SELF Waiver helps to promote consumer choice and independence, and can provide good middle-ground between Level One and costly uncapped IO Waivers.
Shared Living
“Shared living” arrangements, commonly referred to as adult foster care, are another non-institutional housing option for individuals with developmental disabilities. In shared living arrangements, the individual with a disability lives with one or more nondisabled adults, or a family, who are responsible for the individual’s care. Additional supports may also be available, such as community programming, transportation, or respite. Shared living homes are managed by local providers, who provide administration and support. The consumer’s income (typically SSI or earned income from work) covers the costs of room and board; waiver funds cover the
$59,838 $61,305 $62,274 $61,866 $11,385 $11,998 $12,063 $11,073 $3,928 $9,388 $0 $10,000 $20,000 $30,000 $40,000 $50,000 $60,000 $70,000 2011 2012 2013 2014 Av era ge Spendi ng per Pers on IO Level 1 SELF
28 2KLRDWD&URVVURDGV7KH'HYHORSPHQWDO'LVDELOLWLHV6\VWHPȽMarch, 2015 residential support services. The individual typically participates in many activities of the family’s daily life, while also enjoying relative independence. While the concept of community members opening their homes to adults with disabilities or illness is hardly new, currently, this strategy only accounts for about 6 percent of waiver service delivery in Ohio. However, efforts are underway to expand the program and recruit additional families to participate. The
Strategic Planning Leadership Group, a workgroup with representatives from DODD and DD stakeholder organizations, proposed to expand shared living to 25 percent of waiver
participants over the next 10 years.24 Proponents feel that for some individuals, shared living offers more stability compared to ICFs or supported living, where high staff turnover can be a factor, and can significantly increase opportunities for community experiences in integrated settings. Additionally, the model is cost efficient and allows for a great deal of independence. The administration is seeking to expand the availability of this option.
Skeptics question whether bringing the program to scale is a plausible solution, and challenge that there is insufficient capacity to provide the necessary oversight to protect an individual’s safety and wellbeing. The chances of social isolation may increase if the foster family is not as inclusive as they should be. Concerns about identifying a sufficient number of appropriate home providers also persist. Some question whether providers will take interest in the service, given the low-reimbursement rate. However, other states have seen significant success with this approach. For example, in Vermont, over 70 percent of individuals with disabilities who
receive home support live in shared living arrangements. 25 Waiver Challenges and Waiver Waiting List
Changes to Ohio’s waiver system are imminent both as a result of recent Medicaid rule change and state efforts to modify the option to increase participation. Waiver administration, funding challenges, and long waiting lists have received significant attention lately, especially as a result of the 2014 report “What Are We Waiting For? Waiver Supported Services Needed by
Individuals and their Caregivers,” released by the Ohio Developmental Disabilities Council and completed by the Ohio Colleges of Medicine Government Resource Center for Ohio. There is growing recognition that large scale change is necessary to reform the system.
While there is officially one statewide waiver waiting list, each county administers their own waiting list; as of October, 2014, there were over 45,000 people on waiting lists. According to the abovementioned waiver study, the median wait time across the state is about 6.4 years.26 This same study, however, concluded that over 45 percent of those waiting reported no current unmet need. According to the study authors, this suggests that many people sign up for waiver services in anticipation of future needs, perhaps as a result of historically long waits. Ultimately, the study reports that there are approximately 22,000 individuals with current needs waiting for services. The number of individuals on waiting lists varies significantly by county, but overall, DODD reports the statewide list grows by 100 to 200 individuals each month. In discussions conducted for this study, several counties indicated that they are only taking individuals off of the waiting list on an emergency basis or as other individuals with waivers no longer require these services, due to death or relocation. Others indicated that some individuals are receiving locally funded non-waiver services and the SSA disagreed with the need to expand their service
www.CommunitySolutions.com 29 offerings.5 Therefore, with new people joining the waiting list regularly, it is an uphill battle for boards to make meaningful decreases in the size of their waiting list.
Many factors contribute to long waiver waiting lists, including a lack of adequate local funds to make the match. As waiver costs are incurred throughout the year, boards are responsible on an ongoing basis for making the match for those with existing waivers. Additionally, costs can vary from year to year as an individual’s needs shift, making planning difficult. Declining or stagnant property values may also limit a board’s overall levy returns. Some boards’ levy revenues have been affected by the elimination of the tangible personal property tax and the phase-out of the state’s compensation for this lost revenue source. Limited local funds constrain the number of new waivers that a county can offer, and make significant waitlist reduction a challenge. There is currently a great deal of variability from county to county in the proportion of estimated individuals with developmental disabilities receiving waiver supports. As shown in Figure 15, even counties with aggressive use of waivers are reaching just over 50 percent of the total estimated population with developmental disabilities.
30 2KLRDWD&URVVURDGV7KH'HYHORSPHQWDO'LVDELOLWLHV6\VWHPȽMarch, 2015
Figure 15. Percentage of Individuals with DD Receiving Waiver Services
Source: The Center for Community Solutions; DODD; Miami University Scripps Gerontology Center However, the data demonstrate that funding alone does not determine waiver accessibility. County boards may elect to divert available funds to other programming, also a potential contributing factor. Given the many restrictions and requirements tied to waiver services, counties may be reluctant to expand their HCBS programs for fear of losing local control. Because IO Waivers are the most frequently utilized waiver, which are without an individual monetary cap, boards may be overly cautious to offer new waivers without knowing what their contribution will be in future years. Despite these dynamics, waiver growth has been significant in Ohio. Since 2011, Ohio has gained close to 5,000 waiver recipients, in spite of challenging economic times.
On average, in 2013, counties had about 1.5 people with developmental disabilities waiting for waiver services for every person receiving waiver services. Twenty-three counties had fewer people waiting for services than receiving waivers. Carroll County had the lowest ratio, where
www.CommunitySolutions.com 31 82 people were served by waivers, while only 26 people were actively on the waiting list. This is also one of the shortest lists. In contrast, 65 counties had more individuals waiting for services than receiving services, including 16 counties that had more than twice as many people waiting for services than actually receiving them. Trumbull County, in Northeast Ohio, had four times more people waiting for services than receiving them. And while distribution of waiver slots is meant to be determined in part by demand for services, many counties with sizeable waiting lists, including Franklin, Clark, Licking, and Trumbull, have a much higher proportion of people waiting than receiving services than the state average. These counties also have longer than average wait times.
Figure 16. Ratio of Individuals on Waiting List to
Individuals Receiving Waiver Services by County, 2013
32 2KLRDWD&URVVURDGV7KH'HYHORSPHQWDO'LVDELOLWLHV6\VWHPȽMarch, 2015
Conversions and Downsizing
DODD has recognized that there are many individuals living in ICFs who may be candidates to live in the community with supports and that the current funding mechanism doesn’t provide an adequate number of Medicaid waivers to meet the demand. According to a January, 2015 presentation by DODD Director John Martin to the Joint Medicaid Oversight Committee (JMOC), over 35 percent, or 2,500 individuals currently living in ICFs are waiting for waiver services.
To respond to this growing demand, the state is working to convert ICF beds to waivers.27 Relatedly, efforts are underway to decrease the size of large-bed facilities. Labeled
“rebalancing,” DODD has stated its intent to “increase the number of individuals who have the option to receive services in home and community-based settings,” though emphasizing that ICFs should remain available for short-term arrangements, respite services, or for individuals who may not be able to receive appropriate services in the community. DODD maintains that ICFs could have the potential to net cost savings for those who are able to avoid hospitalization.
Downsizing seeks to reduce the size of large facilities to eight beds or fewer. The process has often involved one facility splitting into two or more smaller facilities, though the total number of beds usually remains the same (the facility names may change). The goal is for settings to more closely replicate a home environment. Additionally, there is an emphasis on community integration, and moving away from campuses that may have multiple smaller structures segregated from other non-ICF buildings.
ICF providers are seeking greater financial incentives to convert and/or downsize, including assistance with the expected monetary loss resulting from closing facilities and already accrued capital debt, as well as a rate increase to offset the loss from conversion of beds or downsizing. Additionally, some providers seek to be more involved in deciding which individuals would benefit most from available waivers. The Executive Budget seeks to address these issues and incentivize downsizing, in part, through increasing rates for people with high acuity (to discourage enrolling individuals with less high needs) and by offering some debt forgiveness. Additionally, the Department seeks to make those in ICFs a priority for new waivers, and to require a recommendation from the county board before an individual enters an ICF to help ensure a proper placement. Bed buy-backs are also proposed, as well as other initiatives to speed up this process (see additional budget details later in the report).
In relation to the total number of ICF beds, the number of conversions and downsizings is very small. From 2013 to 2014, the number of private ICF beds decreased by 1.5 percent to 5,634 beds. Since 2012, 2.8 percent of ICF beds (157) have been approved for conversion; however, only 67 of these have been completed (1.2 percent of beds). In terms of downsizings, 478 beds (8.5 percent of beds) have been approved for downsizing, but only 44 (0.8 percent) have been completed.
Likewise, the number of beds being converted to waivers, or being downsized, at any given facility is small. The median number of beds approved for conversion per facility is two, while
www.CommunitySolutions.com 33 the median number of beds approved for downsizing per facility is seven. Many advocates in the developmental disabilities community feel these efforts have been too slow and inadequate.
Figure 17. Conversions and Downsizings, 2012-2014
Source: The Center for Community Solutions analysis of DODD data
Questions remain about the impacts of waiver conversion and downsizing, particularly around the issue of room and board. As waivers do not cover these costs, there is concern about the housing needs of those who transition out of ICFs, without additional dollars being allocated for this expense. The governor’s 2016-2017 budget proposal includes the addition of funds for rental assistance for those leaving ICFs; however, the details were not clear at the time of publication. Additionally, some have questioned the long-term financial implications of downsizing and conversions, as waiver costs for those transitioning out of full-time care could be significant.