Abstract—Temperature dependence of specific retention
volumes ( o g
V
) of 13 volatile organic compounds (VOCs) of environmental importance between the gas and liquid stationary phase (polydimethysiloxane) (PDMS) were studied using the gas liquid chromatographic technique (GLC). Temperature was varied from 303.15K to 423.15K to allow transport calculations for different seasons. Four PDMS polymers with average molecular weight ranging from 760 to 13 000 were used as solvents. The results of this work confirm that PDMS is well suited for VOCs scrubbing from waste gas
streams. Linear plots of log
V
gagainstT
1
were obtained in all cases permitting predictions and interpolations to temperatures not studied here. Also dependable enthalpies and entropies of solute transfer from the mobile phase to the stationary phase can be calculated. The specific retention volumes reported in this work are in agreement with literature for similar systems. Efforts were taken to ensure the best possible accuracy and trace the possible sources of error. A gas liquid chromatographic system which secured a simple retention mechanism and showed reproducible solute retention over a long period of time was devised.
Index Terms—Environmental, scrubbing, specific retention volume, stationary phase, waste gas streams
I. INTRODUCTION
The interaction between volatile organic compounds and polydimethylsiloxane in the form of specific retention volumes (
V
go) at varying temperatures is presented in this study. Many polymeric solvents such as polydimethylsiloxane (PDMS) may play critical roles in in the absorption of volatile organic compounds from contaminated air streams. In order to effectively use PDMS in the scrubbing of volatile organic compounds it essential to know how they interact with these compounds. The important measure of this property is given by the specific retention volume (V
go) or the activity coefficient at infinite dilution (γ
i∞). Specific retention volumes can be used through the reduction of infinite dilution activity coefficients to design separation processes where the trace components or impurities have to be removed. The GLC is suitable forManuscript received September 6, 2011; revised October 18,2011. The authors are with the Department of Chemical Engineering, Faculty of Engineering and the Built Environment, University of Johannesburg, Doornfontein, Johannesburg 2028, (e-mail: emuzenda@ uj.ac.za; mail: fntuli@ uj.ac.za)
.
measuring specific retention volumes because of the small vapour pressure of PDMS. The procedure of the measurement in particular, the effect of flow rate of carrier gas, effect of sample size, and liquid loading were previously investigated [1, 2].
The specific retention volume is defined as the net retention volume per gram of stationary phase at 00C. This is very important because it allows the comparison of retention data obtained at different temperatures with different weight of stationary phase. Specific retention volumes were introduced by [3]. Reference [3] suggested their use in place of partition coefficients in vapour identification. Reference [3] measured specific retention volumes for a series of alcohols, aromatic hydrocarbons, and esters in silicone 702 – fluid and tritolyl phosphate. Reference [4] measured specific retention volumes using GLC for polydimethysiloxane – hydrocarbon systems at 298, 313 and 328K. The carrier gas flow rate was varied from 18 to 120 cm3 per minute and it was found to have no effect on the specific retention volumes. Reference [5] obtained specific retention volumes for polydimethysiloxane – hydrocarbon systems in four columns with different liquid loading. Experimental temperature and flow rate were varied from 298 – 343K and 70 to 120ml/min respectively. Reference [6] reported replicate gas – liquid chromatographic based specific retention volumes, activity coefficients and interaction parameters of ten solutes with polydimethylsiloxane at 303K.
Though inconclusive, the effects of temperature on retention data in particular Kovats indices have been investigated and debated for a long time [7]. Almost linear dependence of retention data for non-polar solutes on non-polar phases have been reported [7]. The Antoine type (which is nonlinear) shows better performance for wide temperature range for systems involving non polar solutes on polar stationary phases [7]. There have also been numerous studies of temperature effects on solute retention in reversed phase liquid chromatography (RPLC). Linear Van’t Hoff plots were observed in the typical RPLC systems as reported and cited [8]. In these studies the enthalpies of solute transfer from the mobile phase to the stationary phase were calculated from the van’t Hoff plots. Nonlinear plots are often observed when the temperature range is more than 318K. Usually the temperature dependency of the specific retention volumes is expressed as
Q
T
P
V
g
=
+
1
ln
0 (1) whereR H P
s Δ −
= \ (2)
Temperature Effect on Volatile Organic Compounds –
Polydimethylsiloxane Interactions
R
S
M
R
Q
s sΔ
+
=
ln
273
(3)where R is the universal gas constant,
M
sis the molecular mass of the stationary phase.Δ
H
s andΔ
S
sare respectively, the standard molar enthalpy and entropy of solution for the transfer of a mole of solute, from the ideal gas where its partial pressure is 1 atm, in the stationary phase, where its mole fraction isx
=
1
. The molecular interactions and the environment are similar to that of an infinitely dilute solution.II.METHODOLOGY
The apparatus used have been described previously [1], [2], [9]-[11]. The carrier gas was helium. A constant sample size of 0.1
μ
l
was injected into the columns at constant flow rate of 35.97ml/min. Measurements were made at temperatures varying from 303.15K to 423.15K. Special care was exercised to control and determine the system temperature accurately.A. Materials
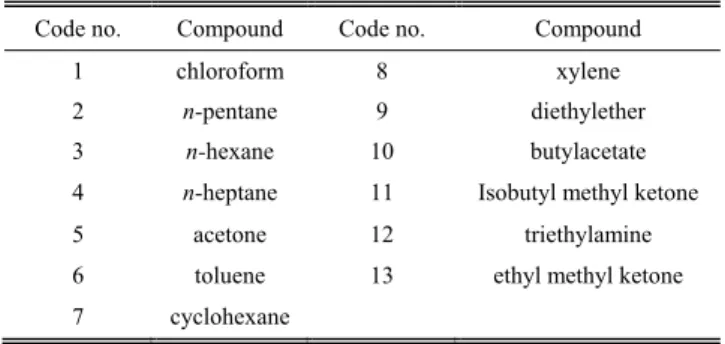
The materials used have been described previously [1], [2], [9] - [11]. The thirteen solutes used in this work were coded numerically as in TABLEII for simplicity.
TABLEII:SOLUTE DESCRIPTION AND CODE
Code no. Compound Code no. Compound
1 chloroform 8 xylene
2 n-pentane 9 diethylether
3 n-hexane 10 butylacetate
4 n-heptane 11 Isobutyl methyl ketone 5 acetone 12 triethylamine 6 toluene 13 ethyl methyl ketone
7 cyclohexane
B. Column Preparation
Polydimethylsiloxane (PDMS) was coated into Chromosorb P, AW - DMCS or Chromosorb W, AW – DMCS (acid washed, dimethylchlorosiloxane treated) from a solution in chloroform. Details of column preparation are shown in Table 1.
TABLE I:DESCRIPTION OF COLUMNS
Properties Column 1 Column 2 Column 3 Column 4
Length, m 1 1 1 1
Chromosorb W or P,g 6.158 7.291 7.186 4.86
PDMS,g 0.688 0.825 0.804 0.54
Wt % PDMS 10.05 10.16 10.06 10
Viscosity of PDMS, cp 5 10 50 500
Mw of PDMS 760 1000 3200 13000
C.Calculations
The primary GLC data are the retention time, which is the time taken by the component to traverse through the column
and the retention volume
V
R , the volume of carrier gas passing through that time. The net retention volumeV
N, is defined as in (4), whereV
gasis the volume of gas in the column (gas hold-up). The gas hold up volume is a measure of total volume of space available to the mobile phase in the system, that is the column dead volume, injector and detector volumes and volumes of any connecting tubing for example from column to detector. In a well designed system, the extra dead volume is small compared to the column void volume.gas R
N
V
V
V
=
−
(4) In gas-liquid columns the gas hold-up contributes 1 to 10 percent of the total retention volume. The homologous series method was used in this work because of the sensitivity of the flame ionization detector at low concentrations of the organic compounds. The time the non sorbed molecule takes to traverse through the column is given as in (5)2 3 1 2 3 1
2
2 R R R R R RM
t
t
t
t
t
t
t
−
+
−
=
(5)The retention time
t
Ris made up oft
M, the time the solute spends in the mobile phase andt
s, the time the solute spends in the stationary phase. Separations are due to different times solutes spend in the stationary phase. The adjusted retention volume is given by (6).M R R o
R
F
t
V
V
V
'=
'=
−
(6)The corrected retention volume,
V
Ro which takes into account the compressibility of the gaseous mobile phase, is given in (7).R o
R
j
V
V
23
=
(7)The factor
j
32 (7) corrects for the influence of pressure along the column and is given in (8).⎥ ⎥ ⎦ ⎤ ⎢ ⎢ ⎣ ⎡ − ⎟⎟ ⎠ ⎞ ⎜⎜ ⎝ ⎛ ⎥ ⎥ ⎦ ⎤ ⎢ ⎢ ⎣ ⎡ − ⎟⎟ ⎠ ⎞ ⎜⎜ ⎝ ⎛ = 1 1 2 3 3 2 2 3 o i o i p p p p j (8)
The relationship between the net retention volume
V
N and the carrier gas flow rate at the column outletF
oand the retention timest
R andt
M for absorbed solute and carrier gas respectively is given in (9).(
R M)
o
N
j
F
t
t
V
=
2−
3 (9) The specific retention volume, corrected to 0o, is given in
(10).
c s
N o
g
W
T
V
In (7-10),
j
32 is the gas compressibility factor,F
o is volumetric carrier gas flow rate at column outlet temperature and pressure, ml/min;t
R−
t
M is the retention time, i.e., the time difference between air and solute peaks, min;T
c is column temperature, oK
;W
sis weight of polymer in the column, g;p
i andp
o are inlet and outlet pressures respectively. The use of the flame ionization detector permitted the application of the mathematical air peak method to approximate air peak maximum. To account for the gas holdup in the column, the retention time was taken as the difference between the maxima of the air and solute peaks [12].III. RESULTS AND DISCUSSION
A. Variation of Specific Retention Volumes from Literature Findings
The solute specific retention volumes reported in Table 3 were calculated from corrected peak retention times using the well known expression of [3]. The retention times used in the calculation of specific retention volumes were averages of five measurements. Individual values of retention times were found to vary by no more than 1% in all cases. Specific retention volumes reported in this work compare very well with literature findings. The successful comparison gives an indication of the GLC as a rapid, simple and accurate method for studying the thermodynamics of the interaction of a volatile solute with a nonvolatile solvent.
TABLEIII:VARIATIONOFSPRCIFICRETENTIONVOLUMESFROM LITERATUREFINDINGS(PDMSMW
≈
3200)Specific retention volumes
Code Temp (K) This work Literature
%
Variation Source 1 303 188.2 181.7 3.4 [6]
2 303 69.9 66.1 5.7 [6]
313 47.8 47.7 0.3 [6]
333 24.9 24.8 0.7 [3]
3 303 192.0 179.2 7.1 [6]
313 126.2 124.2 1.6 [14]
333 58.8 60.9 3.5 [3]
4 303 508.3 482.5 5.3 [4]
313 294.6 290.8 1.3 [14]
333 146.8 144.3 1.7 [14]
6 303 796.5 791.1 0.7 [6] 313 529.1 516.6 2.4 [4]
323 300.2 269.2 11.5 [4]
7 303 336.8 315.1 6.9 [4] 333 103.4 106.0 2.5 [3]
8 303 2645.6 2654.6 0.3 [13]
313 1223.6 1187.5 3.0 [4]
333 516.3 536.5 3.8 [14]
4.2 Temperature Dependence of Specific Retention Volumes
The specific retention volumes of chloroform, pentane,
hexane, heptane, acetone, toluene, cyclohexane, xylene, diethyl ether, butyl acetate, isobutyl methyl ketone, triethylamine and ethyl methyl ketone were measured by injecting a constant amount of sample of 0.1
μ
l
into the four columns. Measurements were done at constant mean flow rate of 35.97ml / min and the temperature was varied from 303.15 to 423.15K. Chromatographic retention data from variable temperature runs may be used to estimate thermodynamic properties according to the well-known Van’t Hoff relation [8] using (11).φ
ln
/
/
ln
k
'=
−
ΔΗ
RT
+
Δ
S
R
+
(11) where
φ
is the phase volume ratio and R is the gas constant. The linear portions of these plots give enthalpies(
ΔΗ
/
RT
)
and entropies( )
Δ
S
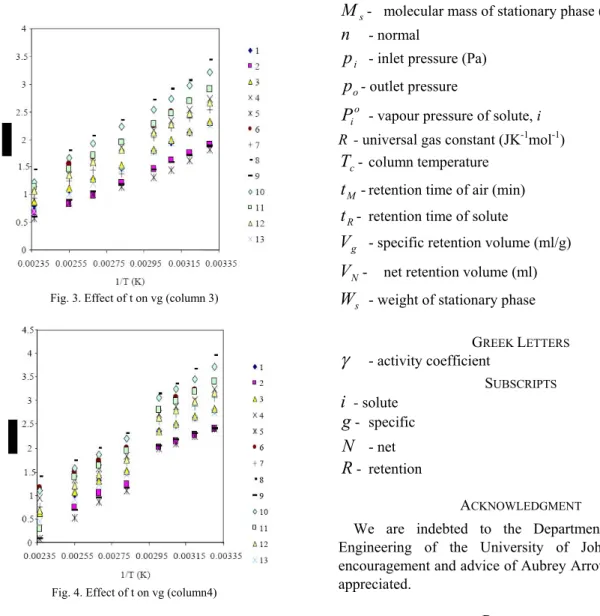
for the transfer of one mole of solute into the stationary phase. All the Van’t Hoff plots obtained in this study were linear, and the regression correlation coefficients were better than 0.999 in all cases. Typical Van’t Hoff plots are shown in figures 1 to 4. The trends obtained here are similar to those observed by [8], [15] – [21].The choice of the optimum temperature for the absorption process requires knowledge of temperature dependence of the activity coefficient. The derived Infinite dilution activity coefficients [2], [9] – [11] calculated from the specific retention volumes reported in this study show that the higher the temperature the higher the activity coefficients. This tendency is very favorable for desorption, because higher values at higher temperature would ease regeneration.
Fig. 1. Effect t on vg (column 1)
Fig. 3. Effect of t on vg (column 3)
Fig. 4. Effect of t on vg (column4)
I. CONCLUSION
Specific retention volumes for 13 volatile organic compounds in polydimethylsiloxane were measured over the temperature range from 303.15 K to 423.15K using the gas liquid chromatographic technique. Good linear relationships were observed on the plots of log Vg versus
1
T
. This can be used to predict the specific retention volumes and hence infinite dilution activity coefficients at temperatures not considered in this study. The measurements were highly reproducible with relative standard deviation and coefficient of variation in the determination of specific retention volumes of 0.00013 and 0.013 respectively. The close agreement of the specific retention volumes obtained in this study with those reported in literature proved that a sound technique was developed.NOMENCLATURE
o
F
- carrier gas flow rate (ml/min) hH
Δ
- standard molar enthalpy (Jmol-1K-1) sH
Δ
- standard molar entropy (Jmol-1mol-1)2 3
j
- gas compressibility factor 2M
- average polymer molecular weight (g/mol)s
M
- molecular mass of stationary phase (g)n
- normal ip
- inlet pressure (Pa) op
- outlet pressure oi
P
- vapour pressure of solute, i R - universal gas constant (JK-1mol-1)c
T
- column temperature Mt
- retention time of air (min) Rt
- retention time of solute gV
- specific retention volume (ml/g) NV
- net retention volume (ml) sW
- weight of stationary phaseGREEK LETTERS
γ
- activity coefficientSUBSCRIPTS
i
- soluteg
- specificN
- netR
- retentionACKNOWLEDGMENT
We are indebted to the Departments of Chemical Engineering of the University of Johannesburg. The encouragement and advice of Aubrey Arrowsmith is greatly appreciated.
REFERENCES
[1] E. Muzenda, A. Arrowsmith, and N. Ashton, “Study of the Effects of Experimental Variables in Solute Retention Volumes by Gas Liquid Chromatogrphy (glc) in Polymer Solution Thermodynamics,” in
Proc.61st Annu. Session of the Indian Institute of Chemical Engineers, Chandigarh, 2008, pp. 1-8.
[2] E. Muzenda, M. Belaid, and F. Ntuli, “Measurement of Infinite Dilution Activity Coefficients of Selected Environmentally Important Volatile Organic Compounds in Polydimethylsiloxane using Gas – Liquid Chromatography,” Kor. J. Chem. Eng, vol. 27, no. 5, pp.1509-1512, May 2010.
[3] A. B. Littlewood, C. S. G. Phillips, and D. T. Price, “The Chromatography of gases and vapours Part V: Partition analysis with columns of Silicone 702 and Tritolylphosphate,” J. Chem. Soc, pp. 1480-1489, 1955.
[4] R. N. Lichtenthaler, R.D. Newman, and J. M. Prausnitz, “Specific retention volumes from Gas – Liquid Chromatography for Polydimethylsiloxane Hydrocarbon Systems,” Macro, vol. 4, no. 4, pp. 650-651, 1973.
[5] W. R. Summers, Y. B. Tewari, and H. P. Schreiber, “Thermodynamic Interaction in Polydimethysiloxane – hydrocarbon Systems from Gas – Liquid Chromatography,” Macro, vol 5, no. 1, pp. 11 – 16, 1972. [6] A. J. Ashworth, C. F. Chien, D. L. Furio, D. M. Hooker, M. M. Kopecni,
R.J. Laub, and G. J. Price, “Comparison of static with gas-chromatographic solute infinite-dilution activity coefficients with polydimethylsiloxane solvent,” Macro, vol. 17, no. 5, pp. 1090 – 1094, 1984.
[7] K. Heberger, M. Gorgenyi, and T. Kowalska, “Temperature dependence of Kovats indices in gas chromatography revisited,” J. Chromatog. A. vol. 973, pp. 135-142, 2002.
[9] E. Muzenda, M. Belaid, F. Ntuli, and A. Arrowsmith, “Absorption of Volatile Organic Compounds in Silicon: “Determination of Infinite Dilution Activity Coefficients by Dynamic Gas Liquid Chromatographic Technique,” in Proc. of the 8th WCCE 2009, Montreal, Quebec, Canada, 2009.
[10] E. Muzenda, A. Arrowsmith, and N. Ashton, “GLC as an optimization technique,” in Proc. 5th International Conference on Manufacturing Process Systems and Operations Management in Less Industrialised Regions, Bulawayo, 2002.
[11] E. Muzenda, A. Arrowsmith, and N. Ashton, “Measurement of Infinite Dilution Activity Coefficients for Volatile Organic Compounds in Polydimethylsiloxane by Gas Liquid Chromatography,” in Proc.61st
Annu. Session of the Indian Institute of Chemical Engineers, Chandigarh, 2008, pp. 1-8.
[12] H. Purnell, Gas Chromatography, John Willey and Sons, 1962. [13] D. D. Deshpande, D. Patterson, H. P. Schreiber, and C. S. Su,
“Thermodynamic Interactions in Polymer Systems by Gas – Liquid Chromatography. IV. Interactions between Components in a Mixed Stationary Phase,” Macro, vol. 7, no. 4, pp. 530-535, 1974.
[14] O. Smidsrod and J. E. Guillet, “Study of polymer interactions by gas chromatography,” Macro, vol. 2, pp. 272-278, 1969.
[15] B. Sellergren and J. H. Shea, “Origin of peak asymmetry and the effect of temperature on the solute retention in enantiomer separations on imprinted chiral stationary phases,” J. Chromatography A, vol. 690, pp. 29-39, 1995.
[16] K. Bay, H. Wanko, and J. Ulrich, “Absorption of Volatile Organic Compounds in Biodisel: Determination of Infinite Dilution Activity Coefficients by Headspace Gas Chromatography,” Inst. Chem. Eng. Trans IChemE. vol. 84, no. A1. pp. 22-28. 2006.
[17] U. Domanska, and A. Marciniak, “Measurements of activity coefficients at infinite dilution of aromatic and aliphatic hydrocarbons, alcohols, and water in the new ionic liquid [EMIM] [SCN] using GLC,” J. Chemical Thermo, vol 40. pp. 860-866, 2008. [18] E. Tudor, “Temperature dependence of the retention index for
perfumery compounds on a SE – 30 glass capillary column I. Linear Equations,” J. Chromatography A, pp. 779. 287-297, 1997.
[19] E. Tudor and D. Moldovan, “Temperature dependence of the retention index for perfumery compounds on a SE – 30 glass capillary column II. The hyperbolic equation,” J. Chromatography A. vol. 848, pp. 215-227. 1999.
[20] C. S. Lee and W. J. Cheong, “Thermodynamic properties for the solute transfer from the mobile to the stationary phase in reversed phase liquid chromatography obtained by squalane – impregnated C18 bonded phase,” J. Chromatography A. vol. 848. pp. 9-20, 1999. [21] M. Makela and L. Pyy, “Effect of temperature on the retention time
reproducibility and on the use of programmable fluorescence detection of fifteen polycyclic aromatic hydrocarbons,” J. Chromatography A. vol. 699, pp. 49-57,1995.
Edison Muzenda is the Research and Postgraduate Coordinator and Head of the Environmental and Process Systems Engineering Research Unit in the Department of Chemical Engineering at the University of Johannesburg. This author became a member (M) of IAENG in 2010. Dr Muzenda holds a BSc Hons (ZIM, 1994) and a PhD in Chemical Engineering (University of Birmingham, Birmingham, United Kingdom, 2000). He joined the University of Johannesburg, Johannesburg, South Africa on the 1st of November 2007.
He has more than 15 years’ experience in academia which he gained at different Institutions: National University of Science and Technology Bulawayo, University of Birmingham, Bulawayo Polytechnic, University of Witwatersrand and University of Johannesburg. He is a recipient of several awards and scholarships for academic excellence. His research interests are in energy, environment, waste utilization, phase equilibrium as well separation processes. He has published more than 75 international peer reviewed papers in international scientific journals and conferences. He serves as reviewer of a number of reputable international conferences and journals. He has also chaired several sessions at International Conferences. Dr Muzenda is an associate member of the Institution of Chemical Engineers (IChemE); member of Water Institute of Southern Africa (WISA) and member of the World Academy of Science, Engineering and Technology (WASET)’s International Scientific Committee, Scientific and Technical Committee & Editorial Review Board of Natural and Applied Sciences. Dr Muzenda is the Africa Representative and International Scientific Secretariat for the World Academy of Science, Engineering and Technology.
Freeman Ntuli is a Senior Lecturer in the Department of Chemical Engineering at the University of Johannesburg, South Africa. This author became a member (M) of IAENG in 2009. He holds a PhD in Chemical Engineering from the University of Cape Town, South Africa (2008). His main areas of research are in hydrometallurgy, crystallization and environmental process engineering. His specific research activities involve gaseous reduction processes, leaching processes, reduction crystallization, modeling of particulate processes, wastewater characterization and treatment.