Abstract—Several types of liquefaction technologies have been extensively utilized to convert raw natural gas into a liquid state known as- Liquefied Natural Gas or LNG. Selecting a specific liquefaction technology – e.g. APCI C3-MR, Conoco
Philips Basic Cascade Process, Shell DMR, or Linde Mixed Fluid Cascade Process- varies from one LNG plant to the next. This paper presents the simulation of C3-MR and Cascade pure
refrigerant process – likely technology for Timor LNG – by using Aspen Hysys V7.3 on the basis of Peng-Robinson equation of state. Both processes were simulated based on data of natural gas temperature, pressure, composition and flow rate. These data were obtained from an LNG Plant – “Timor LNG” that is planned to be built in Timor-Leste. During the simulations the effects were analyzed by examining specific horse power, LNG production and revenue of LNG derived from both processes. The analysis of specific horse power on the liquefaction process for C3-MR and pure refrigerant shows that using pure
refrigerant has lower specific horse power than C3-MR by 69%.
However, LNG production capacity of simulated processes shows that C3-MR has higher production capacity per train of
(2.86 MTPA/Train) than pure refrigerant cascade which is (2.64 MTPA/Train). Also the revenue of LNG for C3-MR process
exceeded that of pure refrigerant cascade by 94%. In order to better understand the liquefaction process, this paper also discussed the thermodynamic analysis of liquefaction plant.
Index Terms—Liquefaction, C3-MR, cascade, LNG
production, LNG specific power.
I. INTRODUCTION
Petroleum resources have been the most important factor in Timor-Leste’s economy as it fuels more than 90% of government budget to run the state. And this trend of relying on petroleum derived revenues is expected to remain within the foreseeable future. Revenues from oil and gas already comprise 50% of the country’s Gross National Income (GNI) and supply more than 90% of its government revenues. To date, this is entirely from offshore, upstream development, with downstream processing done in other countries. It is the hope of many Timorese, including the Timor-Leste Government, that Timor-Leste will soon receive revenues from downstream (refining, processing and gas liquefaction). The most likely near-term possibility for this is an undersea
Manuscript received January 20, 2014; revised March 19, 2014. Clementino Pereira is with the Graduate internship program at Ministry of Petroleum and Mineral Resources, Dili, Timor-Leste (tel.: +67076166231; e-mail: [email protected]).
Domingos Lequisiga is with Gas Business Unit of TIMOR GAP, E.P., the National Oil Company (NOC) of Timor-Leste, Timor Plaza – Level 3, Rua Presidente Nicolao Lobato, Comoro, Dili, Timor-Leste (tel.: +6703310953; e-mail: [email protected]).
pipeline from the Greater Sunrise gas field to the shore of Timor-Leste, with a Liquefied Natural Gas (LNG) liquefaction plant to be built and specialized LNG port to load the products for shipping overseas [1]. An LNG plant – “Timor LNG” – is to be built in Beaço, District of Viqueque. The feed gas will be piped from Greater Sunrise and other adjacent gas fields through a world class subsea pipeline(s) [2].
Natural gas (NG) is the fastest growing fossil fuel. It is predicted that by 2030 NG will grow to a 37% share of fossil fuels in power generation from 30% in 2013. It is continued to grow due to the clean environmental advantages of natural gas over other fossil fuels and its superior thermal efficiency when used in power generation [3]. Natural gas is the mixture of methane, ethane, propane, butane, etc., and methane accounts for about 80% of these components, and normal boiling point is about –162oC [4]. LNG occupies approximately 1/600th of the volume of natural gas thereby creating more options for shipment and storage [5].
The researches and developments of LNG were started in the 1960s. D. L. Andress of Phillips company described about development of Optimized cascade process, [6] Kikkawa et al.
simulated mixed refrigerant liquefaction process using pre-cooing loop and expander with CHEM CAD software, [7] Terry et al. analyzed and compared representative liquefaction process with Hysys software, [8] Wen-Sheng Cao et al. simulated liquefaction process using refrigerant which mixed nitrogen and methane with Hysys software, and then compared performances with mixed refrigerant liquefaction process. [9] In the Korea, Yoon et al. simulated cascade process with Hysys software, and then offered basic data to this research. [10]
In this paper, the simulation of C3-MR and Cascade process
are studied in order to analyze the performance of both processes through simulation with Aspen Hysys V7.3 to secure competitiveness in the industry of natural gas liquefaction plant.
II. LIQUEFACTION PROCESS
A. C3-MR (Propane Mixed Refrigerant) Process
The two refrigeration cycles present in the C3-MR process
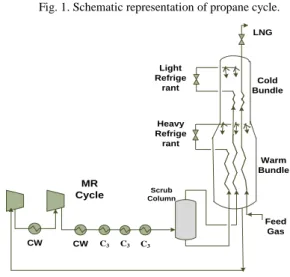
is the propane cycle, illustrated in Fig. 1, and the mixed refrigerant cycle, illustrated in Fig. 2. The propane cycle precools the natural gas to about –35oC and partially condenses the mixed refrigerant in the propane kettles and the mixed refrigerant cycle provides the required cooling in the MCHE to liquefied natural gas at –160oC. Power is delivered to the cycles by the gas turbines and helper motors [11], [12].
Technical Evaluation of C
3
-MR and Cascade Cycle on
Natural Gas Liquefaction Process
Compressor
Condenser
V-1 E-1
V-3 E-3 V-2
E-2
Fig. 1. Schematic representation of propane cycle.
LNG
Scrub Column
Feed Gas MR
Cycle
Heavy Refrige rant Light Refrige
rant BundleCold
Warm Bundle
CW CW C3 C3 C3
Fig. 2. Diagram of mixed refrigerant cycle.
B. Basic Cascade Process
This process consists of three pure refrigerants which have different boiling temperatures, such as methane, ethylene and propane, illustrated in Fig. 3. First of all, natural gas is cooled to –35oC in the propane cycle, then it is cooled to –90oC in the ethylene cycle, finally it is liquefied to –155oC in the methane cycle [13].
NG LNG
Propane Ethylene
Methane
Fig. 3. Diagram of basic cascade cycle.
Feed Gas LNG
Low Pressure High Pressure Compressor
Expansion Valve Condenser Cooling
Water
Qc
Main Heat Exchanger
Evaporating Refrigerant Condensing Refrigerant
Fig. 4. Flow diagrams for single cycle refrigeration system.
Although the thermodynamic principles of liquefaction and
refrigeration process are quite similar, the designing of the two systems are different. The refrigeration process/cycle for liquefaction of natural gas involves some equipment in which refrigerant is compressed, cooled to reject heat at ambient conditions and expanded to produce refrigerant capacity required. In refrigeration cycles which operate as close loop, refrigerants are constantly circulating as working fluid and there is no accumulation or withdrawal of refrigerant from the cycle. The diagram showing a simple refrigeration circuit is given in Fig. 4. The system comprises of four components evaporator, compressor, condenser and throttling valve.
The refrigerant is in closed circuit and circulated by compressor. By keeping the pressure of refrigerant low in evaporator, the refrigerant boils by absorbing heat from the fluid to be cooled and at the same time it continues to remove the vaporized refrigerant and compresses it to the condensing pressure. The condensing pressure must be higher enough to make refrigerant condensed at ambient conditions using water or air. Ambient temperature must be less than the critical temperature of the refrigerant to effect condensation using the environment as a coolant. The temperature of the evaporator is usually near the normal boiling point of the refrigerant, so the pressure of the evaporator may be approximately atmospheric. The throttling valve maintains a pressure difference between the higher and lower side of the refrigeration cycle [14]. The pressure of the refrigerant is then let down in an expander or flash valve to a low pressure. Its temperature also decreases as a result of reduction in pressure. The refrigerant is sent through the main heat exchangers where it cools and liquefies the natural gas to produce LNG. Note that the work supplied to the refrigeration cycle increases with the temperature lift (difference from evaporating to condensing temperature) [14].
III. OPERATING DATA/SOLUTION TECHNIQUES The compositions of natural gas to be piped from the offshore Greater Sunrise entering the onshore plant are shown in Table I. These data were obtained from the study report of Conceptualization and Cost Estimation for a LNG plant in Timor-Leste [2].
TABLEI:FEED CONDITIONS
Component NG Composition (%)
C1 84.1560
C2 4.8823
C3 2.1352
iC4 0.5328
nC4 0.7583
iC5 0.0400
CO2 4.4531
H2O 0.0000
N2 3.0423
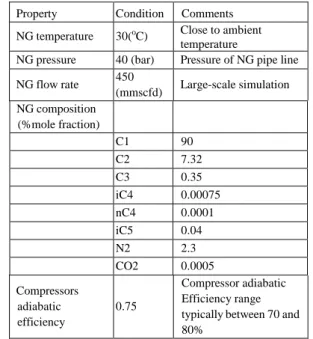
The detailed study for the gas processing in Timor-Leste LNG plant is yet to be undertaken and hence definitive pressure and temperature for dry gas entering the LNG plant may vary significantly. However, in this paper, LNG feed gas temperature and pressure entering the liquefaction unit is assumed to be 30oC and 40 bar. The feed gas mass flow is assumed to be 450 mmscfd.
Feed to LNG Plant is composed primarily of methane, together with ethane, propane, butane and heavier hydrocarbon components. Non-hydrocarbon components such as nitrogen, carbon dioxide, hydrogen sulphide and mercury are also usually present. Typical LNG feed gas composition entering the liquefaction unit is assumed as shown in Table II.
The Aspen Hysys V7.3 simulation software on the basis of Peng-Robinson equation of state was used to obtain the specific horse power, LNG production and revenue of LNG by inputting the composition, temperature and pressure required.
TABLEII:TYPICAL LNGFEED GAS COMPOSITION AND OTHER ASSUMPTION
Property Condition Comments
NG temperature 30(oC) Close to ambient temperature
NG pressure 40 (bar) Pressure of NG pipe line
NG flow rate 450
(mmscfd) Large-scale simulation NG composition
(%mole fraction)
C1 90
C2 7.32
C3 0.35
iC4 0.00075 nC4 0.0001 iC5 0.04
N2 2.3
CO2 0.0005
Compressors adiabatic efficiency
0.75
Compressor adiabatic Efficiency range typically between 70 and 80%
IV. RESULTS AND DISCUSSION
The comparison of specific powers of the C3-MR and Pure
refrigerant Cascade liquefaction processes is presented in Fig. 5 and Table III.
The presented comparison is based on natural gas supplied at pressure 40 bar, temperature of 30oC and molar flow rate of 450 mmscfd.
Fig. 5 show that C3-MR process has the higher specific
power than the pure refrigerant Cascade process. The specific power of C3-MR process exceeded that of pure refrigerant
Cascade process by 69.47%. The Specific horse power of C3-MR Process is high due to higher compressor work. That
means the requirement of refrigerant to cool natural gas is increased.
The results of simulation showed that the compressor work for C3-MR and Pure Refrigerant Cascade process are
147,669hp and 81,660hp respectively. One of the factors that affect the increasing in compressor work is feed gas
temperature [14]. An increase in feed gas temperature increase compressor work that means more power is needed to drive the compressor.
TABLEIII:THE COMPARISON OF THE SPECIFIC HORSE POWER
Processes Specific horse power
(kWh/MMBTU-LNG) Percentage difference (%)
C3-MR 5.83 169.47%
Pure refrigerant
Cascade 3.44 100%
Fig. 6 shows the graph of specific horse power against temperature for C3-MR and Pure Refrigerant Cascade
processes.
The specific horse power increases linearly as the feed natural gas temperature increases. By considering 30oC and 40 bar as reference point, the graph shows that an increase in natural gas supply temperature increase specific power and vice versa for both process. However, the specific horse power for Pure Refrigerant process less than that of C3 -MR
process.
According to Alessandro et al. [16], the advantages of using cascade cycles is more convenient for the liquefaction of natural gas. It requires fewer amounts of refrigerants due to the less heat required to exchange in the evaporators. Moreover, the work required is less and as a consequence of these two effects, the COP of the cycle is improved greatly. Thus, it can be concluded that in pure refrigerant Cascade has lowerspecific power compared to C3-MR.
C3-MR and Pure Refrigerant cascade process. Fig. 5. The comparison of the specific power.
The comparison of LNG production of the C3-MR and Pure
refrigerant Cascade liquefaction processes is presented in Fig. 7 and Table IV.
TABLEIV:THE COMPARISON OF THE LNGPRODUCTION
Process
LNG Production (MTPA/train)
Percentage Difference (%)
C3-MR 2.86 100
Pure refrigerant
Cascade 2.64 92.31
Fig. 7 shows that C3-MR process has higher production
capacity compared to pure refrigerant Cascade process. The C3-MR production capacity exceeded that of pure refrigerant
Cascade process by 92.31%.
However, Fig. 8 will help us to better understand the trend and why the C3 -MR LNG production capacity is higher than
pure refrigerant cascade process. It shows the graph of LNG production capacity against pressure for C3-MR and Pure
Refrigerant Cascade processes. It can be noted that the LNG production increases while increasing the natural gas feed pressure for both processes. This is understandable because at high pressure the necessary cooling temperature is higher, so the natural gas can be cooled easier. The increment in LNG production for C3-MR and pure refrigerant cascade process
are 11.45% and 9.72% respectively from PNG=20 bar to
PNG=60 bar.
Fig. 8. The effect of natural gas inlet pressure on LNG production for C3 - MR and pure refrigerant cascade process.
According to Orji [17], LNG production rate increased with increase in pressure of the NG feed and decreased with decrease in pressure of the NG feed. This is confirmed in the work done by Jørgen [18]. Increase in the mixed refrigerant
pressure caused a subsequent increase in the LNG production rate. This is caused by the heat exchange that takes place inside the heat exchanger between the pre cooled mixed refrigeration gas and the feed natural gas [19].
The Revenue of LNG calculation can be generated by using many different methodologies. In this paper, the method used to calculate the Revenue of LNG can be formulated by the following equation (Matheson, 2013) [20].
$ / MMBTU MMSCFD BTU/SCF Natural gas Value =
1 MMBTU / MMBTU
where MMBTU is millions of British thermal unit, MMSCFD is millions of standard cubic feet per day and BTU/SCF are the gas gross heating value.
Natural gas is purchased in terms of gas quality for heating (MMBTU). And then the revenue of LNG can be achieved by assuming the selling cost per MMBTU of LNG is $12/MMBTU. High heating value will result in high LNG production and consequently increase revenue of LNG.
The simulations of C3-MR and pure refrigerant cascade
processes showed that the heating value for both processes at given temperature 30oC, pressure 40 bar and flow rate of 450 MMSCFD are 448,185 MMBTU LNG and 424,722 MMBTU, respectively.
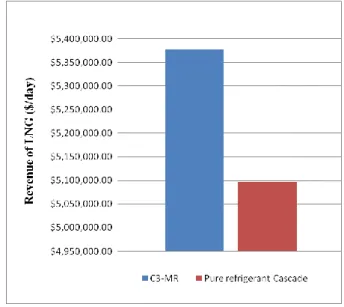
The comparison of revenue of LNG of the C3-MR and Pure
refrigerant Cascade liquefaction processes is presented in Fig. 9 and Table V.
The C3-MR process has higher revenue of LNG compared
to pure refrigerant Cascade process where the revenue of LNG for C3-MR process exceeded that of pure refrigerant
cascade by 94%.
Fig. 9. The comparison of the revenue of LNG.
TABLEV:THE COMPARISON OF THE REVENUE OF LNG Process
Revenue of LNG ($/day)
Percentage difference (%)
C3-MR 5,377,983.71 100
Pure refrigerant
Cascade 5,096,664.12
94
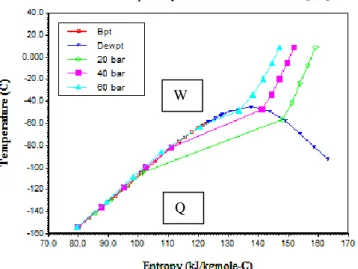
In-depth thermodynamic analysis is conducted in order to provide better understanding of the process.
because of compressor work (area W) in Fig. 10 is increased and there is some increase on the amount of heat required to be removed from natural gas (area Q). In addition, an increase in feed gas pressure results in an increase of LNG production and revenue of LNG because at higher pressures the feed gas liquefies at higher temperatures (with smaller enthalpies of condensation) and lower refrigeration duty which is more efficient.
On the other hand, an increase in feed gas temperature results in an increase in specific horse power because at higher temperatures the work supplied to the refrigeration cycle increases and compressor work (area W) will be increased which leads to higher specific horse power. Thermodynamically it is useful to liquefy natural gas at highest possible pressure and lowest temperature so that work can be saved and consequently reduce the heat load [14].
Fig. 10. Temperature entropy of natural gas with area showing heat removed (Q) and ideal work for reversible C3-MR liquefaction process (W)
V. CONCLUSION The conclusion of this study includes:
1) The specific power of Cascade pure refrigerant is lower than that of C3-MR process by 69.47%. Thus, Cascade
pure refrigerant is preferred technology in terms of specific power.
2) The LNG production of C3-MR process is higher than
that of Cascade pure refrigerant by 92.31%.
3) The revenue of LNG of the C3-MR and pure refrigerant
Cascade processes show that C3-MR has higher revenue
compared to the Cascade pure refrigerant process. 4) LNG production and revenue of LNG of C3-MR process
is higher than pure refrigerant Cascade process. The LNG production and revenue of LNG for C3-MR process
are 2.86 MTPA/train and $5,377,983.71/day and 2.64 MTPA/train and $5,096,664.12/day for pure refrigerant Cascade process.
From the thermodynamic point of view, it is useful to liquefy natural gas at highest possible pressure and lowest temperature so that work can be saved and consequently reduce the heat load and increase LNG production capacity and revenue of LNG
Based on the simulation results, C3-MR process may be
deemed as the preferred technology for liquefaction process although the simulation was made merely based on three
parameters; i.e. specific horse power, LNG production and revenue of LNG. However, other parameters such as type of refrigerant used, plant capital cost, driver availability, heat exchanger type and surface area, etc. should also be taken into consideration prior to making a final decision.
NOMENCLATURES Q Refrigeration duty (KW) S Specific entropy (KJ/Kg K) W Work input (KW)
Ws Specific power for liquefier, KWh/tonne ABBREVIATIONS
C3-MR Propane precooled mixed refrigerant
Cw Cooling water
COP Coefficient of performance MR Mixed refrigerant
LNG Liquefied natural gas PNG Natural gas pressure
NG Natural Gas PR Propane
MCHE Main cryogenic heat exchanger MTPA Million Tons per Annum NGL Natural Gas Liquid
MMSCFD million metric cubic feet per day MMBTU Millions British thermal unit BTU British thermal unit
SCF Standard cubic feet GHV Gross Heating Value
LMTD Log Mean Temperature Difference $ Dollar
% Percentage
ACKNOWLEDGMENT
The authors wish to acknowledge the financial support provided by the Ministry of Petroleum and Mineral Resources, the Government of Timor-Leste. The authors also would like to thank TIMOR GAP, E.P. for supplying natural gas data as the basis for simulations in this study.
REFERENCES
[1] L. Hamutuk. (2008, February). Sunrise LNG in Timor-Leste. Dreams, Realities and Challenges. LNG report. [Online]. pp. 3-23. Available: http://www.laohamutuk.org/Oil/LNG/LNGReportLoRes.pdf [2] Conceptualization and Cost Estimation for LNG plant in Timor-Leste,
GS Engineering & Construction, KBC Advance Technology Pte Ltd,
February 2010.
[3] M. Michot, Introduction to LNG, Centre for Energy Economics, The University of Texas at Austin, 2012.
[4] S. G. Lee and Y. M. Yang, “The state of art of LNG Liquefaction Plant Technologies,” in Proc. The 3rd Korean Congress of Refrigeration,
vol. 3, pp. 65-68, 2009
[5] S. L. Sakmar, “The globalization and environmental sustainability of lng: is lng a fuel for the 21st century?” presented at World Energy Congress, Montreal, Canada1, September 12-16, 2010
[6] D. L. Andress, “The Phillips optimized cascade lng process a quarter century of improvement,” The Permission of the Institute of Gas Technology, 1996
[7] Y. Kikkawa et al., “Development of liquefaction process for natural gas,” Journal of Chemical Engineering of Japan, vol. 30, no. 4, pp. 625-630, 1999.
[8] L. Terry, “Comparison of liquefaction process,” LNG Journal, vol. 21, no. 3, pp. 28-33, 1998.
W
[9] W. Cao et al., “Parameter comparison of two small-scale natural gas
liquefaction process in skid-mounted packages,” Applies Thermal Engineering, no. 26, pp. 898-904, 2006
[10] S. T. Oh et al., “Simulation of LNG liquefaction cycle using two stage intercooler,” in Proc. KIGAS Spring Conference, pp. 225-228, 2009. [11] P. Bosma and R. K. Nagelwort, “Liquefaction technology:
developments through history,” in Proc. the first Annual Gas Processing Symposium, Doha, Qatar, 2009, pp.1-13.
[12] D. E. Brandt and R. R. Wesorick, “GE Gas turbine design philosophy,”
GE Industrial & Power Systems Schenectady, NY, GER-3434D, 1994. [13] M. Konoglu, “Exergy analysis of multistage cascade refrigeration cycle used for natural gas liquefaction,” International Journal of Energy Research, vol. 26, pp. 763-774, 2000.
[14] M. R. Agrawal “Dual mixed refrigerant cycle for gas liquefaction,” Patent, filed December 9, 1998 with application No.09/208,562. [15] Conceptual Study and Cost Estimate Subsea Pipeline from Greater
Sunrise to Timor-Leste, State Secretariat for Natural Resources, Timor-Leste, September 2010.
[16] A. Trigilio, “Modeling and Simulation of Natural Gas Liquefaction Process,” Thermodynamics and Transport Phenomena Department, Simon Bolivar University, 2013.
[17] E. Orji, “Simulation optimal operation and self-optimization of TEALARC LNG plant,” Specialization Project spring, Norway, 2009.
[18] J. B. Jørgen and S. Skogestad, “Optimal operation of a simple LNG process,” presented at International symposium on advance control of chemical process, Adchem, 2008.
[19] H. Paradowski and J. P. Dufresne, “Process analysis shows how to save energy,” Hydrocarbon processing, pp. 103-108, July, 1983.
[20] Matheson. (2013). The BTU Accuracy Connection to Profitability and How to Achieve Improvements. Ask the gas professionals. [Online]. Available:
https://www.mathesongas.com/pdfs/litCenter/SpecEquipmentDataSh eets/1496BTU-TB362.pdf.
Clementino Pereira received his bachelor degree in chemical engineering from National Institute of Technology, Durgapur, India, in 2009, his MT in chemical engineering, University of Indonesia, Depok, Indonesia, in 2013. His research interests are on modeling and simulation of natural gas technology, transportation and Utilization of natural gas.