Web Surveys Optimized for Smartphones:
Are there Differences Between Computer
and Smartphone Users?
Ioannis Andreadis
Aristotle University of Thessaloniki
Abstract
This paper shows that computer users and smartphone users taking part in a web survey optimized for smartphones give responses of almost the same quality. Combining a design of one question in each page and innovative page navigation methods, we can get high quality data by both computer and smartphone users. The two groups of users are also compared with regard to their precisely measured item response times. The analysis shows that using a smartphone instead of a computer increases about 20% the geometric mean of item response times. The data analyzed in this paper were collected by a smartphone-friendly web survey. All question texts are short and the response buttons are large and easy to use. As a result, there are no significant interactions between smartphone use and either the length of the question or the age of the respondent. Thus, the longer response times among smartphone users should be explored in other causes, such as the likelihood of smartphone users being distracted by their environment.
Keywords: web surveys, mobile surveys, AJAX navigation, data quality, item response times, smartphones
Direct correspondence to
Ioannis Andreadis, Laboratory of Applied Political Research, Department of Political Sciences, Aristotle University Thessaloniki, 46 Egnatia St., Thessaloniki, 54625 Hellas (Greece)
E-mail: [email protected]
1 Introduction
The aim of this paper is to study the differences between computer and smart-phone users when they complete web surveys optimized for smartsmart-phones. The comparison is done on two dimensions. The first dimension refers to the quality of the responses, e.g. the frequencies of no answers or neutral responses. The second dimension refers to the time the respondents spend to answer the questions, i.e. the item response times.
The most recent studies on the effects of mobile use on data quality report limited differences between mobile and computer respondents. Mavletova (2013), analyzing an experiment in Russia, reports that computer respondents type lon-ger responses on open-ended questions. One the other hand, she finds that mobile and computer users have similar levels of socially undesirable and non-substantive responses. In addition, the two groups do not differ significantly in terms of pri-macy effects. De Bruijne and Wijnant (2013) after running an experiment with par-ticipants randomly assigned to three modes (mobile, computer and a hybrid) have not found any significant differences. Toepoel and Lugtig (2014) have not found differences between mobile and desktop users with regard to item nonresponse, the length of answers to a short open-ended question and the number of responses in a check-all-that-apply question. Finally, Wells, Bailey, and Link (2014) have ran-domly assigned roughly 1,500 online U.S. panelists and smartphone users to either a mobile application or a computer. They have not found any significant response-order effects across modes. However, they report that computer respondents pro-vide significantly longer responses than mobile respondents.
2 Designing for Smartphone Users
Previous studies on measurement effects have found minimal differences between mobile and computer respondents. The most challenging difference concerns the length of open-ended responses. Nowadays, people become more and more expe-rienced in typing texts using the small keys of their smartphones. Nevertheless, it is still much easier to type using a regular full-size keyboard than using a keypad on a mobile device. As a result, we should continue to expect longer responses on open-ended questions by computer users, especially when the response needs more than 3-4 words.
A good web survey design can remove most of the remaining differences. Sur-vey design always plays an important role. According to Stapleton (2013), horizon-tal orientation of response choices may increase satisficing by smartphone users, i.e. they are more likely to select one of the first response choices. Vertical scrolling seems to be better than horizontal scrolling. In fact, Mavletova and Couper (2014) argue in favor of using a vertical scrolling design and they report that it leads to significantly faster completion times, and fewer technical problems. As they argue, the smaller number of interactions with the server reduces the risk of dropped con-nections. On the contrary, Wells, Bailey, and Link (2014) argue in favor of minimal vertical scrolling and support the idea of using one question per page, short ques-tions and short sets of response lists.
A solution that gets the best from both worlds is the use of Asynchronous JavaScript and XML (AJAX) technology. By using AJAX, survey designers can display one question per page while minimizing the risk of failed connections with the server. This is achieved by downloading all pages to the users’ browser during the first connection with the server. Then, AJAX takes care of the navigation from page to page. In that way, there is only a second and final connection with the server when the user submits the completed questionnaire. Furthermore, with AJAX tech-nology we avoid any lags between pages1. This means that we can have accurate
measurement of the time spent between clicks.
3 Data
The findings presented in this paper are based on the analysis of the paradata col-lected in May 2014 by the Greek Voting Advice Application (VAA) HelpMeVote - VoteMatch Greece (Andreadis, 2013). Voting advice applications are special types of opt-in web surveys that help users find their proximities with the political parties.
These applications can attract thousands or even millions of users during the pre-electoral period. HelpMeVote is the Greek partner in the multi-national European project VoteMatch (votematch.eu). The target of this project is to run VAAs for the European Parliament elections.
HelpMeVote follows the best practices used in both web and mobile survey design. It runs both on computers and on smartphones. It automatically scales to any screen size and it supports both touch and mouse events. It displays one ques-tion per page and supports AJAX navigaques-tion. It uses large font size, short texts and the response options are displayed vertically with large buttons.
The questionnaire includes 31 Likert type questions. Each question is displayed on a separate page. Respondents have six answer choices: there are five buttons to express their level of agreement with a statement and a “No answer” button. When a respondent clicks on a button, the timestamp is recorded in a hidden input field and the user is forwarded to the next page. Besides the 31 main questions, Help-MeVote users are asked to fill-in a form. This form includes questions about their gender, age group, education level, and voting behavior. Finally, HelpMeVote cap-tures the user-agent header field, which enables the detection of the users’ browser and device type (i.e. smartphone, computer, etc). When the respondent submits the survey, everything is stored to a database. Thus, each database record includes the user responses, the timestamps and the device type.
The HelpMeVote/VoteMatch Greece dataset includes about 80,000 completed questionnaires. The largest part of the dataset consists of computer users (80.7%) and smartphone users (13.5%). The rest of the respondents have used other mobile devices (mostly tablets). The focus of this paper is on the comparison between smartphone and computer users when both groups use a smartphone-friendly web survey. Therefore, users of other mobile devices were not included in the analysis.
4 Methods and Variables
4.1 Quality of Responses
HelpMeVote does not include any open-ended items. Thus, the hypothesis that com-puter respondents provide longer responses cannot be tested. One the other hand, computer and smartphone users of HelpMeVote can be compared for other data quality patterns.2 For instance, if smartphone users selected more non-substantive
responses (i.e. “Neither agree nor disagree” or “No answer”) than computer users, this would suggest that smartphone users provide data of lower quality. Similarly
smartphone users can be tested for primacy effects (i.e. selecting the first response choice more often) or any other response-order effects.
When a chi-square test is applied on a large sample, it will almost always give a small p-value. Even when there is no practical difference between expected and observed frequencies, the test will reject the hypothesis of independence. In addi-tion, running a separate test for each of the 31 items included in HelpMeVote would result in multiple comparisons and incorrect rejection of the null hypothesis. Thus, it would be more likely to classify nonsignificant differences as significant.
The aforementioned problems are avoided by creating six new variables. The value of each new variable reflects the number of times the respondent has cho-sen the corresponding response option (“Frequency of Strongly Disagree” to “Fre-quency of Strongly Agree” and “Fre“Fre-quency of No Answer”). The range of values of these new variables is from 0 to 31. Each of these variables takes the minimum value (0) when the respondent does not select the corresponding answer in any of the 31 questions. Similarly, it takes the maximum value (31) when the respondent selects the same answer for all questions. With these variables it is easy to analyze mode effects between mobile and computer users. For instance, a comparison of the average values of the variable “Frequency of Strongly Disagree” between mobile and computer users will show if there is a different primacy effect between modes. Similarly, a comparison of the average values of the variables: “Frequency of Nei-ther agree nor disagree” and “Frequency of No Answer” between the two groups will reveal if smartphone users select non-substantive responses more often than computer users.
5 Item Response Times
The analysis of item responses times is much more complicated for two reasons. First, item response times depend on characteristics of both the respondents and the items. As a result, there is a need for a multi-level analysis of the item response times. Second, there is need for data cleaning in order to deal with extremely short or extremely long item response times.
5.1 Multilevel Model
there are examples of reversed roles, i.e. the respondents are nested within items (Swanson et al., 2001). Using a non-hierarchical model would underestimate the standard errors of regression coefficients and make nonsignificant coefficients to appear as significant (Hox, 2002; Gelman & Hill, 2006).
For the multilevel analysis, the dataset has to be reshaped in its long format. This way, each of the about 80,000 cases is multiplied by 31 (i.e. the total the num-ber of the items). The outcome of this procedure is a dataset of about 2.5 million cases. Analysis of this huge dataset is difficult even when a strong workstation is used. To overcome this problem, a random sample corresponding to 10% of the complete dataset was selected. The distributions of the main variables are very similar in the sample and in the initial dataset. Replications of the same analysis presented in this paper on other 10% random samples have given very similar find-ings. The used sample is available by OpenICPSR (Andreadis, 2014b).
5.2 Data Cleaning
Andreadis (2012, 2014a) proposes a method to flag items that were responded in extremely short time. The method is based on the types of reading and the corre-sponding reading speeds presented by Carver (1992). Scanning is the fastest type of reading. When respondents scan a question, they do not dedicate adequate time to understand the meaning of the text. In addition, according to Bassili and Fletcher (1991), answers to simple attitude questions take between 1.4 and 2 seconds. Add-ing the minimum needed time to read and comprehend a question and the mini-mum needed time to answer the question, we get the following formula: threshold = 1.4+[number of characters in the item]/39.375. Users with extremely short times in more than one third of their responses were removed from the dataset. This deci-sion is justified on the hypothesis that these users have responded without paying attention to the questions; these users usually maintain the same attitude through-out the questionnaire.
5.3 Other Data Preparations
In the following models the logarithm of the response times is used as the depen-dent variable (i.e. the outcome). Since the main task of this paper is to compare the response times between smartphone and computer users, the binary variable “smartphone” is included into the model as the main treatment variable. This vari-able gets the value 1 if the respondent is a smartphone user and the value 0 if the respondent is a computer user.
The control variables on the user level are the following: education, gender, age, political interest and a variable (Decided) that gets the value 1 if the respon-dents had already made their vote choice when they used the VAA and 0 other-wise. Education is used as a categorical variable with five levels: Primary, Lower secondary, Upper secondary, Tertiary and Postgraduate studies. Primary educa-tion is used as the reference level and all other levels are compared with it. The expectation is that the higher the education levels are, the less the response time should be. The remaining variables are used as dummy variables. Gender gets the value 0 for female and 1 for male respondents. Some studies have found that female respondents spend more time on web surveys, thus a similar finding is expected from the present analysis. Age gets the value 1 if the respondent is older than 49 years old, and 0 otherwise. According to the literature, older people are expected to spend more time than younger people. For the analysis of item response times, the cases with missing values on the demographic variables have been filtered out. There are two reasons which give support to this decision. First, the percentage of missing values is small. Second, the application of advanced imputation methods, such as imputing the missing value with the predicted value of a regression, would be challenging. Demographic variables (e.g. age) may serve as good predictors of some attitudinal variables (e.g. more conservative views). Trying the opposite, i.e. using attitudinal variables to predict demographic variables would be odd, because attitudinal variables do not have an impact on demographics, such as age or gender. The variable political interest gets the value 1 if the respondent has indicated an interest in politics. Citizens interested in politics and voters who have already decided about their vote choice should be more familiar with the major issues of the electoral competition. Thus, they are expected to have a clear, pre-formulated opinion about the statements. As a result, they are expected to need less time than people not interested in politics and people who had not decided about their vote choice when they used HelpMeVote.
are on national issues. Thus, they are expected to need more time to express their opinion on EU issues.
6 Findings
6.1 Quality of Responses
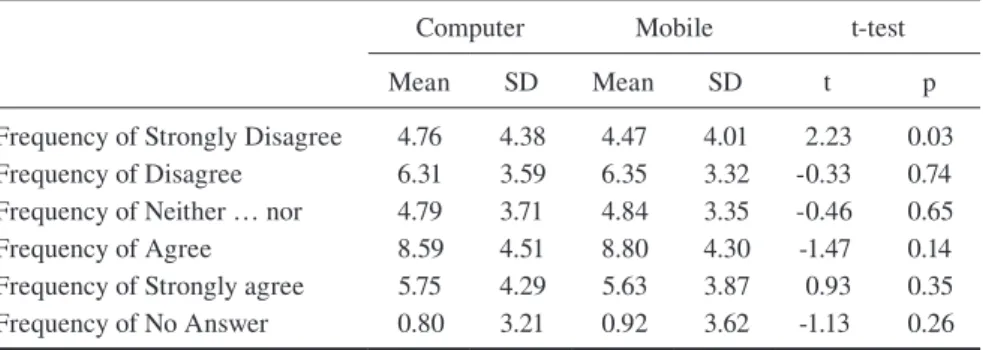
Table 1 shows the mean values estimated over the 31 Likert type items of the fre-quencies of each response option. The p-values in this table show that even with a huge sample of thousands of cases, none of the differences between modes are significant at the 0.01 significance level. At the 0.05 level, one of the differences would be considered as statistically significant, but its magnitude is small and less important for any practical purpose.
The average smartphone respondent and the average computer respondent give similar answers. Both of them select the answer “Strongly Disagree” in 4-5 questions, the answer “Disagree” in 6-7 questions, the answer “Neither … nor” in 4-5 questions, the answer “Agree” in 8-9 questions and the answer “Strongly Agree” in 5-6 questions.
The lack of significant measurement effects is consistent with the findings of previous studies, discussed in the previous sections. According to the t-test output presented in Table 1, there are no significant differences in responses across modes in terms of primacy effects or of response-order effects in general. In addition, there are no significant differences in non-substantive responses across modes. Of course, these findings are not based on an experiment. HelpMeVote users are free to choose the device they use. Thus, it is possible that the effects of self-selection and measurement differences counteract.
6.2 Item Response Times
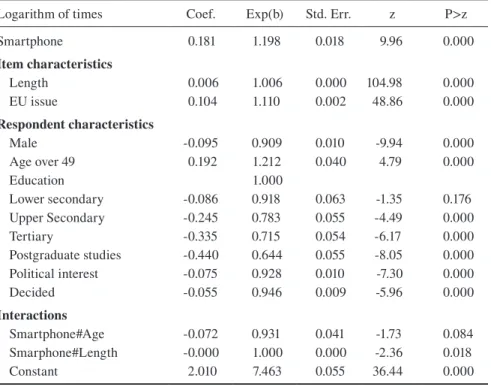
Table 2 shows the multilevel regression model for the logarithm of item response times. The table includes the estimated coefficients and the exponential coefficients along with the outcome of the significance tests. Since the dependent variable is the logarithm of the item response times, the interpretation of the estimated regression coefficients is the following: Suppose that the estimated coefficient for an independ-ent variable X is b. This means that when X increases by one unit the logarithm of the item response time is expected to increase by b units. Consequently, the item response time will be multiplied by eb. According to Table 2 the constant term of
the model is estimated at 2.01. This is the expected mean of the logarithm of the item response times. The exponential value of 2.01 is 7.47. This is the geometric mean of item response times, i.e. the average respondent needs about 7.5 seconds to respond to one item.
The interpretation of the coefficient of the treatment variable shows the impact of using a smartphone on the response times: the coefficient is 0.181 and its expo-nential value is 1.198. This means that switching from computer to smartphone the geometric mean of response times is expected to increase by 19.8%. An estimate of the treatment effect in seconds is given by the following calculation: 7.47*19.8%=1.5 seconds. This means that the average smartphone user spends about 1.5 seconds more than the average computer user on an item.
The coefficient for the length of the statement is 0.006 and its exponential value is 1.006. This means that, while holding all other predictors constant, for every additional character in the question, the geometric mean of response times increases by 0.6%. According to the model, if a statement refers to a EU policy issue the respondents need more time to give their answer. The corresponding coefficient is 0.104 and its exponential value is 1.11 showing an 11% increase in the geometric mean of response times when switching from a national issue to a EU issue.
Table 1 T-tests for the estimation of mode (computer vs mobile) effects
Computer Mobile t-test
Mean SD Mean SD t p
Frequency of Strongly Disagree 4.76 4.38 4.47 4.01 2.23 0.03 Frequency of Disagree 6.31 3.59 6.35 3.32 -0.33 0.74 Frequency of Neither … nor 4.79 3.71 4.84 3.35 -0.46 0.65
Frequency of Agree 8.59 4.51 8.80 4.30 -1.47 0.14
The coefficient for male is -0.095 and its exponential value is 0.909. This means that the geometric mean of response times in the group of men is 90.9% of the geometric mean of response times in the group of women. In other words, switch-ing from female to male respondents, the response time is expected to decrease by 9.1%. Following the same model, when we switch from undecided people to people who have already made their choice the geometric mean of response times decreases by 5.4%. Similarly, moving from people who are not interested in politics to people who are interested in politics the geometric mean is expected to decrease by 7.2%. One the other hand, the exponentiated coefficient for older people is 1.21 showing a 21% increase in the geometric mean of response times when switch-ing from younger people to users over 49 years old. Finally, when we switch from primary education to higher education levels, the response time decreases; only the difference between primary and lower secondary education is not statistically significant. The largest difference is observed between the two extreme education levels: the ratio of geometric means between postgraduate studies and primary edu-cation is 0.64 indicating that the time spent by the most educated users is 64.4% the time spent by the less educated users, i.e. a decrease of 35.6%.
Table 2 Multilevel model coefficients and exponential coefficients
Logarithm of times Coef. Exp(b) Std. Err. z P>z
Smartphone 0.181 1.198 0.018 9.96 0.000
Item characteristics
Length 0.006 1.006 0.000 104.98 0.000
EU issue 0.104 1.110 0.002 48.86 0.000
Respondent characteristics
Male -0.095 0.909 0.010 -9.94 0.000
Age over 49 0.192 1.212 0.040 4.79 0.000
Education 1.000
Lower secondary -0.086 0.918 0.063 -1.35 0.176
Upper Secondary -0.245 0.783 0.055 -4.49 0.000
Tertiary -0.335 0.715 0.054 -6.17 0.000
Postgraduate studies -0.440 0.644 0.055 -8.05 0.000
Political interest -0.075 0.928 0.010 -7.30 0.000
Decided -0.055 0.946 0.009 -5.96 0.000
Interactions
Smartphone#Age -0.072 0.931 0.041 -1.73 0.084
Smarphone#Length -0.000 1.000 0.000 -2.36 0.018
Finally, the model includes the interaction terms between smartphone use and age, and smartphone use and the length of the question. None of these interaction terms have a significant impact on the item response times at the 0.01 significance level. If the time difference was caused by an unfriendly design, this difference would probably be higher in older people. But the interaction between smartphone use and age is not significant. Therefore, the longer time of smartphone users can-not be attributed to the unfriendliness of the web survey. The lack of a signifi-cant interaction between smartphone use and the length of the question does not allow the attribution of the longer times of smartphone users to the smaller display of their devices. This was an expected finding because the survey was carefully designed to fit on the small screens of mobile devices. Thus, all questions are short and the variability of their length is small.
6.3 Validity of the Model and Sensitivity Analysis
According to Table 3, the variance of the random intercept is 0.11 and the estimated error variance is 0.2. The likelihood ratio test shows that the random intercept vari-ance is large. This verifies that the decision to use a multilevel model was correct. Indeed, if a single level model had been used, non significant differences (e.g. the response time difference between primary and lower secondary education levels) would appear as significant.3
7 Discussion
This paper advances mobile survey research in various ways. Firstly, it shows that creating a web survey suitable for both smartphone and computer users involves good design choices. These designs choices (such as the one question per page design) facilitate mobile users to give responses that do not differ from the responses given by computer users. In addition, a good survey design results in high quality data from both groups of users. As the findings presented in this paper show, the data quality of smartphone respondents does not differ significantly from the data quality of the computer respondents. In both groups the level of the data quality is very high and there are no signs of satisficing.
The lack of data quality differences presented in this paper is not based on an experiment. Respondents self-select the device they use to participate in Help-MeVote. Thus, the effects of self-selection may counteract any measurement dif-ferences. It is reasonable to believe that respondents have chosen the device that they feel more comfortable to use, and they use it without problems. If the devices were assigned to respondents randomly, the findings could be different. This is a limitation of the presented study. However, the focus of this paper is not on what would happen in a lab after forcing respondents to use a specific device. The focus is rather on what happens in the real world, where respondents are free to choose the device they prefer.
Secondly, this paper offers an innovative method to prepare a dataset of response times for statistical analysis by treating the low and the high extreme val-ues differently. It shows how to flag users who have been answering so fast that they should be removed by the dataset. Moreover, it proposes a way to deal with the extremely large response times by identifying the actual extremes instead of trimming the dataset using arbitrary selected thresholds that lack any theoretical justification.
Finally, this paper offers a precise and thoroughly tested estimate of the impact of using a smartphone on item response times. The comparison was made between computer and smartphone users when they use a smartphone friendly web survey. The analysis has shown that using a smartphone instead of a computer increases the
Table 3 Variances of the multilevel model
Random-effects Parameters Estimate Std. Err. [95% Conf. Interval] Variance of the random intercept 0.110 0.002 0.106 0.114
geometric mean of item response times by 19.8%. This increase was estimated after taking into account item and user characteristics that are known to affect response times, and using the most suitable statistical model.
Explaining why smartphone users need more time than desktop users is not an easy task. There are many potential causes that could explain this difference between the devices, but some of them can be excluded by the design features of HelpMeVote. One of the possible causes is the (usually) slower Internet connections of smartphones. A slower Internet connection would lead to longer transmission times. This could explain the difference between the devices in other studies. How-ever, this factor is not relevant for the data presented in this paper, because there is no lag between pages in HelpMeVote.
Smartphone users may have difficulties responding to a web survey that is not smartphone friendly. For instance, sometimes respondents have to zoom in to read a text written with small fonts. They may have to scroll horizontally in order to read the question. In other cases, respondents have to type their answers. All these actions could delay smartphone users and they could be used to explain longer times in other studies. However, these actions are not required by the smartphone users of HelpMeVote, because it is a smartphone friendly web survey. It uses large fonts and buttons and short question texts. It requires no horizontal scrolling and no typing. As a result, these possible obstacles do not apply to HelpMeVote users. This argument is further supported by the lack of any significant interaction between smartphone use and the age of the respondents. If smartphone users needed more time due to similar difficulties, the situation would probably be worse when older people are involved and the interaction would be significant.
There are two potential causes that could explain the difference between smartphone and computer users of HelpMeVote. It is possible that smartphone users may need more time because they have to scroll vertically before answering the question. Of course, the lack of a significant interaction between smartphone use and the length of the question hinders any blaming on vertical scrolling. But this finding is a result of the small variability of the length of the questions in HelpMeVote. If the variability was larger, the outcome would probably be different. Unfortunately, it is not easy to know if a respondent had to scroll vertically to give a response. This would require the knowledge of the screen resolution of each device and its orientation4 during all the time the user was completing the survey. For
instance, the owner of an Apple iPhone 5 holding the device on its vertical orienta-tion would be able to answer all HelpMeVote quesorienta-tions without any scrolling. On the other hand, if the horizontal orientation of the same device was used, then the respondent would have to scroll vertically most of the times. The recording of the
screen resolution and all the changes of the screen orientation is possible, but the additional code complicates and slows down the web survey application. Thus, it is more appropriate for less popular projects and it was not used in HelpMeVote which is used by thousands of voters.
A final reasonable explanation for the longer times among smartphone users is that they are probably completing the survey outdoors and they are more eas-ily distracted than the computer users who complete the survey in a quite room at home or in an office. However, since the dataset used for this paper does not include the parameter of the location where the respondents have completed the question-naires, this hypothesis cannot be verified.
Many recent publications show a continuous increase of the percentage of respondents who use their mobile devices to respond to a web survey. If web survey designers want to avoid data quality differences between computer and smartphone users, they have to optimize the design of the online questionnaire for smartphones. A good web survey design should definitely eliminate the need for horizontal scroll-ing. But this feature alone is not enough. Survey designers caring for their smart-phone users should also try to minimize the need for vertical scrolling by using short questions and short sets of response lists and by displaying only one question per page. Following these practices, they can expect very similar responses from all their respondents, no matter what device they use.
Acknowledgements
The author would like to acknowledge the contribution of the COST Action IS1004 Webdatanet (Steinmetz et al., 2014) to the development of the presented study. Many of the ideas and methods presented in this paper are the result of the author’s participation in Webdatanet and his work on the preparation of the Webadatanet web survey paradata training school.
References
Andreadis, I. (2012). To Clean or not to Clean? Improving the Quality of VAA Data Paper presented at XXII World Congress of Political Science (IPSA), Madrid, Spain. Re-trieved from: http://www.polres.gr/en/sites/default/files/IPSA12.pdf
Andreadis, I. (2013). Voting advice applications: A successful nexus between informatics and political science. In Proceedings of the 6th Balkan Conference in Informatics, 251-258. doi:10.1145/2490257.2490263
Andreadis, I. (2014a). Data quality and data cleaning. In D. Garzia & S. Marschall, (Eds.),
Andreadis, I., (2014b). Paradata from Political Web Surveys. Ann Arbor, MI: Inter-universi-ty Consortium for Political and Social Research [distributor], 2014-10-02. doi:10.3886/ E17816V3
Andreadis, I. (2015). Comparison of response times between desktop and smartphone users. In D. Toninelli, R. Pinter, & P. Pedraza, (Eds), Mobile Research Methods, (pp 63-79). London, UK: Ubiquity Press
Bassili, J. N. & Fletcher, J.F. (1991). Response-time measurement in survey research a meth-od for CATI and a new look at nonattitudes. Public Opinion Quarterly, 55(3), 331-346. doi: 10.1086/269265
Bauer, D. J. (2003). Estimating multilevel linear models as structural equation mo-dels. Journal of Educational and Behavioral Statistics, 28(2), 135-167. doi: 10.3102/10769986028002135
Bethlehem, J., & Biffignandi, S. (2011). Handbook of web surveys. John Wiley & Sons. Carver, R.P. (1992) Reading rate: Theory, research, and practical implications. Journal of
Reading, 36(2), 84-95
Couper, M. P., & Kreuter, F. (2013). Using paradata to explore item level response times in surveys. Journal of the Royal Statistical Society: Series A (Statistics in Society) 176(1), 271–86. doi: 10.1111/j.1467-985X.2012.01041.x
Couper, M.P. & Peterson, G. (2015). Exploring Why Mobile Web Surveys Take Longer. Paper presented at General Online Research, Cologne, Germany.
Curran, P. J. (2003). Have multilevel models been structural equation models all along?
Multivariate Behavioral Research, 38(4), 529-569. doi: 10.1207/s15327906mbr3804_5 de Bruijne, M. & Wijnant, A. (2013). Comparing survey results obtained via mobile devices
and computers: an experiment with a mobile web survey on a heterogeneous group of mobile devices versus a computer-assisted web survey. Social Science Computer Re-view,31, 482-504. doi:10.1177/0894439313483976
Fuchs, M., & Busse, B. (2009). The coverage bias of mobile web surveys across european countries. International Journal of Internet Science 4(1), 21–33.
Gelman, A., & Hill, J. (2006). Data analysis using regression and multilevel / hierarchical models. Cambridge University Press.
Greene, W. H. (2012). Econometric Analysis. 7th ed. Upper Saddle River, NJ: Prentice Hall. Gummer, T., & Roßmann, J. (2015). Explaining interview duration in web surveys
a multilevel approach. Social Science Computer Review, 33(2), 217-234. doi: 10.1177/0894439314533479
Heckman, J. (1978). Dummy endogenous variables in a simultaneous equation system.
Econometrica 46, 931-959.
Hoaglin, D.C. Mosteller, F. & Tukey, J.W. (1983). Understanding robust and exploratory data analysis. New York: John Wiley & Sons.
Hox, J. J. (2002). Multilevel analysis: Techniques and applications. Psychology Press. Maddala, G. S. (1983). Limited-Dependent and Qualitative Variables in Econometrics.
Cambridge: Cambridge University Press.
Mavletova, A. (2013). Data quality in pc and mobile web surveys. Social Science Computer Review, 33, 725-743. doi: 10.1177/0894439313485201.
McGill, R., Tukey, J. W., & Larsen, W. A. (1978). Variations of box plots. The American Statistician 32, 12–16.
Skrondal, A. & Rabe-Hesketh, S. (2004). Generalized latent variable modeling: Multilevel, longitudinal, and structural equation models. CRC Press.
Stapleton, C. (2013). The smart (phone) way to collect survey data. Survey Practice, 6(2). Steinmetz, S., Slavec, A., Tijdens, K., Reips, U. D., de Pedraza, P., Popescu, A., et al. (2014).
WEBDATANET: Innovation and quality in web-based data collection. International Journal of Internet Science, 9(1), 64-71
Swanson, D. B. Case, S. M. Ripkey, D. R. Clauser, B. E., & Holtman M. C. (2001) Rela-tionships among item characteristics, examine characteristics, and response times on USMLE Step 1. Academic Medicine, 76(10), S114-S116.
Toepoel, V., & Lugtig, P. (2014). What happens if you offer a mobile option to your web panel? Evidence from a probability-based panel of Internet users. Social Science Com-puter Review, 32(4), 544-560. doi: 10.1177/0894439313510482
Tukey, J. W. (1977). Exploratory Data Analysis. Addison-Wesley.
van der Linden, W. J. (2008). Using Response Times for Item Selection in Adap-tive Testing, Journal of Educational and Behavioral Statistics, 33(1), 5–20. doi: 10.3102/1076998607302626
Wells, T., Bailey, J. T., & Link, M. W. (2014). Comparison of smartphone and online com-puter survey administration. Social Science Computer Review, 32(2), 238-255. doi: 10.1177/0894439313505829
Wooldridge, J. M. (2010). Econometric Analysis of Cross Section and Panel Data. 2nd ed. Cambridge, MA: MIT Press.