REVIEw Of BuSINESS MANAGEMENT e-ISSN 1983-0807
RBGN
Review of Business Management
DOI:10.7819/rbgn.v18i62.2242
609
Received on 04/11/2015 Approved on 05/25/2016
Responsible editor:
Prof. Dr. João Maurício Gama Boaventura
Evaluation process:
Double Blind Review
The influence of project leaders’
behavioral competencies on the
performance of Six Sigma projects
Daniela Santana Lambert Marzagão
Marly M. Carvalho
University of São Paulo, Production Engineering DepartmentSão Paulo, Brazil
Abstract
Purpose – This article aims to characterize behavioral competencies of Six Sigma Project Leaders, as well as relate those competencies with projects performance.
Design/methodology/approach – It is a survey-based research. This study analyzes 225 Six Sigma Projects in Brazil, Chile and Colombia, led by 191 Project Leaders.
Findings – The projects were classified accordingly with their performance and project leaders had their behavioral characteristics mapped. Based on independence statistical testing, it was identified that project success depends on both competencies of the project leader, innovation and direction.
Originality/value – The article shows the relationship between behavioral competencies and project performance. In addition, the article maps behavioral competencies in six sigma projects.
1
Introduction
Many authors mention that, for the successful implementation of Six Sigma projects, companies must carefully select project leaders in order to ensure their competence in project management (Gijo & Rao, 2005; Johnson & Swisher, 2003). According to Boyatzis (1982), competence is a widely used term that can have many meanings, but it generally encompasses issues such as knowledge, competencies, attitudes and behavior referring to superior performance.
In the context of project management, the topic of the individual competencies of project managers has also received special attention from both professional and academic communities. Project management associations such as the International Project Management Association and the Project Management Institute have established responsibility frameworks for project managers. Stevenson & Starkweather (2010) point to the rise of professional certifications within project management. On the other hand, research indicates the impact of project managers’ competencies on the success of projects (Chipulu, Ojiako & Williams, 2013), although little attention has been given to project managers’ career models (Bredin & Soderlund, 2013).
Ahsan, Ho & Khan (2013) researched the desired profile in job vacancies for project managers and perceived emphasis on soft skills, involving behavioral aspects (Carvalho, 2014; Clarke, 2010a; Dainty, Cheng & Moore, 2005; Muller & Turner, 2010; Skulmoski & Hartman, 2010; Stevenson & Starkweather, 2010).
Although it is a relevant topic, there is a lack of research concerning Six Sigma projects. Given this gap, the purpose of this article is to identify key Six Sigma project leaders’ competencies and relate them to project performance. To achieve this goal, the researchers gathered data from 191 project leaders in charge of 225 Six Sigma projects performed in companies from the industrial and services sectors in Brazil,
Chile, and Colombia. The Predictive Index (PI®) was applied for measuring project leaders’ behavior; this is a self-assessment tool based on the behaviorist theory, which allows you to measure and report the professional behavior comparing to the adult population (Harry, Mann, Hodgins, Hulbert & Lacke, 2010).
This article contains five sections. Section 2 presents the synthesis of the theoretical framework, exploring the main aspects related to Six Sigma and project managers’ competencies. Section 3 presents the detailed methodological approach used in the research. Section 4 presents the study results, and Section 5 the discussion of the main findings. Conclusions are presented in Section 6.
2
Literature review
According to the literature review carried out by Kwak & Anbari (2006) in the context of project management over the past 50 years, there are a number of new and relevant topics to this knowledge area, including the Six Sigma as one of the topics that deserve to be studied in depth from the project management perspective.
Six Sigma arose at Motorola and spread especially among large companies (Harry & Schroeder, 2000; Pande, Neuman & Cabanagh, 2001). Although Kaynak (2003) considers Six Sigma as a “TQM with steroids”, Schroeder, Linderman, Liedtke & Choo (2008) and Zu, Fredendall & Douglas (2008) indicate that Six Sigma uses a common platform of knowledge, practice, and quality resources, complementing them with certain features and specific resources in order to increase effectiveness.
To Linderman, Schroeder, Zaheer & Choo (2003, p. 195) “Six Sigma is an organized and systematic method for strategic process improvement and new product and service development that relies on statistical methods and the scientific method to make dramatic reductions in customer defined defect rates.”
elements (parallel-meso structure, improvement specialists, structured method, and performance metrics).” This parallel-meso structure provides a hierarchical structure independent of the organizational structure, where continuous improvement experts, called “belts”, lead the projects, supported by companies’ executives, the so-called “champions.” Six Sigma dedicates itself to improving the organization and organizational change management. To Choo, Linderman & Schroeder (2007), Six Sigma has a positive impact on learning and knowledge management.
An important feature of Six Sigma that refers to the field of project management is its projectized structure. Zu et al. (2008) have shown that the core activities that differentiate Six Sigma from other quality initiatives are its structured procedures for improvement, characterized by disciplined and standardized execution of planned improvement activities through projects. Linderman et al. (2003) highlight the project-based characteristic of Six Sigma and its specific goals to offer a differentiated performance facing other improvement initiatives. Snee (2001, p. 66) proposes a definition of Six Sigma projects as “aimed at the problem in which the solution is not known…we also need one or more measurements that quantify the magnitude of the problem and can be used to select the project goals and monitor progress.”
Six Sigma has a program structure, deployed in projects carried out following the same management and methodology. According to the Project Management Body of Knowledge (PMBOK) definition, (PMI, 2008), a program can be defined as a group of related projects managed in a coordinated manner to achieve strategic benefits and control that would not be available if they were individually managed.
Thus, it is possible to deploy Six Sigma within enterprises as a Program organized through projects in order to improve processes, increase customer satisfaction and financial results.
2.1 The role of Six Sigma project leaders
The program structure offers levels of proficiency of experts on Six Sigma methods, tools and techniques, and in dedication to the program specialist. The hierarchy of this structure is similar to martial arts, thus the term “belts.” Leaders of Six Sigma projects are in general Black Belts, while Green Belts tend to support, but can also eventually lead projects.
According to Schroeder et al. (2008), the Black Belt is a full-time, well-trained specialist, who serves as a highly qualified project leader and reports to high leadership. The Black Belts’ selection is not only based on technical competencies, but also on leadership competencies. Green Belts receive fewer hours of training in Six Sigma and, in general, work part-time on projects, while Black Belts receive extensive training and are responsible for providing assistance to Six Sigma project teams, supporting as mentors and supporting training activities.
Davison & Al-Shaghana (2007) identified differences between companies that have and don’t have Six Sigma regarding human resources, such as training, employees’ participation and creating quality awareness. Buch & Tolentino (2006) also mention that the employees believe that their participation in the Six Sigma program will add value to their carrier and the organization. Kumar & Antony (2008) also identified differences between knowledge transfer among SMEs (small and medium-sized enterprises) which adopt Six Sigma and ISO (International Organization for Standardization) in the United Kingdom.
Table 1
Comparison between FCS (Shao, & Muller, 2011) and Six Sigma literature FCS
Since project leaders’ competencies are one of the key critical success factors, we decided to explore their impact on the success of Six Sigma projects.
Gijo & Rau (2005) identify the obstacles to the implementation of Six Sigma, highlighting the difficulty in project execution due to a lack of resources and the difficulty in selecting people with interpersonal competencies to lead projects. Several authors show the importance of careful selection of project leaders based on their leadership competencies (Johnson & Swisher, 2003; Zu, Fredendall & Douglas, 2008). However, Six Sigma project leaders’ key competencies have not been properly described. The literature of the Project Management field has devoted more attention to the behavioral competencies required of project managers.
2.2 Project managers’ competencies
Some of the major associations and institutes dedicated to the field of project management have individual competencies of project managers’ guidelines. Among the most widespread is the Competence Baseline of International Project Management Association
(IPMA, 2006) and the Project Manager Competency Development Framework (PMCDF) from the Project Management Institute (PMI, 2007). A comparative analysis of these reference models shows that there are similarities between them with regard to behavioral competencies.
The Project Manager Competency Development Framework (PMCDF) (PMI, 2007) describes knowledge, performance and personal competencies. Knowledge competencies are described in the PMBOK, currently in its 5th edition (PMI, 2013); performance and personal competencies, on the other hand, are formed by units of competence, for example, “project planning,” deployed in elements of competence (approved project schedule, etc.). Similarly, the ICB presents technical competencies (in Project Management and behavioral), but also highlights contextual competencies (IPMA, 2006).
117 in nine groups of competencies: problem solving, leadership, knowledge of the context, analytical competencies, ability to handle people, communication, personal characteristics, project administration, and tools. Rose, Pedersen, Hosbond & Kraemmergaard (2007) identified seven competencies: process, time, customer, business, personal and technical uncertainty management. To Crawford (1998), a project leader must be action-oriented and result-oriented, and personal competencies and personal effectiveness.
The leader or project manager has the role of coordinating the teamwork in search of
a better result, which requires not only technical knowledge of the leader on the project subject but also behavioral competencies that will facilitate the project execution. Project management literature evolves towards the competencies needed for a project leadership.
According to Shtub & Globerson (1994), the competencies required of the project manager refers to leadership, negotiation, and technical competencies. While the technical competencies can vary according to project scope, the behavioral competencies are similar across the projects, as summarized in Table 2.
Table 2
Evolution of literature on the behavioral competencies of project managers
Ménard
(1981) Adams et al. (1979) &Fusfeld (1981)Roberts Martin(1978) Shanks (1983) Cicero (1970)Wilemon & Spitz (1982)
Designer ManagerResults
Problem solver ManagerWork Planner
Entrepreneur
Strategist Communicator informationExtended
Relations with the High Representative
leadership
Extended information
Resource
Manager Organizational constraints Communicator
Pilot Decision maker Driver Decision maker Risks acquires resourcesIdentifies and
Risk and crisis manager
Balance between x management
technician
Coordinator Integrator Integrator Coordinator
Team leader Sponsor Interpersonal relations Controller
Responsible
climate Catalyst
Another way to organize the roles of project leader is to separate the technical and managerial roles, according to the Mintzberg
(1975), the transactional leader roles and continuous processing of Bass (1985). An example of this application can be seen in Table 3.
Table 3
Separation of technical and managerial roles of project leaders
Technical and managerial leadership Values Transformational behaviors
Innovative (creative solution to problems,
adaptation) Open mind, Adaptive Leadership Motivation for inspiration, intellectual stimulation Broker (power, influence, resource acquisition)
Facilitator (conflict management, participatory
decision making) Human relationsLeadership of people Individualized consideration,Support from other Negotiator behavior Mentor (development)
Coordinator (coordination of tasks, budget control) Creating routines
Stability of leadership Focus on the performance of tasks to achieve organizational goals Monitor (information management, critical
thinking)
Producer (productivity, efficiency) Rational goals, Task leadership Director (Planner, goals)
Note. Source Strang (2007). Examining effective technology project leadership traits and behaviors. Computers In Human Behaviour, 23(1), 424-462
According to Somerville & Langford (1994), the sources of stress and conflict in projects may be related to recognition, to industry, to team involvement and to leadership style. These
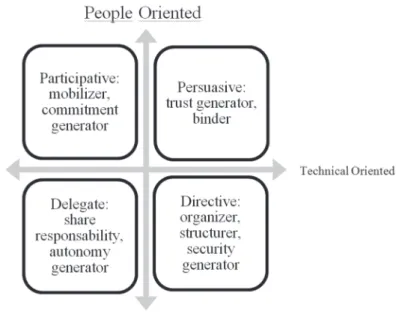
last two factors are directly related to the project leader competencies. Picq (2011) reports four styles of leadership, as shown in Figure 1.
Figure 1. Project leadership styles according to Picq (2011). Source: Hersey& Blanchard apud Picq, t. (2011). Manager Une Équipe
In the directive mode, the manager intervenes heavily in the organization, with a very rigid approach to methods and controls. Leaders search for effectiveness, clarity, and consistency, but can fall into authoritarianism and autocracy.
In the persuasive mode, the manager is involved in the organization, seeking understanding and taking ownership of the elements of the project structure. The persuasive leader seeks the trust of employees but may rest on paternalism and manipulation.
The participative mode assumes that the leader provides the organization’s rules, and the team itself sets its rules of operation. In this mode, it is expected that the team feels like the owner and the responsible party for the rules of practice. However, this mode can slip into demagoguery or deviate from the fundamental goal.
In delegation mode, the leader assumes that the team has technical and behavior maturity to decide how to lead the project. Thus, the delegate leader encourages autonomy and responsibility of team members on the project results. This mode, however, can fall into a project without management or cohesion.
In his book, Picq (2011) also cites the need for the project managers to be flexible to change their management style according to the project evolves, for example, passing the persuasive style to the directive in a time of crisis or impasse that could lead the whole project in risk.
The project leader competencies can significantly affect projects’ results (Dainty, Cheng & Moore, 2005). In this study, the most important project leader role in the leadership, concerning the proper building of project environment, leading others, assuming authority and responsibility. The leaders should have the ability to extract the maximum from the team without the need to act in an authoritative and controlling way, maintaining emotional factors under control even in stressful situations, enabling the best use of other abilities.
Since one of the factors that most affect project performance is the leadership on the team,
the project leader must take care to understand and work with these competencies to develop and move up on the competencies scale.
Thévenet, Salinesi, Etien, Gam & Lassoued (2006) list individual and organizational factors for teams’ motivation. In addition to individual factors listed by Abraham Maslow (1908-1970) and Frederick Herzberg (1913-2000), there are the factors related to empowerment and individual recognition. How organizational factors can list resources/working conditions, fair compensation and the compatibility of the company policies with the psychological characteristics and values of people.
According to Faraj & Sambamurthy (2006), leadership must not only provide goals, instructions, and commands, but also the empowerment is fundamental in the team development. The empowerment goes through foster and facilitates the search for opportunities, new knowledge and the personal development of each team member; the encouragement and advice on interpersonal relationships, making team members seek to work together for a common goal; and a collaborative setting goals, where the leader and the team discuss the best way to evaluate the progress of activities.
Studies in Brazil such as Rabechini Jr. & Carvalho (2003) show that, despite the project teams feel motivated by their project leaders; there is still a gap particularly regarding the development of interpersonal relationships and conflict management. It shows that there is an opportunity to build a deeper empathy between project leaders and their subordinates, allowing the use more adequate knowledge about the personal competencies and motivational factors as sources of ideas for conflict solution.
2.3 Responsibilities of Six Sigma project
leaders
the importance of leadership, training, communication and review, management process, profile of the Black Belt’s, teamwork and of previous initiatives on quality. However, even this study having a quantitative approach does not allow investigating the relative importance of these factors or even the effect of each of them on the projects or programs results. Galvani & Carpinetti (2013) compared for industrial and service companies, the effect of the critical success factors of literature such as the profile of the Black Belt, project teams, the connection with the client, the nature and availability of data, the application of tools and techniques, and the time of execution of projects. However, these studies, although demonstrating that there is an impact of the project leader’s profile, they did not detail the features of behavior competencies of project leaders and the impact on the success.
Given the gap in Six Sigma literature on projects leaders’ desired competencies, this article aims to identify the behavioral competencies of Six Sigma projects leaders in Latin America, both described in the literature concerning project managers in general, and in the Six Sigma projects context, analyzing which are the most significant behavioral competencies in Six Sigma projects’ performance.
3
Research
methods
In this article, we reviewed 225 Six Sigma projects carried out in Brazil, Chile and Colombia of different sectors. The project success is a proxy for evaluating project leaders’ performance. There are discussions in the literature related to the definition of project success. The most common, refer to the completion on time, on the quality specification, the customer acceptance, and no rework (Kerzner, 1998; Tukel & Rom, 2001). In this study, a successful Six Sigma project must fill the following criteria: the achievement of goals, measured by its performance indicator, the achievement of goals, customer satisfaction and
compliance with the deadlines. The projects that attended all these requirements were classified as successful projects; the projects that did not meet any of these requirements were considered failures, and this measure of success vs. failure was attributed to project leaders as a measure of its performance.
According to Snee (2001), an intrinsic feature of Six Sigma projects is that the goals of the Six Sigma projects are always linked to a performance indicator of the improved process, being this indicator the way of measuring the improvement has been indeed achieved. Therefore, depending on the improved process for each project, there is a performance indicator related to time, cost or quality that is the success measurement of each initiative. In this study, the project performance was measured twelve months after solution implementation, i.e., project closure. After this period, we conducted a one-sample t-test comparing the results of the indicator of this period with the goal proposed for the project, using the following hypothesis:
H0: mean of the indicator after the project
is equal to the goal
H1: mean of the indicator after the project
is worse than the goal (greater in the case of projects aimed at the reduction of the indicator, less in the case of projects aimed at increasing the indicator)
For projects whose P-value in a sample t-test was superior to 10% alpha value, a survey was conducted with the projects’ Champions and with the Manager of the Six Sigma program. The research instrument consists of six items about the project development and the importance of the work of the Belt to the achievement of the goals, applying a five points scale. In the leaders’ evaluation was performed based on the following issues:
a) Appropriate use of Six Sigma: use of the Six Sigma concepts, adherence to the DMAIC methodology and contribution of Six Sigma tools to the solution of the project problem and for process improvement. b) Commitment and dedication of the Belt
during the project: the time devoted to the project was the effectively planned, participation in the meetings with the team, Champions, and Executive presentations.
c) The contribution of the Belt to the goals achievement: how much of the improvements can be assigned to the project and what the rate of improvement actions completed by the end of the project.
The Champions and managers answered questions with alternatives in Lickert scale of 1 to 5 levels of agreement. Projects with an average exceeding 3.5 in this evaluation of satisfaction were considered approved. In addition, we verified the agreed deadlines. The successful projects in these three criteria were classified as approved projects. The projects’ financial benefits were not used for project evaluation, because the minimum goals benefit varied according to the company in which projects were conducted; moreover, we did not have a direct financial benefit for all projects: many of them were oriented to customer
satisfaction and to increasing or reducing risks. Each of the 191 leaders were submitted to the Predictive Index (PI), which is a self-assessment measure that allows measuring and reporting the professional behavior of the adult population (Harry et al., 2010) since this was the tool adopted by the organizations studied.
3.1 PI
®as an instrument for measurement
of competencies
ThePredictive Index (PI®) is an instrument consisting of two pages, filled in paper or in electronic form, in which the leader should choose among 86 options presented. Herein, the leaders in analysis select what words better describe who they are and how other people expect them to behave. Based on the analysis of the words chosen, the Predictive Index (PI®) measures four primary
and two secondary factors: factor A (dominance), factor B (extroversion), factor C (patience), factor D (formality), Factor M (energy) and factor E (decision-making) (Everton, 1999).
This instrument has reviews by internal consistency reliability, reliability per test and retest and validation of the constructs of the factors by correlation with other validated psychological assessment instrument, the 16PF (Everton, 1999; Perry & Lavori, 1983).
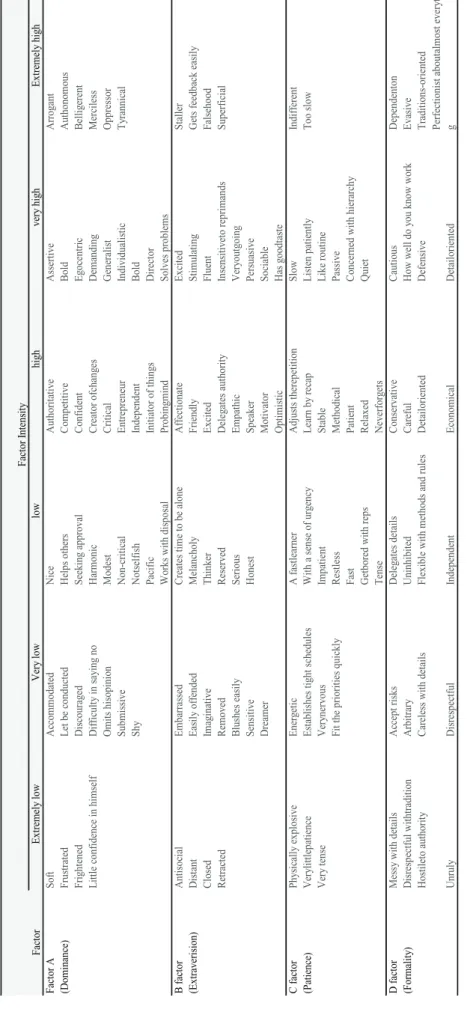
The description of the each factor for behavioral competencies depends on a cumulative scale, measured in accordance with the deviation from the average. As the individual moves away from the mean of the factor, accumulate positive and negative characteristics as can be described in Table 4.
T able 4 Characterization of P
I ® Constr
ucts accor
ding to the intensity of measur
ed v ariable Ex tre me ly lo w V er y l ow low hi gh ve ry hi gh Ex tre me ly h ig h Fact or A So ft A cco m m od at ed N ice A uth or ita tiv e A sse rti ve A rro ga nt (D om in an ce) Fr us trat ed Let b e co nd uct ed H el ps ot he rs C omp etitiv e Bo ld A ut honom ous Fr ig ht en ed D is co ur ag ed Se eki ng a ppr ova l C onf ide nt Eg ocen tri c B el lig er en t Little c on fid en ce in h ims elf D iff ic ulty in s ay in g n o H ar m oni c C reat or o fch an ges D em andi ng M er ci les s O mits h is op in io n M ode st C ritic al G en er al is t O ppr es sor Subm is si ve N on -cr iti cal Ent re pr ene ur In div id ua lis tic Ty ran ni cal Shy N ots elf is h Inde pe nde nt Bo ld Paci fic In itia to r o f th in gs D irect or W or ks w ith di spos al Pr obi ng m ind Sol ve s pr obl em s B fact or A ntis oc ia l Em bar ras sed C reat es ti m e t o be al on e A ff ect io nat e Ex ci ted Sta lle r (E xt ra ve ris io n) D is ta nt Eas ily o ff en ded M el an ch ol y Fr ie ndl y Stimu la tin g G et s f eed back eas ily C lo sed Ima gin ativ e Thi nke r Ex ci ted Fl ue nt Fa ls ehood R et ract ed R em ov ed R es er ved D el eg at es au th or ity Ins ens iti ve to re pr im ands Su per fici al B lu sh es eas ily Se rious Emp ath ic V er yout goi ng Se ns itiv e H one st Sp eak er Per su as iv e D ream er M ot iva tor So ci ab le O ptimis tic H as g oodt as te C fact or Ph ys ic ally e xp lo siv e En er get ic A fas tlear ner A dju sts th er ep etitio n Sl ow In di ffe re nt (P at ien ce) V er ylittle pa tie nc e Es ta blis he s tig ht s ch ed ule s W ith a s en se o f u rg en cy Lear n by recap Lis te n pa tie ntly Too s low V er y t en se V er yne rvous Imp atie nt Sta ble Li ke rout ine Fit th e pr io ritie s qu ic kly R es tles s M et ho di cal Pa ssi ve Fa st Pat ien t C onc er ne d w ith hi er ar chy G et bor ed w ith re ps R el ax ed Q ui et Ten se N ev er fo rg et s D fact or M es sy w ith d eta ils A ccep t r is ks D el eg at es d et ai ls C ons er va tive C aut ious D epe nde nt on (F or ma lity ) D is re sp ec tfu l w ith tra ditio n A rb itra ry U ni nhi bi te d C ar ef ul H ow w el
l do y
ou know w or k Eva si ve H os tile to a uth or ity C ar ele ss w ith d eta ils Fl ex ibl e w ith m et hods a nd rul es D eta ilo rie nte d D ef en si ve Tr adi tions -or ie nt ed U nr ul y D is res pect fu l Inde pe nde nt Eco no m ical D eta ilo rie nte d Pe rf ec tio nis t a bo uta lmo st e ve ry th in g Fact or Fa cto r I nte ns ity N ote. Sour ce: P err
y, J. C., & L
AV ORI, P . W . (1983). The pr edictiv
e index ®: the r
epor
t on r
eliability and constr
Table 5
Identification of the main emphases of factors interaction
Factor 1 Factor 2 Factor 1> Factor2 Factor 2>Factor 1
Dominance (A Factor)
Extroversion (B Factor)
Technically oriented: prioritizes his interest in understanding things and processes
Socially-driven: prioritizes his understanding people Dominance
(A Factor)
Patience (C Factor)
Proactive: take the initiative to promote changes before they are requested
Reactive: expects guidelines before initiating changes
Dominance (A Factor)
Formality (D Factor)
Strategic: seeks to understand the vision of the whole. When the factor is above
average and below average factor D, is
considered a negotiator Tactical: addresses the issues from their details
Extroversion (B Factor)
Patience (C Factor)
Rapid communication: starts contact quickly and and easy communication with new people
Slow communication: waits for the touch of people and expect to get used to them before you approach them in communicating Extroversion
(B Factor)
Formality (D Factor)
Informal communication: does not use formal media to communicate
Formal communication: use of formal means to communicate
Patience (C Factor)
Formality (D Factor)
Careless: does not
perform monitoring around while
running, waiting for the final result to manifest himself
Worried: accompanies closely the execution, manifesting himself in advance if realizes that the end result might not come true
Note. Source: Perry, J.C., & Lavori, P.W. (1983). The predictive index ®: the report on reliability and construct validity.
Massachusetts: Praendex.
3.2 Comparison between of PI
®constructs
and project management competencies
After getting the results of main factors measured by the PI®, Six Sigma project leaders of the study were classified according to two
perspectives. Initially, a link between the desired characteristics for a project leader (Strang, 2007) and the factors measured by the PI® (Perry & Lavori, 1983) was made, as shown in Table 6.
Table 6
List of desired characteristics for a project leader (Strang, 2007) and the factors measured by the PI ® (Perry & Lavori, 1983)
Leadership Features PI® related factors Characteristics
Factor A aboveaverage Creator, probing mind, initiator of things
Factor A bigger than factor B
prioritizes your interest in understanding things and processes
Factor C belowaverage a fastlearner
Factor D belowaverage questioning methods and rules, flexible Factor A aboveaverage assertive, confident, Director Factor B aboveaverage empathic, persuasive, motivator
Factor D belowaverage flexible, independent
Factor A aboveaverage Director, solves problems
Factor B aboveaverage friendly, empathetic, otimesta, motivator
Factor A aboveaverage critical, demanding
Factor B aboveaverage delegates authority, stimulant
Factor A aboveaverage critical, demanding
Factor D aboveaverage economical, conservative, careful
Factor A bigger than factor B
prioritizes his interest in understanding things and processes B factor belowaverage seriously, imaginative thinker
Factor A aboveaverage critical, demanding
Factor A bigger than factor B
prioritizes his interest in understanding things and processes Factor D aboveaverage economical, conservative, careful
Factor A aboveaverage entrepreneur, Director
Factor C belowaverage sense of urgency, adjusts priorities quickly Producer (productivity, efficiency)
Director (Planner, goals)
Innovative (creative solution to problems, adaptation)
Broker (power, influence, resource acquisition) Facilitator (conflict management, participatory decision making)
Mentor (development)
Coordinator (coordination of tasks, budget control)
Monitor (information management, critical thinking)
Liderança técnica e gerencial Fatores Relacionados no PI® Características Fator A acima da média Criador de mudanças, mente inquisitiva, iniciador de coisas Fator A maior que o fator B prioriza seu interesse no entendimento de coisas e processos Fator C abaixo da média aprende depressa
Fator D abaixo da média questiona métodos e regras, flexível Fator A acima da média assertivo, confiante, realizador Fator B acima da média empático, persuasivo, motivador Fator D abaixo da média flexível, independente Fator A acima da média realizador, resolve problemas Fator B acima da média amigável, empático, otimesta, motivador Fator A acima da média crítico, exigente
Fator B acima da média delega autoridade, estimulante Fator A acima da média crítico, exigente Fator D acima da média econômico, conservador, criterioso
Fator A maior que o fator B prioriza seu interesse no entendimento de coisas e processos Fator B abaixo da média pensador, sério, imaginativo
Fator A acima da média crítico, exigente
Fator A maior que o fator B prioriza seu interesse no entendimento de coisas e processos Fator D acima da média econômico, conservador, criterioso
Fator A acima da média empreendedor, realizador
Fator C abaixo da média senso de urgência, se ajusta a prioridades rapidamente Produtor (produtividade, eficiência)
Diretor (planejamento, adaptador de metas) Mentor (desenvolvimento de pessoas)
Coordenador (coordenação de tarefas, controle de orçamento)
Monitor (gestão da informação, pensamento crítico) Inovador (soluções criativas de problemas, adaptação)
Broker (poder, influência, aquisição de recursos)
Facilitador (gestão de conflitos, tomada de decisão participativa)
According to Table 6, the project leader has a specific technical and managerial leadership competence, if the leader fit the most factors related to that given competence; if less than half of the factors of PI® related to a specific competence is not possessed by state in Table 6, the leader did not have leadership competence.
In addition, a second classification compares the characteristics measured by PI ®
(Perry &Lavori, 1983) with the leadership model (Picq, 2011). The relation of the characteristics of the behavioral profile with the leadership model is described in Table 7.
Data were organized based on the following variables: the sector of the company, the type of project (Green Belt or Black Belt), the gender of the leader, behavioral profile classification, and project success or failure.
Table 7
Relationship between the Leadership Model (Picq, 2011) and the factors of PI ® (Perry, & Lavori, 1983)
Low High
Participative leadership Persuasive leadership
Factor B above average (affectionate, friendly, sociable)
Factor A above
average (assertive, demanding, Director)
Factor D below average (delegator, flexible)
Factor B above average (stimulating, enthusiastic, persuasive)
Factor D below
average (flexible, informal), but greater than C Factor (worried: accompanies closel y the execution, manifesting himself in advance if provides that the end result might not come true)
Delegative leadership Directive leadership
B factor below average (reserved, thinker, distant)
Factor A above
average (authoritarian, critical, demanding)
Factor D below average (delegator, flexible)
B factor below
average (serious, honest, thinker) Factor D above
average (careful, concerned, Centralizer)
People oriented
T
ech
ni
cal
ly
O
ri
en
ted
Hi
gh
Lo
w
Note. Source: Picq, t. (2011). Manager une équipe projet. Paris: Dunod. Perry, j. c., & Lavori, p. w. (1983). The predictive index ®: the report on reliability and construct validity. Massachusetts: Praendex.
The PI ® measures other aspects besides the tabulated in tables 6 and 7, which are determined by the intensity of the factors, as well as for other combinations of factors not described in this article, for a limited space. The authors have chosen to treat only, in the statistics, factors, and combinations congruent with the constructs of project leaders competencies described in the literature review.
Initially, descriptive statistics were analyzed, for the purpose of characterization of the study population.
Then, Chi-square tests were performed for verification of the relation between the
projects’ success and behavioral competencies. The Chi-square test is a technique which allows verifying the frequency of events are independent of any other categorical independent variables, for discrete events, as is the case of successes and failures of projects, (Hair Jr., Black, Babin, Anderson & Tatham, 2009).
Chi-Square test for independence is given by the maximum likelihood estimators ofPi. and
So if the independence hypothesis is valid, the maximum likelihood estimators ofPij are:
and the likelihood estimators of expected frequenciesEij are:
Oij = (O11, O12, ..., Orc) is the vector of
observed counts with multinomial distribution, and Eij represents the expected frequencies and
assumes valid the hypothesis of independence of classification criteria, the statistics
has asymptotic Chi-square distribution with (r – 1) (c – 1) degrees of freedom.
The X2 statistics allow understanding what the critical region of the independence test. When there is not independence, it is natural that the observed frequencies Oij are significantly
different from the expected frequency Eij when
independence occurs. Thus, we must reject the hypothesis H0 of independence of classification
criteria when the Q2obs statistic is greater than a critical point X2a by using the Chi-square distribution table.
So, given a level of a significance, the p-value is determined by p-valor = P [Q2obs> X2a; (r – 1) (c – 1) | H0].
After the application of statistical techniques, we checked whether the findings reflect the study hypothesis. In addition, the results were submitted to a logistic regression analysis to create a predictive model of success of projects. Second Hair Jr. et al. (2009), the logistic regression model allows the measurement of the probability of occurrence of an event and
the identification of the characteristics of the elements belonging to each category established by the dichotomy of the dependent variable. A logistic regression model is used for an explanatory variable project success or failure. In this case, there is a sample of n = 191 projects’ leaders independent of (xi, mi, yi); i = 1, 2, ..., n, as
follows:
• xi is the value of the explanatory variable,
in this case, the success rate;
• mi is the number of checked items in the
sample (number of projects);
• yi is the number of successful projects • in mi projects conducted; and
• n is the total of projects conducted.
Thus, we assume that the response variable has binomial probability distribution
Yi ∼ B (mi, πi), such that
To adjust the mean response to the linear model use the function
which can be written as
4
Results
Table 8
Classification of projects regarding typology, gender and industry
Project result
Project Type unsuccessful successful Total
GB 48 53 101
BB 37 117 154
Total 85 170 255
Gender unsuccessful successful Total
Male 65 128 193
Female 20 42 62
Total 85 170 255
Sector unsuccessful successful Total
Manufacturing 7 37 44
Service Operations 78 133 211
Total 85 170 255
Table 9A
Classification of project leaders according to behavioral competencies
Type absent present Total Type absent present Total
GB 81 20 101 GB 58 43 101
BB 86 68 154 BB 87 67 154
Total 167 88 255 Total 145 110 255
Type absent present Total Type absent present Total
GB 85 16 101 GB 32 69 101
BB 110 44 154 BB 14 140 154
Total 195 60 255 Total 46 209 255
Type absent present Total Type absent present Total
GB 76 25 101 GB 87 14 101
BB 99 55 154 BB 105 49 154
Total 175 80 255 Total 192 63 255
Type absent present Total Type absent present Total
GB 53 48 101 GB 81 20 101
BB 84 70 154 BB 109 45 154
Total 137 118 255 Total 190 65 255
Type absent present Total Type absent present Total
GB 41 60 101 GB 89 12 101
BB 63 91 154 BB 122 32 154
Total 104 151 255 Total 211 44 255
Type absent present Total
GB 62 39 101
BB 95 59 154
Total 157 98 255
Inovator Behavior Producer Behavior
Broker Behavior Director Behavior
Facilitator/ Mentor Behavior Persuasive leadership
Coordinator behavior Participative leadership
Monitor behavior Delegate leadership
Table 9B
Classification of project leaders based on the behavior as Project Manager
failure success failure success
Inovator Behavior absent 64 103 Director Behavior absent 24 22
present 21 67 present 61 148
failure success failure success
Broker Behavior absent 70 125 Persuasive leadership absent 70 122
present 15 45 present 15 48
failure success failure success
Facilitator/ Mentor Behavior absent 63 112 Participative leadership absent 67 123
present 22 58 present 18 47
failure success failure success
Coordinator behavior absent 47 90 Directive leadership absent 54 103
present 38 80 present 31 67
failure success failure success
Monitor behavior absent 34 70 Delegate leadership absent 70 141
present 51 100 present 15 29
failure success
Producer Behavior absent 49 96
present 36 74
Projects Results Projects Results
Projects Results Projects Results
Projects Results
Projects Results Projects Results
Projects Results
Projects Results
Projects Results Projects Results
After this classification, Chi-square tests for assessment of independence were performed, applying Minitab software, where the alternative hypothesis refers to the dependency of the project performance with the factor studied.
Table 10
Independence test results for the entire sample examined
Population Hypothesis tested
Calculated chi
squate P-value
Hypothesis Confirmation
The performance in the project depends on innovative behaviour? 5.422 0.02 Supported
The performance in the project depends on broker behavior? 2.452 0.117 Unsupported
The performance behaviour depends on the project facilitator/mentor? 1.785 0.182 Unsupported
The performance in the project depends on a coordinator behavior? 0.126 0.722 Unsupported
The project depends on the performance of a behavior monitor? 0.032 0.857 Unsupported
The performance in the project depends on producer behaviour? 0.032 0.858 Unsupported
The performance in the project depends on Director behavior? 8.965 0.003 Supported
The performance in the project depends on a persuasive leadership? 3.415 0.065 Supported
The performance in the project depends on a participative leadership? 1.249 0.264 Unsupported
The performance in the project depends on a delegate leadership? 0.014 0.907 Unsupported
The performance in the project depends on a Directive leadership? 0.207 0.649 Unsupported
E
nt
ir
e P
opul
at
ion
População Hipótese testada Qui-Quadrado Calculado Valor P Confirmação da hipótese O desempenho no projeto depende de um comportamento inovador? 5,422 0,020 Suportada O desempenho no projeto depende de um comportamento broker? 2,452 0,117 Não suportada O desempenho no projeto depende de um comportamento facilitador/mentor? 1,785 0,182 Não suportada O desempenho no projeto depende de um comportamento coordenador? 0,126 0,722 Não suportada O desempenho no projeto depende de um comportamento monitor? 0,032 0,857 Não suportada O desempenho no projeto depende de um comportamento produtor? 0,032 0,858 Não suportada O desempenho no projeto depende de um comportamento diretor? 8,965 0,003 Suportada O desempenho no projeto depende de uma liderança persuasiva? 3,415 0,065 Suportada O desempenho no projeto depende de uma liderança participativa? 1,249 0,264 Não suportada O desempenho no projeto depende de uma liderança delegadora? 0,014 0,907 Não suportada O desempenho no projeto depende de uma liderança diretiva? 0,207 0,649 Não suportada
T
od
a a
P
op
ul
aç
ão
Table 11
Independence test results stratified by gender
Population Hypothesis tested
Calculated chi
squate P-value
Hypothesis Confirmation
The performance in the project depends on innovative behaviour? 5.857 0.016 Supported
The performance in the project depends on broker behavior? 2.24 0.134 Unsupported
The performance behaviour depends on the project facilitator/mentor? 1.139 0.286 Unsupported
The performance in the project depends on a coordinator behavior? 0.038 0.845 Unsupported
The project depends on the performance of a behavior monitor? 0.016 0.9 Unsupported
The performance in the project depends on producer behaviour? 0.157 0.692 Unsupported
The performance in the project depends on Director behavior? 8.508 0.004 Supported
The performance in the project depends on a persuasive leadership? 1.624 0.203 Unsupported
The performance in the project depends on a participative leadership? 1.008 0.315 Unsupported
The performance in the project depends on a delegate leadership? 0.101 0.75 Unsupported
The performance in the project depends on a Directive leadership? 0.247 0.619 Unsupported
The performance in the project depends on innovative behaviour? 0.198 0.657 Unsupported
The performance in the project depends on broker behavior? 0.283 0.595 Unsupported
The performance behaviour depends on the project facilitator/mentor? 0.637 0.425 Unsupported
The performance in the project depends on a coordinator behavior? 0.136 0.713 Unsupported
The project depends on the performance of a behavior monitor? 0.318 0.573 Unsupported
The performance in the project depends on producer behaviour? 0.114 0.736 Unsupported
The performance in the project depends on Director behavior? 0.716 0.398 Unsupported
The performance in the project depends on a persuasive leadership? 2.03 0.154 Unsupported
The performance in the project depends on a participative leadership? 0.233 0.629 Unsupported
The performance in the project depends on a delegate leadership? 0.603 0.438 Unsupported
The performance in the project depends on a Directive leadership? 0.003 0.956 Unsupported
Mal
e
F
emal
Table 12
Independence test results stratified by projects type
Population Hypothesis tested
Calculated chi
squate P-value
Hypothesis Confirmation
The performance in the project depends on innovative behaviour? 1.569 0.21 Unsupported
The performance in the project depends on broker behavior? 0.109 0.742 Unsupported
The performance behaviour depends on the project facilitator/mentor? 0.003 0.956 Unsupported
The performance in the project depends on a coordinator behavior? 0.006 0.94 Unsupported
The project depends on the performance of a behavior monitor? 0.044 0.835 Unsupported
The performance in the project depends on producer behaviour? 0.052 0.82 Unsupported
The performance in the project depends on director behavior? 0.589 0.443 Unsupported
The performance in the project depends on a persuasive leadership? 0.142 0.706 Unsupported
The performance in the project depends on a participative leadership? 0.064 0.801 Unsupported
The performance in the project depends on a delegate leadership? 0.187 0.665 Unsupported
The performance in the project depends on a directive leadership? 0.048 0.827 Unsupported
The performance in the project depends on innovative behaviour? 0.788 0.375 Unsupported
The performance in the project depends on broker behavior? 1.153 0.283 Unsupported
The performance behaviour depends on the project facilitator/mentor? 1.601 0.206 Unsupported
The performance in the project depends on a coordinator behavior? 0.474 0.491 Unsupported
The project depends on the performance of a behavior monitor? 0.19 0.663 Unsupported
The performance in the project depends on producer behaviour? 0.174 0.676 Unsupported
The performance in the project depends on director behavior? 5.692 0.017 Supported
The performance in the project depends on a persuasive leadership? 1.261 0.262 Unsupported
The performance in the project depends on a participative leadership? 0.565 0.452 Unsupported
The performance in the project depends on a delegate leadership? 1.155 0.283 Unsupported
The performance in the project depends on a directive leadership? 0.208 0.648 Unsupported
B
la
ck
B
elt
s
G
reen B
el
ts
Table 13
Independence test results stratified by sector
Population Hypothesis tested
Calculated chi
squate P-value
Hypothesis Confirmation
The performance in the project depends on innovative behaviour? 0.04 0.841 Unsupported
The performance in the project depends on broker behavior? 0.218 0.64 Unsupported
The performance behaviour depends on the project facilitator/mentor? 0.661 0.416 Unsupported
The performance in the project depends on a coordinator behavior? 0.724 0.395 Unsupported
The project depends on performance of a behavior monitor? 0.459 0.498 Unsupported
The performance in the project depends on producer behaviour? 0.023 0.88 Unsupported
The performance in the project depends on Director behavior? N/A N/A *
The performance in the project depends on a persuasive leadership? 1.019 0.313 Unsupported
The performance in the project depends on a participative leadership? 0.218 0.64 Unsupported
The performance in the project depends on a delegative leadership? N/A N/A *
The performance in the project depends on a Directive leadership? 0.17 0.68 Unsupported
The performance in the project depends on innovative behaviour? 6.236 0.013 Supported
The performance in the project depends on broker behavior? 1.314 0.252 Unsupported
The performance behaviour depends on the project facilitator/mentor? 2.049 0.152 Unsupported
The performance in the project depends on a coordinator behavior? 0.157 0.692 Unsupported
The project depends on performance of a behavior monitor? 0.094 0.759 Unsupported
The performance in the project depends on producer behaviour? 0.004 0.952 Unsupported
The performance in the project depends on Director behavior? 6.326 0.012 Supported
The performance in the project depends on a persuasive leadership? 5.212 0.022 Supported
The performance in the project depends on a participative leadership? 0.51 0.475 Unsupported
The performance in the project depends on a delegative leadership? 0.035 0.851 Unsupported
The performance in the project depends on a Directive leadership? 0.001 0.978 Unsupported
Manuf
ac
tur
ing
S
er
vi
ce O
per
at
ions
As mentioned in Section 3, there are factors measured by the instrument PI ® that are not exactly corresponding to the factors listed in the literature, and there is an interest in predicting the project leaders who present greater chances of project success. Thus, logistic regressions, applying Minitab software, considering the factors listed in
Table 4 and Table 5 for the prediction of success in projects was performed. Table 14 shows the logistic regression model, built from the full set of projects. Table 15 shows the model considering only the Green Belt projects and Table 16 shows the model considering the Black Belt projects.
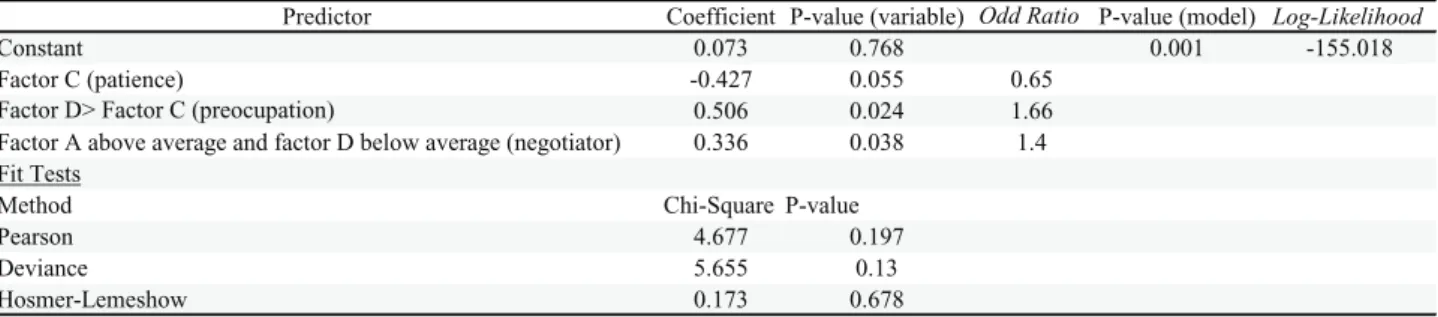
Table 14
Logistic regression model to predict the success of projects, considering all typologies
Predictor Coefficient P-value (variable) Odd Ratio P-value (model) Log-Likelihood
Constant 0.073 0.768 0.001 -155.018
Factor C (patience) -0.427 0.055 0.65
Factor D> Factor C (preocupation) 0.506 0.024 1.66
Factor A above average and factor D below average (negotiator) 0.336 0.038 1.4
Fit Tests
Method Chi-Square P-value
Pearson 4.677 0.197
Deviance 5.655 0.13
Hosmer-Lemeshow 0.173 0.678
Table 14 shows that, as factor C (patience) grows, the likelihood of project success decreases. Moreover, the increased difference between factors D and C (Concern) increases the project
success likelihood and the presence of negotiation characteristic (Factor A high and factor D low) also contribute to the increased project success likelihood.
Table 15
Logistic regression model of the probability of success of the projects, considering only the universe of Green Belt projects
Predictor Coefficient P-value (variable) Odd Ratio P-value (model) Log-Likelihood
Constant -0.087 0.75 0.035 -67.258
Factor D> Factor C (preocupation) 0.809 0.032 2.24
Factor A above average and factor D below average (negotiator) 0.703 0.038 2.02
Fit Tests
Method Chi-Square P-value
Pearson 1.205 0.272
Deviance 1.853 0.173
Hosmer-Lemeshow 0.266 0.606
Table 14 confirms some of the findings in the previous analysis: the increase in the difference between factors D and C (Concern)
and negotiation characteristics increases project success likelihood.
Table 15
Logistic regression model for the probability of success of the projects, considering only the universe of Black Belt projects
Predictor Coefficient P-value (variable) Odd Ratio P-value (model) Log-Likelihood
Constant 0.444 0.189 0.012 -81.735
Note that there are differences between the predictors of success depending on the set of projects reviewed. Table 15 shows that, for
Black Belt projects, critical issue in the successful
projects prediction is the factor A (dominance), i.e. in the presence of project leaders with high dominance, the success rate of projects increases.
5
Discussion
The set of projects analyzed brought a comprehensive panorama, allowing to verify the research hypothesis. The results show that only the “innovative” and “director” behaviors competencies have a significant effect on projects success.
According to Strang (2007), the innovative behavior is characterized by the ability to adapt and adopt creative solutions to problems, being characterized by a leader with an open mind and powered by intellectual stimuli. In Six Sigma projects, the need to adapting Six Sigma tools to practical problems, as well as the need to tackle a project with solution unknown a priori, can explain why this factor rises significantly on the results of the projects.
According to Strang (2007), leadership focused on performance to achieve organizational goals is aligned with the Director planning and adaptation function of the tasks and deliverables of the team members. This was another factor that resulted in significant statistical tests, which emphasizes the importance to the Six Sigma project leader to ensure that each task performed in the project must have a purpose aligned with the project goal and project’s success, related to financial results from quantitative goals.
Gender differences were identified in innovative and Director factors, being significant for male and not for female. Such a difference can be explained by the small sample size for the female gender, which reduces the power of comparison between categories. The same was
verify for sectors analyzed - industry and services. However, for persuasive leadership factor (Picq, 2011); the service sector presents significant differences compared to the general population. This result can be explained due to the lack of background of service companies on continuous improvement and statistical process control concepts, if compared with industry, demanding for project’s leaders a better negotiation and persuasion ability for implementing such practices.
The logistic regression predictive models allow exploring the project leaders’ competencies that are not well explored in project management literature. In general, Factor C, project leader patience, is significant, and the combination of factors D and C, i.e., the project leader concerns in following all project details, and the presence of negotiation characteristic.
The Factor C, project leader patience, emerges from this study, indicating that the nature of the Six Sigma projects, with their limited period and great pressure for short-term return privileges project leaders with competencies that stimulate agile responsiveness.
The combination of concern characteristic (emphasis of combination of factors D and C), and the negotiation characteristic (the Factor A above-average and Factor D below-average), emphasizes the project leader ability of being strategic, analyzing the comprehensive scenario and delegating the execution of tasks but at the same time keeping control of the project scope to ensure the result.
6
Conclusions, recommendations,
and limitations of the study
This study shows that some of the behavioral competencies required of the Six Sigma projects’ leaders are similar to those recommended in PM literature to project managers. However, some behavioral competencies suggested in the literature could not be verified, which may be due to the singular feature of Six Sigma projects, such as short duration, focused on technical aspects of the process, without requiring much versatility of their leaders, if compared to other projects studied in PM literature.
The results stood out the competence of innovation and adaptation, as well as task-oriented planning goals, as key competences of Six Sigma project leaders. In addition, for Six Sigma projects succeed, the leader should have the ability to perform in pressure situations and balance the strategic vision while dealing with the strict monitoring of the progress of the delegated tasks. Moreover, the selection of Black Belts should emphasize the natural capacity of the leadership.
A limitation of the study was the measurement of the behaviors competencies applying the PI® because it is a common used tool in Six Sigma program environment. This methodological choice caused a sample bias because some companies perform PI ®, for selecting Black Belts, which may have caused the low capacity of validation of the constructs in this study. Another limitation of the study is the sample size, which was not large enough to allow the validation of concepts within each demographic variables.
References
Ahsan, K., Ho, M., & Khan, S. (2013).Recruiting project managers: A comparative analysis of competencies and recruitment signals from job advertisements. Project Management Journal,
44(5), 36-54.
Archibald, R. D. (2003).Managing high technology
programs and projects. New Jersey: Wiley & Sons.
Belout, A., & Gauvreau, C. (2004). Factors influencing project success: The impact of human resource management. International Journal of
Project Management, 22(1), 1-11.
Boyatzis, R. E. (1982).The competent manager: A
model for effective performance. New York: Wiley
& Sons.
Bredin, K., & Soderlund, J. (2013). Project managers and career models: An exploratory comparative study. International Journal of Project
Management, 31(6), 889-902.
Brill, J., Bishop, M. J., & Walker, A. (2006). The competencies and characteristics required of an effective project manager: A web-based delphi study. Educational Technology Research and
Development, 54(2),115-140.
Buch, K. K., & Tolentino, A. (2006).Employee expectations for Six Sigma success. Leadership &
Organization Development Journal, 27(1), 28-37.
Carvalho, M. M. (2014).An investigation of the role of communication in it projects.International
Journal of Operations & Production Management,
34(1), 36-64.
Carvalho, M. M., Ho, L. L., & Pinto, S. H. B. (2007). Implementação e difusão do programa Seis Sigma no Brasil. Revista Produção, 17(3), 486-501.
Chang Dong, K. B., & Zai, L. (2004).A study of critical success factors of information system project
in China. Pmi Research Conference, p. 1-15.
Chipulu, M., Ojiako, U., &Williams, T. (2013).A multidimensional analysis of project manager competences.IEEE Transactions on Engineering
Choo, A. S., Linderman, K. W., &Schroeder, R. G. (2007).Method and psychological effects on learning behaviors and knowledge creation in quality improvement projects. Management
Science, 53(3), 437-450.
Clarke, N. (2010). Emotional intelligence and its relationship to transformational leadership and key project manager competences. Project
Management Journal, 41(2) 5-20.
Cooke-Davies, T. (2002). The “real” success factors on projects. International Journal of Project
Management, 23(3), 185-190.
Crawford, L. (1998).Project management for strategy realization. Proceedings of
World Congress on Project Management,
Slovenia, 14. Recovered from https://www. researchgate.net/profile/Lynn_Crawford3/ publication/237648165_Project_Management_ Competence_for_the_New_Millenium/ links/0046352d06120c4460000000.pdf
Dainty, A. R. J., Chang, M.,& Moore, D. (2005). Competency-based model for predicting construction project managers’ performance.
Journal of Management, 21(1), 2-9.
Davison, L., & Al-Shaghana, K. (2007).The link between six sigma and quality culture: An empirical study. Total Quality Management &
Business Excellence, 18(3), 249-265.
Everton, W. (1999).A further investigation of the
construct validity of the predictive index®. Wellesley
Hills: Praendex.
Fabi, B., & Pettersen, N. (1992).Human resource management practices in project management.
International Journal of Project Management,
10(2), 281-288.
Faraj, S., & Sambamurthy, V.(2006).Leadership of information systems development projects. IEEE
Transactions on Engineering Management,53(2),
238-249.
Galvani, L. R., & Carpinetti, L. C. R. (2013). Análise comparativa da aplicação do programa Seis Sigma em processos de manufatura e serviços.
Produção, 23(4), 695-704.
Gijo, E. V., & Rao, T. S. (2005).Six Sigma implementation - Hurdles and more hurdles.
Total Quality Management & Business
Excellence,16(6),721-725.
Hair, J. F., Jr., Black, W. C., Babin, B. J., Anderson, R. E., & Tatham, R. L. (2009). Análise
multivariada de dados (6a ed.). Porto Alegre:
Bookman.
Harry, M. J., Mann, P. S, Hodgins, O. C., Hulbert, R. L., & Lacke, C. J. (2010). Practitioner’s guide to statistics and lean six sigma for process improvement.
New Jersey: Wiley & Sons.
Harry, M., & Schroeder, R. (2000). Six Sigma: The new breakthrough management strategy
revolutionizing the world’s top corporation. New
York: Currency Doubleday.
International Project Management Association. (2006).Competence baseline version 3.0. Nijkerk: International Project Management Association.
Johnson, A., & Swisher, B. (2003). How Six Sigma improves R&D. Research-Technology
Management,46(2), 12-15.
Kaynack, H.(2003). The Relationship between total quality management practices and their effects on firm performance. Journal of Operations
Management, 21(4),405-435.
Kerzner, H. R.(1998).In search of excellence in project management: Successful practices in high
performance organizations. New York: Wiley &
Kessler, H., & Winkelhofer, G.(2002).
Projektmanagement: Leitfaden zur steuerung und
führung von projekten. Heidenberg: Springer.
Kondic, Z., Maglic, L., & Samerdzic, I.(2009). Analysis and ranking of factors impacting application of the 6 sigma: methodology in small production organizations using the prior factor ranking method.Technical Gazette, 16(2),17-25.
Kumar, M., & Antony, J.(2008).Comparing the quality management practices in UK SMEs.
Industrial Management & Data Systems, 108(9),
1153-1166.
Kwak, Y. H., & Anbari, F. T. (2006).Benefits, obstacles, and future of Six Sigma Approach.
Technovation,26(5-6),708-715.
Larson, E. W., & Gobeli, D. H. (1989). Significance of project management structure on development success.IEEE Transactions on
Engineering Management,36(2), 119-125.
Linderman, K., Schroeder, R. G., Zaheer, S., & Choo, A. S. (2003).Six Sigma: A goal-theoretic perspective. Journal of Operations
Management,21(2), 193-203.
Muller, R., & Turner, J. R.(2010). Attitudes and leadership competences for project success. Baltic
Journal of Management, 5(3),307-329.
Pande, P.S., Neuman, R. P., & Cavanagh, R. R. (2001). Estratégia Seis Sigma. Rio de Janeiro: Qualitymark.
Perry, J. C., & Lavori, P. W. (1983). The Predictive Index®: A report on reliability and construct validity.
Massachusetts: Praendex.
Picq, T.(2011).Manager une équipe projet. Paris: Dunod.
Pinto, J. K., & Prescott, J. E. (1988). Variations in critical success factors over the stages in the project life cycle. Journal of Management, 14(1), 5-18.
Project Management Institute. (2007).The guide
to project management body of knowledge: PMBOK.
Pennsylvania: Project Management Institute.
Project Management Institute.(2013).The guide to
project management body of knowledge: PMBOK.
Pennsylvania: Project Management Institute.
Rabechini, R., Jr. & Carvalho, M. M. (2003). Perfil das competências em equipes de projetos.
RAE Eletrônica, (2)1, 1-17. Recovered from
http://www.scielo.br/pdf/raeel/v2n1/v2n1a12
Rabechini, R., Jr. Carvalho, M. M., &Laurindo, F. J. B. (2002). Fatores críticos para implementação de gerenciamento por projetos: O caso de uma organização de pesquisa. Produção, 23(2),28-41.
Rose, J., Pedersen, K., Hosbond, J. H., & Kraemmergaard, P. (2007). Management competences, not tools and techniques: A grounded examination of software project management at Wm-data. Information and
Software Technology, 49(6), 605-624.
Schroeder, R. G., Linderman, K., Liedtke, C., & Choo, A. S. (2008).Six Sigma: Definition and underlying theory. Journal of Operations
Management,26(4), 536-554.
Shao, J., & Muller, R. (2011).The development of constructs of program context and program success: A qualitative study. International Journal
of Project Management, 29(8),947-959.
Shenhar, A. J., & Dvir, D. (2007). Reinventing project management: The diamond approach to
successful growth and innovation. Boston: Harvard
Business School Publishing.
Shtub, A., & Globerson, S. (1994).Project management: Engineering, technolog y, and
Skulmoski, G. J., & Hartman, F. T. (2010). Information systems project manager soft competencies: A project-phase investigation.
Project Management Journal, 41(1), 61-80.
Snee, R. D. (2001). Dealing with the achilles heel of six sigma initiatives. Quality Progress,34(3), 66.
Sommerville, J., & Langford, J.(1994). Multivariate influences on the people side of projects: Stress and conflict. International Journal
Of Project Management, 12(4),234-243.
Stevenson, D. H., & Starkweather, J. A. (2010). PM critical competency index: It execs prefer soft skills. International Journal Of Project
Management, 28(7),663-671.
Strang, K. D. (2007).Examining effective technology project leadership traits and behaviours.
Computers in Human Behaviour, 23(1), 424-462.
The Standish Group.(2009).The 10 laws of chaos. Boston, MA
Thévenet, L.-H., Salinesi, C., Etien, A., Gam, I., & Lassoued, M. (2006). Experimenting a modeling approach for designing organization’s strategies, in the context of strategic alignment.
Proceedings of the Australian Workshop on
Requirements Engineering – AWRE, Adelaide,
Australia, 11. Recovered from http://awre2006. cis.unisa.edu.au/proceedings/Paper%203%20 L.%20Thevenet.pdf
Trad, S., & Maximiniano, A. C. A. (2009). Seis Sigma: Fatores críticos de sucesso para sua implantação. Revista de Administração
Contemporânea, 13(4), 647-662.
Tukel, O. I., & Rom, W. O. (2001).An empirical investigation of project evaluation criteria. International Journal of Operations & Production
Management, 21(3), 400-416.
Van Iwaarden, J.,Van der Wielea, T., Daleb, B, Williamsa, R.,& Bertscha, B. (2008).The Six Sigma improvement approach: A transnational comparison. International Journal of Production
Research, 46(23), 6739-6758.
White, D., & Fortune, J. (2002). Current Practice in project management: An empirical study.
International Journal of Project Management,
20(1), 1-11.
Yeung, A. C. L., Cheng, T. C. E., & Lai, K.-H. (2006). An operational and institutional perspective on total quality management.
Production and Operations Management, 15(1),
156-170.
Zu, X., Fredendall, L. D., & Douglas, T. J. (2008). The evolving theory of quality management: The role of Six Sigma. Journal of Operations
Supporting agencies: The authors gratefully acknowledge the financial support of Brazil’s National Council for Scientific and Technological Development (Conselho Nacional de Desenvolvimento Científico e
Tecnológico, CNPq).
About the authors:
1. Daniela Santana Lambert Marzagão, PhD in Production Engineering, University of São Paulo – USP, Brazil. Email: [email protected]
2. Marly M. Carvalho, PhD in Production Engineering,, University of São Paulo – USP, Brazil. Email: [email protected]
Contribution of each author:
Contribution Daniela S. L. Marzagão Marly M. Carvalho
1. Definition of research problem √ √
2. Development of hypotheses or research questions (empirical studies) √ √
3. Development of theoretical propositions (theoretical Work) √ √
4. Theoretical foundation/Literature review √ √
5. Definition of methodological procedures √ √
6. Data collection √
7. Statistical analysis √
8. Analysis and interpretation of data √ √
9. Critical revision of the manuscript √ √