Exploring Games and Gameplay as a Means of Accessing and Using Geographical Information
William E. Cartwright, RMIT University
Gaming computers are now as powerful as their office/industry counterparts, or, in some cases, even more powerful. Gaming strategies and games could provide an innovative means for accessing geographical information, includ-ing geographical information accessed via the Web.
This paper reports on research undertaken to ascertain the usefulness of implementing a “games” interface for accessing geographical information. Three simple prototype packages were built and subsequently tested to see if access to information via a different interface would enhance information provided to users from a selected user group profile – the “Nintendo” group of users. Ormeling (1993) has identified this group as those users who have been exposed to computer games and thus potentially prefer access to computer-delivered information via this type of interface. The use of the prototypes was compared with the use of a conventional paper map for the same area and evaluations were completed to ascertain:
• The general operability of the products;
• Whether users preferred other metaphor approaches to traditional
map interfaces;
• Whether 3D graphic interfaces are preferable to 2D interfaces; and
• Whether this type of product provides a better “picture” of reality.
Furthermore, it was possible to conclude that this type of product provided a better understanding of a real place than a conventional map.
This paper provides a background to the research, information about how the research was conducted, results from the evaluations and propositions for further research.
Keywords: geographical knowledge, information access, interfaces, carto-graphy, multimedia
A new generation of geographical information users, the so-called Nin-tendo generation (Ormeling 1993), has emerged. This generation of users was not brought up on television alone. They are computer-savvy and attuned to navigating and using games interfaces, games controllers and to working with games strategies. They are mostly under 35 years of age and male (Clickz.com 2004b) and their focus on the use of tech-nology for information and entertainment is different from that of their parents and grandparents. Half of this new user population prefers to play games rather than reading or watching movies (Clickz.com 2004a).
This new generation of users of geographical information artefacts has different skills than their paper map consuming grandparents. This group might not be aware of, nor attuned to, the heritage of maps and mapping (and perhaps do not even care about their ignorance). They access and use maps and map-related services delivered via television, the Web and cellular telephones as part of how they “use” these composite digital services. There is a need to consider this group of new map (or map-related artefact) users and how the use of games-like tools may provide the means for geographical information access and geographical discovery in what could be considered to be non-conventional ways of delivery, ones better suited to this consumer group.
provided with different ways of using cartographic artefacts, products and interfaces than the conventional ones, products designed to accord with a consumption method that the group members have already mas-tered and in fact prefer. No user training in package use or navigation is necessary. Delivering geographical information in novel ways might better provide for this user group, which otherwise might be unwilling to use conventional methods of geographical information access and use. Conventional “maps”, whether they be static or dynamic, may not always be the best or the preferred method of access to geographical information or a preferred information consumption method by this group of users.
Banchoff and Brannon (1998) have noted that over the past several decades even the geographic sciences have been slowly disassociating themselves from maps and moved towards other means of geographical visualization.
The overwhelming effect of this live, in-your-face media coverage is that we have become generally desensitised by varying degrees, not only to disasters, but to geography itself. Maps do not matter any more because seeing an event as it happens puts us right on the spot; we have travelled around the globe in an instant, the television or computer monitor has be-come our virtual transportation device. We are right there … wherever there might be. Turn off the sound, take away the captions, and we might be looking at generic, archival footage taken from the media vaults.
(Banchoff & Brannon 1998, 6)
This paper reports on research that explores how the use of the game playing metaphor might be employed to provide tools that allow users to explore geography in a “different” manner, using different artefacts: those developed using an interface that is more games-like. These artefacts could allow users to explore geographical information in a serendipitous manner, allowing information to be discovered rather than “just” pre-sented to the users via a conventional map or a computer system where the delivery of information is still based on the map metaphor. Tradi-tional map products do “work”, but they only provide one viewpoint of geography – through the map metaphor – and New Media products, in-cluding games, offer the potential to provide different “views” of geo-graphy.
New Users
Once, maps were the realm of experienced users who knew the type of map needed for a particular application. They knew where to purchase them, the appropriate products to use and how to use them. Typical of these users were, and are, bushwalkers/ramblers; experienced users who had learnt the rules needed for deciphering the icons that make up the map image. For map publishers, this made life easy: produce the maps, force the users to become competent in using your products and then just continue. Now, the myriad of Web-accessible on-line map collec-tions and contemporary media products provide “maps for all”. Users are now unknown to the producers and their skills in map use and interpretation difficult to determine. This has meant that even naïve or inexperienced users must be catered-for.
They have different skills that need to be considered with regard to how they access information and, from a cartographic perspective, how they might prefer to use geographical information tools.
The Games Metaphor and Cartography
It has been argued by geographers/cartographers like Castner (1981) that the map model works best. However, users have to appreciate the “grammar” of cartography in order to fully understand the “language” of maps and how it depicts geography (including the associated “lies” that maps have to tell to illustrate the “truth”). Many new users of cartographic products have skills that could be exploited so as to better provide information about geography. One of these skills is the ability to play computer games or use computer games-like interfaces.
Can cartographic products that invite exploration be designed to be delivered in a computer games-like manner? Any cartographic artefact needs to be designed according to certain guidelines and these guidelines, once assembled, define the “look” of the product and its utility. Histori-cally, rules for map design and production have evolved, rather than been specifically constructed. Take for example a topographic map, where the contemporary “look” of the product is the evolution of hundreds of years of work related to design, trialling and redesign. Can games strategies and games tools be “instantly” introduced?
Multimedia and gameplay and geographic information need not be based on the typical puzzle solving / shoot-em up type games, but should consider the human part of the interpretation of the game. Computer games and the way they present landscapes help to reinforce certain ideologies. Game-play can be used as a means of allowing the user/viewer/participant to discover patterns of phenomena that are meaningful for each individual
user. (Cartwright 1996)
The research described in this paper is a tentative step towards exploring whether games can be applied to cartographic applications.
Gameplaying and the Exploration of Geography
Cartographers have always striven to produce artefacts that have both technical integrity and graphical quality. This process has been carried out under the “umbrella” of the historical conventions and procedures that have guided designs to successful outcomes. But with other approa-ches to information provision, such as gameplaying, perhaps we should consider strategies other than those that have usually been applied.
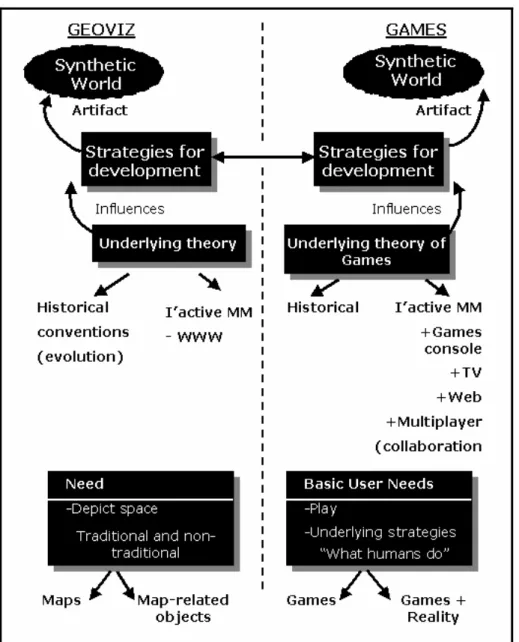
We have a need to produce artefacts that provide the stimulus for humans to create a mental map or a “synthetic world”. Using the “tradi-tional” approach would mean developing strategies for artefact design and production (strategies based on an underlying theory). Maps can then be produced for general consumption as paper maps or maps delivered via the Internet and viewed through Web browsers. We deve-lop strategies to satisfy the need to depict space using maps or map-like objects. If, instead, this process was to be guided by the theory of gameplaying, a synthetic world would still be produced, but the strategies for development would be influenced both by the need for creating accurate representations of the world (the key focus of cartography) and by gaming strategies (which could be employed to provide different, and perhaps more intuitive, methods for interacting with and moving through cartographic representations of the world).
Katz (1997) contended that games like Myst, Civilization and SimCity
are extraordinarily educational and that they require complex planning and rewards patience and strategic thinking. For example, the skills learned using games like SimCity, where players think little of moving from an aerial view, to a map, or to a subterranean view, could be app-lied to seeing multiple views of the city. Aerial views could be replaced by aeronautical charts, users could then move to topographic maps, move “down” through various scales to planimetric maps, down further to maps of the urban utilities infrastructure, further down to soil maps and finally to geological maps. Furthermore, geographical exploration pack-ages could be built around Chesher and McCarthy’s (1994) three genres of game: Action, Puzzle/Path and Entertainment. The Action metaphor could provide a user with the ability of moving through a simulated landscape, avoiding environmental pitfalls. The Puzzle/Path gameplayer could navigate through a virtual world where clues to navigation were uncovered by solving puzzles. And finally, an Entertainment package could provide a user with multimedia tools for building a comprehensive report on a particular geographic location or region.
To properly employ such alternative information delivery and con-sumption strategies, cartography needs to appreciate how games “work” and how games – and interactive multimedia gameplaying – might be employed to provide different images of reality. Similarly, cartography needs to consider both underlying theories and practical implementation realities if we are to use other, non-traditional approaches to geographical information provision. We need to develop strategies for using innova-tive methods and tools.
One of the characteristics of computer games that could be useful in developing games inspired interfaces to geographical information has been highlighted by Gonzalo Frasca, namely its dependency on both re-presentation and simulation (e.g. Frasca 2003, also quoted in Dillon 2005). According to Frasca (2001), whereas traditional narratives are representational, (video)games are also simulations in that they allow the user to influence the reality of the game world.
of the world and give the user/viewer a sense of geographical place. Electronic media can use the power of storytelling to transfer inform-ation about reality or “snapshots of reality”. Geographical stories could be constructed using Platt’s (1995) electronic storytelling genres: user as observer, user as director, or user as actor. As an observer, the user would have no control over the content or the sequence of events; the geo-graphical phenomena would be merely described. This would be useful for telling stories about terrain or features that need to be outlined in a certain way and to build a theoretical basis upon which later information could be constructed. As director the user would be able to manipulate the characters in the story and choose the storytellers from a list of available raconteurs. For a particular application where it is important to tell a story that has credibility or authenticity, a “panel” of storytellers could be directed by the user into particular parts of the story, providing the best storytellers for a particular information dissemination task. For example, if a geographical information product was to be interrogated for an agricultural application, the user could direct the storytelling exercise so that it told the story using expert storytellers from the fields of farm management, soil science, geology, agricultural science and meteorology. To place a particular part of the world into some sort of historical context, storytellers might include map curators from national libraries, university historians, geographers with particular knowledge about the area and individuals whose families had always lived in the area. As an
actor the user would become part of the story and digitally “woven” into
Testing the Concept – Games Interface Explorations
In order to test the usefulness of the games metaphor in cartographic artefacts and to begin developing strategies along those lines, a number of games-inspired interfaces were created and subsequently tested on a group of users. The testing comprised five stages: one pretest and four test routines.
1. Pre-testing the users to gain an understanding of their previous exposure to maps and other tools for accessing geographical inform-ation.
2. Testing the effectiveness of a multimedia geographical information product in comparison with a “conventional” paper map product.
3. Evaluating the candidates’ views on using other metaphors than the map metaphor as a basis for geographical information artefacts.
4. Testing whether 3D graphic interpretations of geography are pre-ferable to 2D ones.
5. Testing if a “rich media” geographical information product provides a different “view” of a certain geography than do paper maps.
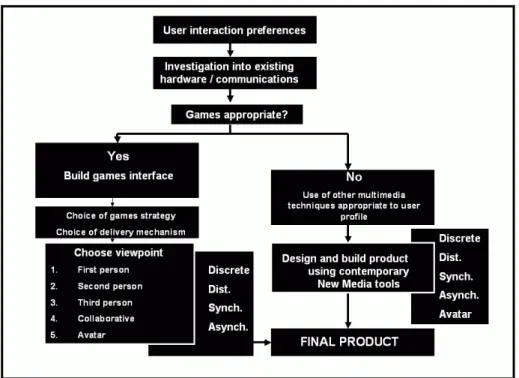
Figure 2. Evaluation components.
Stage 0
A pre-test was employed to compile a profile of the candidates. The group of candidates consisted of 50 first-year tertiary students studying in the geospatial sciences. Specific map-use information was collected through a questionnaire. The results from the pre-test allowed further testing to be completed with a knowledge about the characteristics of the group that was being tested and the level of their cartographic expertise. The participants provided the following information:
1. Age 2. Gender
3. Frequency of making enquiries about geographical information 4. How they used maps
5. If they used maps, how did they use them? 6. A self-rating of their expertise as a map user
7. How they generally used geographical information artefacts 8. If they produced mapping products, how did they produce them?
It turned out that the user group was typical of the Nintendo generation. Their ages ranged from 18–25. All candidates used maps and considered themselves to be mostly efficient or expert map users. They used a number of maps and map-like artefacts and they had experience in producing products with numerous electronic devices. The fact that the students were already attuned to using geographical information pro-ducts could mean that the results of the tests were somewhat biased.
Stage 1
The candidates were asked to find answers to a number of questions using both the paper atlas and the electronic atlas. Once this was done, the candidates were asked to list 3-5 things that they liked about the electronic version of the atlas, and 3-5 things that they disliked. They were further asked if they thought that the electronic atlas was better than a paper atlas, if they would use the product, and if it was easy to use.
In answer to the question “Is this atlas better than a paper atlas?” the positive comments made by candidates can be summarised as:
• The electronic atlas contained more facts
• Users could make comparisons between one country and an-other, comparing GNP, populations, etc.
• It was easier to search for specific information
• Not just “pure” map views were provided, which was seen as a useful addition
• Educational videos that highlighted certain features were useful for comprehension of certain facts
• “Highlighting” functions provided by the package enabled users to focus on certain information that was provided
However, some of the views in the questionnaire answers were more critical towards the electronic atlas:
• The information was regarded to be “shallow”, when compared to the paper version of the atlas
• The electronic atlas was generally thought to have advantages over the paper atlas, but it was not seen as a “better” product
• Problems with portability of the digital version of the atlas was not an issue with usage of the paper atlas
• Some candidates stated that they actually preferred paper carto-graphic products over their electronic counterparts
In answer to the question “Why would you use this product?” most of the candidates answered that they would use the electronic atlas, and provided the following reasons:
• It was easy to find facts
• It was “more interesting to use and navigate”
• Information was (relatively) quick to obtain
• It was most usable as a general reference atlas, insofar as infor-mation was easy to find
• Its “fast find” functions were appreciated
• Using videos and search functions to supplement the paper atlas was seen as a superior usage method to the paper alternative
• It was seen as a useful research tool when particular facts were needed, rather than for general information gathering exercises
In answer to the question “How easy is it to use?” the candidates found advantages with the electronic atlas:
• It was difficult to begin with, but once the best way to use the product was found, it proved to be an effective learning tool
• It was noted that this was especially so once the structure of the atlas was deciphered
• Using both text and images to search was viewed as being sup-portive of different user preferences
• It was intuitive to use and the information was presented in a logical manner
But there were also some concerns about the interface of the elec-tronic atlas:
• The product needed more detailed explanations about how it should best be used
• Forwards/backwards navigation was considered to need improve-ing
• On-line help should be included in the atlas
(These considerations are more related to interface issues, than to format issues.)
Looking generally at the results from this evaluation, what the candidates saw as positive elements of digital products was the ability to gain more facts than they could using the paper version, countries could be easily compared, and presentations that made use not only of “just” maps but also of rich media made the product more usable. The exist-ence of interactive navigation and search functions also provided enhanced atlas functions compared to the paper product. However, a number of users preferred to use the paper product rather than the digital version. Furthermore, the information in the digital atlas was seen, in some instances, to only provide “shallow” information, rather than in-depth information. It is possible that this criticism is related to the type of atlas – a general reference atlas – rather than the product itself.
Stage 2
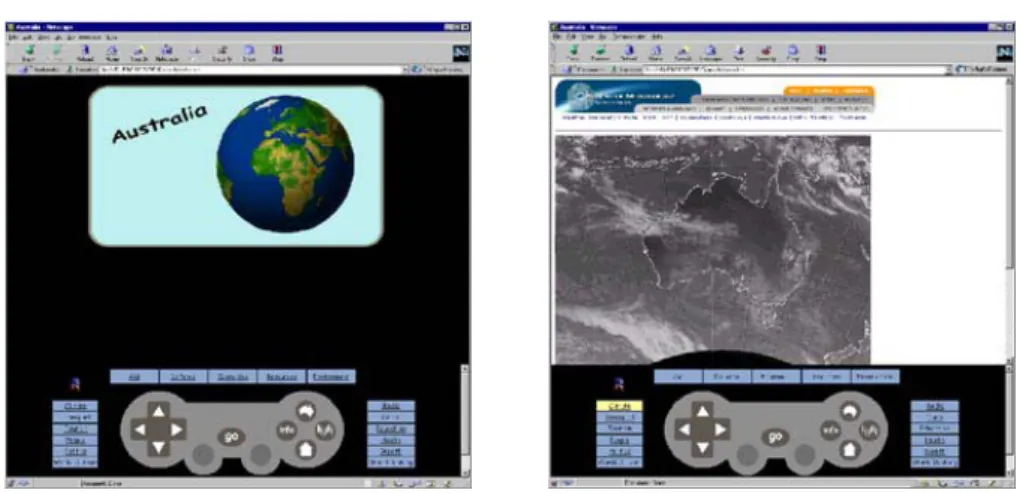
Figure 3. Gameplaying for the Nintendo Generation.
The questionnaire showed that candidates thought that metaphors helped them to better understand geography. They did not think that maps alone are best for understanding geographical information, but that the metaphor set illustrated was a useful adjunct to simply using maps. The candidates thought that the product in the test could be used with little prior experience and that a games-like interface was easier to use than traditional maps. They felt confident using it. The type of interface in the test product was in fact what they would choose over a con-ventional one. Finally, the candidates saw this type of interface as being appropriate for a first-time user. In general terms, this focus group of expert users/producers supported the concept of games metaphor use.
The candidates were also asked to comment on how the product could be used and to make some general operability comments. The questions asked were:
1. In your opinion, what would motivate users to use something like the demonstration product to complement maps for the “discovery” of geographical information?
4. Should this type of product try to mimic current computer games, or is this basic interface, without the glitz of commercial products, adequate for the task?
They generally found the package easy to use and the game-like control was considered good for users who are not competent with computers. The product was seen to be applicable to tourism, education (in schools) and in general information centres. Lastly, one of the concerns of the author was that the game-like interface would need to be similar to commercial games products with million-dollar budgets, which – nowadays – are usually “built” on the back of a blockbuster movie. This suspicion was confirmed by the focus group. Some said that while the concept and the interface might be “ok for children”, it would be in-adequate for other age groups. Therefore, to be useful this interface must be further developed with a “look and feel” similar to that of a commer-cial product.
Stage 3
Figure 4. Stage 3 evaluation prototype.
As both this interface and the previous interfaces developed for the stage 2 evaluation were designed to “link” to exactly the same inform-ation resources, the test would focus on interfaces, rather than the information access facilitated by each interface. The Reeves and Harmon (1993) User Interface Rating Tool for Interactive Multimedia was used as a “model” for constructing a questionnaire. Reeves and Harmon (1993) claim that novice users are generally not good candidates for using this type of evaluation. They consider users experienced with the type of program being rated or alternatively experienced designers of interactive products to be the best candidates for providing considered feedback. For this reason, only experienced users or producers/designers were included in the evaluation. This was the same group of evaluation candidates who completed the stage 2 evaluations of the project.
In the questionnaire used, the candidates were asked to rate the product according to 10 criteria:
Ease of use. The Ease of use category related to how easy users found
the product compared to the 2D version of the program. The users were asked to consider the general use of the VRML interface as well as the use of the mapping package.
Navigation. Navigation referred to the ease with which users could
to consider whether this type of 3D interface assisted or hampered com-prehension about their location in the package.
Cognitive load. The candidates were asked to consider how much
harder, or easier, the product was to use compared to the 2D version. And, whether they had to work harder mentally, or whether it was easier or more intuitive when using the 3D product compared to the 2D version.
Mapping. Mapping related to how the program tracks a user as they
use the program, and how it provides feedback. This can be in graphic form or through the use of some other medium. When considering this section, the candidates were asked to reflect upon whether or not the 3D version of the product was better in assisting the mapping of their location in the program. They were also asked to consider whether the “built-in” navigation and “world”-finding tools that are part of the general interface also assisted by providing “location in the product” feedback.
Screen design. Screen design referred to the actual design components,
colours, text, symbols etc. The candidates were instructed not to focus on the overall “look” of the product, but to concentrate more on its func-tionality.
Knowledge space compatibility. The category Knowledge space
com-patibility focussed on the type of information provided in the product. This prototype “test” product was designed as an atlas. All themes were not fully developed, as this was not required for the evaluation. The candidates were asked to ignore this in the evaluation and to assume that all thematic maps could be accessed.
Information presentation. Comments in this category had to do with
whether the information presented was in an understandable form. Had the users understood the information contained in the product and did they learn something about the themes illustrated in the map “pages”?
Media integration. Media integration related to the “putting together”
Aesthetics. Cartography has been defined in a number of ways, but it is generally considered to be an amalgam of ART, SCIENCE and TECH-NOLOGY. This part of the questionnaire looked at the ART element in cartography and the provision of geographical information. The “look” of the product and its form were considered. Information was needed to see whether the 3D product enhanced information presentation. As the addition of 3D displays can now be readily achieved using mapping and general graphics software it cannot be automatically assumed that 3D enhances the look of the product by merely being added. This part of the evaluation sought to establish whether the candidates considered the aesthetics of the product to be enhanced when the information was prov-ided in 3D.
Overall functionality. This category related to the perceived utility of
the product. As the product provided geographical information in an atlas format, this was the main criterion that candidates were asked to consider.
The candidates found that the cognitive load effort was generally easy with the 3D version. They liked the 3D screen design and found that the knowledge space capacity was generally good. Information presentation was highly valued, as was the aesthetics. Overall functionality was consid-ered to be easy. (It is interesting to note that Coors et al. (2005) had similar findings – that users preferred 3D to 2D – in their research into the use of maps on mobile devices.) Areas where the product did not score well were Ease of use, Navigation, Map content and Media inte-gration. These areas required further product development, map product enhancement and better integration of more media types.
Positive and negative comments from the “General Comments” section of the questionnaire are summarised below.
Positive comments Negative comments
• Easy for expert user. • Easy to navigate. • More intuitive to use. • 3D maps make for easier
comparisons to be made.
• Confusion about use of VRML. • Difficult for novice user.
• Scale/distance from viewer/size of map content needs to be considered. • Risk that 3D image looks more like a
• Easy to learn about connections. • Better because it looks more real.
• 3D product is closer to reality.
• 3D image more appealing to users, but it may not provide more information.
Table 1. Summary of comments on the product.
Using a games approach provided a “focussed” interface for Nintendo generation candidates. The next stage of the evaluation, Stage 4, looked at whether a “rich media” geographical information product would provide a better “picture” of geography than a conventional product with respect to how users perceive a “selection” of geography.
Stage 4
Subjective methods are typically used to determine the level of media quality required in applications. At this stage of evaluation, an attempt was made to implement a more formal approach. The evaluation procedure demanded that it be “built” on a sound educational theory and implemented through a proven modus operandi. The core edu-cational theories of Bloom’s learning behaviours, developed in his taxonomy of learning objectives (1956), were considered appropriate for developing tasks for formal evaluation of the prototype product. They were used to develop specific cartographic applications for testing. A summary of how Bloom’s learning behaviours can be translated into cartographic applications and how these have been implemented in this cartographic product are provided in Table 2.2
Measur
able
Geographical Usage Behaviour
s
Def
ine, describe
,
name, identify, recite, locate Comp
ile,
summarise, illustrate, map, generalise
Measur able Behav iou rs ( from W ak ef iel d, 1 9 98) Def ine, describe , memorize, lab el,
recognize, name, draw, state, iden- tify, select, w
rite,
locate, recite Summarize, restate, para- phrase, illust
rate, match , e xp lain ,
defend, relate, infer, compare
,
contrast, genera- lise
Cartograp
hi
c
Materials Maps,
atlases,
remotely sensed images, gazetteers, ... Compilation of a thematic map, desig
n
of a
carto-gram.
Educational Materials (
fr om W ak ef iel d, 1 9 98)
Events, people, newspa
pe
rs,
magazine articles
,
definitions, videos, dramas, tex
tb ooks, films , telev ision pro-grams, recordings , media p
resenta-tions Speech, story, drama, cartoon, diagram, graph
,
summary, outl
ine,
analogy, poster, bulletin b
oard
Geographical Education Foc
u
s
Learning geo
grap h ical f acts, for ex amp le
learning country names, capital cities and t
h
en
reciting this information. Taking geo
grap
h
ical
information, formed as a ‘mental map
’ and
then re-organisin
g
this information into a more coherent resour
ce.
Classification of information, for examp
le takin g the po pula tio n
sizes of countries and th
en
re-ordering
count
ries
according to popula
tio n s ize . Educational Foc u s (fr om Wakefield, 1 998 )
Focuses upon t
h
e
rememb
ering and
reciting of information. Focuses upon relating and org
anizin
g
previously learned information.
Measur
able
Geographical Usage Behaviour
s Design, p roject, classify, dep ict Comp are, classify,
measure, calcu- late, assemble, disassemb
le, map Measur able Behavi ours ( from W ak ef iel d, 1 9 98) Appl y, chan ge, put toget h er,
construct, dis- cover, produ
ce,
make, report, sketch,
solve,
show, collect, pre
p ar e Ex amine, classif y,
categorize, re- search, contrast, comp
are,
disas-semb
le,
different-tiate, separate, investigate,
su b-div ide Cartograp hi c Materials Th ematic map.
Mathematical element: ap
p
li-cation of map projections. A
rt
element: map design. Science element: under- lying d
istri
bution
theory. Techno- logy in
put: choice
of p
roduction
technology/ software and deli- very technology/ communications systems. Th
ematic map –
pa pe r o r d elive re d
electronically. May contain
a
tool to assist usage, for e
xamp le a map legend for the pa pe r m ap o r
an interactive ‘how to’ tool in an interactive multimedia pro
d
uct.
Educational Materials (
fr om W ak ef iel d, 1 9 98) Diagram, s culp -ture, illust ration,
dramatization, forecast, p
ro b lem, puzzle, organi
za-tions, classifica- tions, rules, systems, routines Surve
y,
questionnaire, an argument, a model, disp
lays,
demonstrations, diagrams, s
ystems,
conclusions, report, grap
hed
information
Geographical Education Foc
u s Using geogra ph ic al
knowledge and producin
g a t
h ematic map that illustrates classified informati on.
Information is symb
olised and a m
ap product realised, for ex ample p roducin g an iso-demograp h ic m ap that illust rates com-pa ra tive po p u la tio n sizes by changing the
actual size of count
ries
depicted. Relative
s
izes
of countries are determined b
y t h eir po pula tio n s ize , ra the r
than their landmass
.
Using
map
information
to comp
are region t
o region, city to city, for ex amp le usin g t h e po pula tio n m ap describ ed in th e
previous cell to comp
are th e relative p op u lations of va rious countries in a v isual way. Educational Focus (fr om Wakefield, 1 998 ) Using meth ods,
concepts, principles and th
eories in
new
situations. Critical t
h inkin g wh ich focuses upon
parts and t
Measur
able
Geographical Usage Behaviour
s B u ffer, com b ine,
re-combine, differentiate, integrate, layer, order, f
ilter,
select, map Comp
are, rep
ort
,
assess, value, apprai
se, consider
,
p
roject, grade, demark, and sp
e-cu late Measur able Behavi ours ( from W ak ef iel d, 1 9 98) Comb ine, h yp o-thesize, construct , origin ate, create,
design, formulate, role-play, develop Comp
are,
recommend, assess, value, app
raise, solv e, critic ize, wei gh, consider, deb ate Cartograp hi c Materials Map s, measurin g tools, g eog raph i-cal v is u alization
systems, Geo- grap
hic
Inf
orm-ation Systems, Cartographic Information Sys- tems. Considered and informed decision-making using an
array of cartograp h ic arte-facts, for ex amp le dev elop ing ‘wh at if'’-scenarios us ing Geograp h ic Infor-mation Systems.
Educational Materials (
fr om W ak ef iel d, 1 9 98) Ex p eriment,
game, song, re- port, po
em , pro se , sp eculation, crea-tion, art,
invent-tion, drama, rules Recommenda- tions, self-evalua- tions, g
roup d is-cuss ions, deb ate,
court trial, stand- ards, editorials, value
s
Geographical Education Foc
u
s
Taking a n
u mb er of cartograp h ic artefac ts
and using t
h
em to
assemb
le data ab
out a certain geog rap h ica l
region, for e
xample
using an
atlas, w
h
ich
contains maps, gra
p
hs
,
diagrams and tex
tual
information and ‘assembling
'’inf orm -ation ab out a geo-grap hical regio n . O r, alternativ ely, a GIS . Taking ‘assemb led’ information ab out a geograp h ical region
(from many carto- graph
ic artefacts) and
making a decision about the
relative gr owth , economic position, en vironm ental status, etc. Educational Foc u s (fr om Wakefield, 1 998 ) Critical t h inkin g wh ich focuses upon putting parts
to-gether to form a new and original wh
ole. Critical t h inkin g wh ich focuses upon va luing a n d m
ak-ing judgements base
d upo n in fo r-mation.
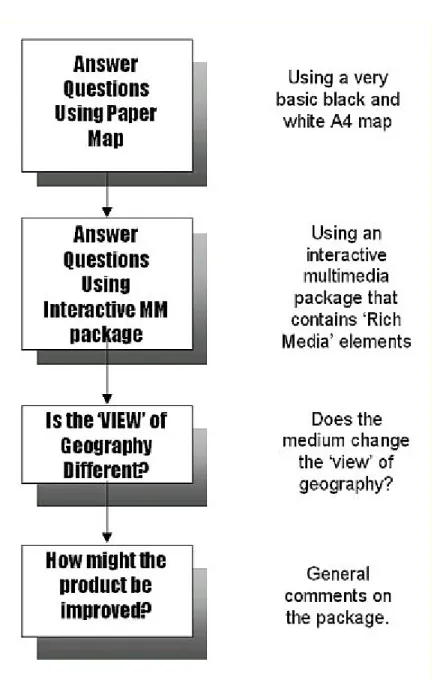
The same 8 candidates as before were first asked to answer the ques-tions using a paper map of the selected area and then with a 3D/Web information source, the Townsville Geoknowledge Project interactive multimedia product, developed for this evaluation (Cartwright, Williams & Pettit 2003). The questions asked are provided in Table 3.
Figure 5. Stage 4 evaluation prototype.
Application of Bloom's Taxonomy to Geogra-phical
Education Task Question
Knowledge General undirected map reading. Name the main streets in the central area of Townsville. Identify the harbours in the town, what are their names? Locate the railway station, the panoramic lookout point, the entrance to the harbour and the way to the airport.
Comprehen-sion
Directed map reading. Users are asked to locate specific items and then to summarise and generalise this information.
Application Classification of information shown in the product and making general considerations related to the production of a ‘second generation’ map product that would encapsulate the essential elements of the town.
Considering the information shown on the map, how would you classify the basic elements of the town? If you were asked to produce a map that encapsulated the essential ‘things’ that comprise the town what would these elements be?
Analysis Considering different topo-graphical features. Measuring distances. Calculation of travelling times.
Compare the central city area to the surrounding areas. How are they different topographically? Measure the distance from the panoramic lookout to the entrance of the main harbour. Calculate how long it would take you to walk this distance. Synthesis Making informed judgements
from the geographical infor-mation provided. Selecting information deemed to be important.
Differentiate between the main elements of the town. What are they? If you were asked to act as a tourist guide to visitors to the town, which places would you take them to? Select two places that would provide the ‘key’ points to visit. Evaluation Comparing the town to other
towns. Evaluating the value of the town’s attributes. Projecting possible scenarios.
Comparing this town to where you live, what do you think are the main differences? What do you think is the value of the harbour to the town? Speculate that if there was a flooding related to a tropical cyclone, which areas of the town would be most likely effected?
Table 3. Formal basis for the questionnaire – applying Bloom’s Tax-onomy to cartographic products.
Figure 6. Stage 4 evaluation components.
moderately difficult, difficult, hard, very hard or impossible. Once they had done this with the paper map, the candidates went through the same procedure using the interactive multimedia package. One of the focus elements of this evaluation was to investigate if perceptions of geographical places are dependent upon the medium used.
There were definite changes in how the candidates viewed their allocated tasks when using the paper map and when completing the same tasks with the interactive multimedia product. Questions relating to the
Knowledge section were rated, in the worst cases, as impossible/very
difficult to answer with the paper map. This changed to fairly easy/easy with the multimedia product. For Comprehension hard/difficult moved to moderately difficult/easy. Application tasks were rated hard/moderately difficult when the paper map was used and moderately difficult/fairly easy with the multimedia product. Analysis-related questions were impossible/moderately difficult with the paper map and fairly easy/easy with the multimedia product. There was no change with the Synthesis
tasks. Evaluation specific questions were rated impossible/moderately difficult with the paper map. This perception changed to moderately difficult/easy with the multimedia product. In general terms, five of the “umbrella” task areas were easier to perform with the multimedia pro-duct, albeit two of the five tasks only changed slightly. This indicates the effectiveness of “rich media” products.
The users commented that with the interactive multimedia product it was easier to imagine what the town looked like and to get a feeling for the topography. The functions of the various districts in the town were obvious and existing personal experiences could be enhanced. Generally, the candidates commented positively on the ability to gain an enhanced appreciation of the town with the interactive multimedia product.
Deliberations Related to Choosing a Gaming Approach
The basic premise of using maps and other (geo)visualization artefacts is to build mental models of reality. Ptolemy believed maps to be the means to “exhibit to human understanding […] the earth through a portrait” (Crane 2003, 33). Historically, maps have been used to provide information to users about places recently discovered or voyages made to unknown worlds or hitherto seemingly impossible journeys.
Figure 7. Elements that influence the depiction of spatial phenomena.
Cartography needs to think differently about how to provide access to information, including geographical information. But how should a “new” system be designed? Bradbury (1997) explored what a modern
Mappa Mundi might be like. He foresaw that it would be divided into
three parts: a complex data system capturing the real environment, a powerful modelling system and an interface. It would be visual, multi-dimensional and provide computer graphics-generated displays.
Computer games and the ways in which they present landscapes help to reinforce certain ideologies (Tivers 1996). If gameplay is to be used as a means of allowing the user/viewer/participant to discover patterns of phenomena that are meaningful for each individual user, then the game-play needs to consider not just the way things appear on the surface, but also what is happening to the human part of the interaction. Digital interactive mapping products need to be designed and produced with human interaction in mind and multimedia gameplaying, in its various forms, can assist greatly.
Figure 8. Decisions regarding the utilisation of gaming strategies and tools.
Where To with Cartographic Theory and Games Theory?
in thinking that stresses that better tools can be produced by combining traditional representation methods with simulation. Many cartographic products, such as atlases and thematic maps, can also be linked to the narrative, where linear and non-linear stories are told using the “grammar” of cartography. For example, Monmonier (1992) proposed the use of “Graphic Scripts”, whereby users would be provided with a “guided tour” which would include narratives of useful/interesting information. Here, a sequence of cartographic “events” could be pre-programmed, and users would be taken through a (geographically) logical set of steps that exposed the user to the pertinent information that needed to be communicated. Furthermore, cartographic products can be improved by exploring how games are played and how players explore virtual worlds with adventure games.
remembering the rules, generating appropriate simulations and allowing certain movement and interaction, whereas the human brain controls interpretation, visualization and the comprehension of geography.
Conclusion
This article has suggested a direction for research on the provision of a “different” interactive multimedia package for the exploration of geo-graphical space. It has outlined the main evaluation procedures followed in the project reported on and provided the results from the various stages of evaluation.
As a multimedia installation of this type changes the way in which users access and use geographical information, an evaluation of this information provision genre now seems appropriate. Apart from gauging the success of the use of the product there is a need to assess how such a product changes the user’s viewpoint of geographical reality and thus a particular view of space. It is hoped that by using an interactive multi-media installation that encourages exploration in ways that new geo-graphical information consumers feel comfortable with, a better (if not different) perception of what the world is composed of will occur. Therefore, the evaluation was completed to assess whether the package and its use provided better tools for exploration and if it provided different perceptions of geography.
Using a games approach provided a “focussed” interface to test on the Nintendo generation. It is argued that it is worth continuing with experi-ments related to the effectiveness of such interfaces if the true value of different interfaces for particular generations of map users is to be judged.
Acknowledgements
Graphics development, HTML programming and Dreamweaver deve-lopment for the Web interfaces, from the author’s designs and layouts, were completed by Susanne Liebschen, exchange student from the Uni-versity of Applied Sciences, Dresden, Germany.
Notes
1. With due apologies to MacEachren; see his excellent book How Maps Work (1995) for an expert analysis of how cartographic artefacts, maps, “work”.
References
banchoff, t. f. & g. brannon (1998). “Living in a World Without Maps: Some Thoughts about Cartography in a Spatially Dysfunctional World.” SoC Bulletin 32:2: 5–7.
bloom b. s. (1956). Taxonomy of Educational Objectives, Handbook I: The Cognitive
Domain. New York: David McKay.
bradbury, r. (1997). “A Mappa Mundi for the New Millennium.” GIS User 22: 47–49.
cartwright, w. e. (1996). “New Metaphors for User Access to Multimedia and Hypermedia Mapping/Geographical Information Systems Products.” Proceedings of the 28th International Geographical Congress, Symposium 11: Electronic Atlases – A New Way of Presenting Geographical Information. The Hague, The Netherlands.
cartwright, w. e. (1999). “Extending the Map Metaphor Using Web Delivered Multimedia.” International Journal of Geographical Information Science 13. 4: 335–353.
cartwright, w. e. (2002). “Web Cartography: Historical Perspective and Future Opportunities.” Proceedings of the Web.Mapping.2002 Symposium,Karlsruhe, Germany, September. Ed. H. Asche. 1.1–1.33.
cartwright, w., b. williams & c. pettit (2003). “Realizing the ‘Literate Tra-veller’.” Spatial Sciences Institute Conference Proceedings 2003. Canberra, Australia: Spatial Sciences Institute. cd-rom.
castner, h. w. (1981). “Might there be a Suzuki Method in Cartographic Edu-cation?” Cartographica 18.1: 59–67.
champion, e. (2004). “Indiana Jones and the Joystick of Doom: Understanding the Past via Computer Games.” Traffic 5: 47–65.
chesher, c. & p. mccarthy (1994). “When a Floppy Disk Holds More than a CD-ROM.” Proceedings of the Multimedia and Design Conference. Eds. M. L. Maher, R. Coyne & S. Newton. Sydney: University of Sydney. 191–200.
clickz.com (2004a). “Playing Online Games.”
<http://www.clickz.com/stats/big_picture/demographics/article.php/3312301> [2004-09-03]
clickz.com (2004b). “Who’s Playing Games.”
<http://www.clickz.com/stats/big_picture/demographics/article.php/5901_3070391> [2004-09-03]
coors, v., c. elting, c. kray & k. laakso (2005). “Presenting Route Instruc-tions on Mobile Devices: From Textual DirecInstruc-tions to 3D Visualization.” Exploring Geovisualization. Eds. J. Dykes, A. M. MacEachren & M.-J. Kraak. Amsterdam: Else-vier. 529–550.
crane, n. (2003). “Changing Our View of the World.” Geographical April 2003: 33– 37.
dillon, t. (2005). “Computer Game Theory: Narrative vs. Ludology.” Viewpoint. NESTA Futurelab. <http://nestafuturelab.org/viewpoint/art56.htm> [2006-01-03]
frasca, g. (2001). “Simulation 101: Simulation versus Representation.” Ludology.org.
<http://www.ludology.org/articles/sim1/simulation101.html>[2006-04-20]
frasca, g. (2003). “Simulation versus Narrative: Introduction to Ludology.” The Video Game Theory Reader. Eds. M. J. P. Wolf & B. Perron. London & New York: Routledge. 221–236.
germanchis, t., c. pettit & w. cartwright (2005). “Using Computer Gaming Technology To Explore Human Wayfinding And Navigation Abilities Within A Built Environment.” Proceedings of the 21st International Cartographic Conference. A Coruña: International Cartographic Association, CD-ROM.
juul, j. (2003). “Just What Is It that Makes Computer Games so Appealing?” The Ivory Tower. International Game Developers Association.
<www.igda.org/columns/ivorytower/ivory_Apr03.php> [2006-01-09]
kuhn, w. (1992). “Let Metaphors Overcome Their Wimp Image.” Proceedings of NCGIA Research Initiative 13, Technical Report 92-3. Eds. D. M. Mark & A. U. Frank. 87–92.
laurini, r. (2001). Information Systems for Urban Planning: A Hypermedia Co-operative Approach. London: Taylor & Francis.
maceachren, a. m. (1995). How Maps Work. New York: Guildford Press.
mcintosh, t. (1995). “Philips Plugs Internet Straight into Your Telly.” The Austra-lian October 24: 31.
monmonier, m. (1992). “Authoring Graphics Scripts: Experiences and Principles.”
Cartography and Geographic Information Systems 19.4: 247–260.
ormeling, f. (1993). “Ariadne’s Thread: Structure in Multimedia Atlases.”
Proceedings of the 16th International Cartographic Association Conference, Köln, Germany, 3–6 May. International Cartographic Association. 1093–1100.
pearce, c. (2002). “Towards a Game Theory of Game.” First Person: New Media as Story, Performance, and Game. Eds. N. Wardrip-Fruin & P. Harrigan. Cambridge, MA: MIT Press. 143–153. Also available as <www.cpandfriends.com/writing/first-person.html> [2006-01-03]
platt, c. (1995). “Interactive Entertainment. Who writes it? Who reads it? Who needs it?” Wired September: 144–149, 195–197.
reeves, t. c. & s. w. harmon (1993). User Interface Rating Tool for Interactive Multimedia. <http://www.ceismc.gatech.edu/MM_Tools/UIRF.html> [2003-10-12]
riddell, r. (1997). “Doom Goes to War.” Wired April: 114–118, 166.
smyth, m. & r. knott (1994). ”The Role of Metaphor at the Human Computer Interface.” Proceedings OZCHI94. 287–291.
tivers, j. (1996). “Playing with Nature.” The Geographical Magazine April: 17–19.
virizi, r. a. (1992). “Refining the Test Phase of Usability Evaluation: How Many Subjects is Enough?” Human Factors 34.4: 457–468.
wakefield, d. v. (1998). “Address to the Governor’s Teaching Fellows, Athens Georgia, November 19, 1998.”