109
THE OPTIMIZATION OF THE SESSILE OAK (QUERCUS PETRAEA)
STANDS STRUCTURE TO THE N-E OF MEHEDINTI PLATEAU
FLORIN - DORIAN COJOACĂ1, CONSTANTIN NEŢOIU1
, IULIAN BERCEA1
1Faculty of Agriculture and Horticulture of the University of Craiova,
E-mail: [email protected]
keywords: optimization, theoretical functions, structural characteristics
ABSTRACT
The paper presents the structural particularities of the sessile oak stands to the studied area with the trees distribution by with their diameter and their volume. After the specified processings, for the sampled forest stands, there were determinated the statistical parameters to the experimental distributions.
Using suitable theoretical functions, the experimental distributions were optimized, and finally, there were obtained mathematical models which reflect the optimum structure of the sessile oak stands by with the trees diameter.
The elaborated structural models have a big practical utility, especially in the execution of the sylvotechnical works, and so, we can notice which diameter categories need an intervention for leading the real structure of the forest stands to the theoretical structure.
1. INTRODUCTION
The mode that the trees develop in a forest stand with a permanent competition, after the embarrassment, the favoring and the rivalry determinate the forest stand structure.
The knowledge of the a forest stand structure offers information for the legals between the different biometrical characteristics of the trees that compose the forest stand.
The knowledge of the optimal structures of the sessile oak forest stands to the studied area is necessary for the sustainable management of the forests.
Generally, the forests with echien and relative echien structure (like the forests taken in study) are management after mathematical models, respecting the legal’s of structuring of the forest stands, so the chosen solution is having an ecological explanation. (Giurgiu, 1979, Leahu, 1984, 1994).
2. SCOPE AND OBJECTIVES
The researches had for scope the structural particularities tot the sessile oak stands to the NE of Mehedinti Plateau.
Knowing the main scope of the researches, there were establish the following objectives:
- the determination of the main biometrical characteristics which show the structure of these forest stands;
- the characterization of the forest stands by structure in relation with the diameter and the volume of the trees;
- the optimization of the forest stands structure using theoretical functions.
3. MATERIALS AND METHODS
For the forest stands structure optimization, the researches were made in representative areas by the sessile oak spreading to the studied area, the O.S. Tarniţa, D.S. Mehedinţi.
110
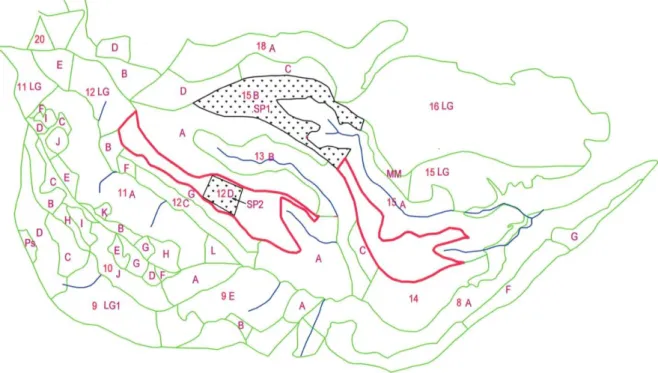
The research material represents the forest stands to u.a. 15B and 12D. These are placed in U.P. III Crainici, OS Tarniţa, D.S. Mehedinţi (fig. 1).
Figure 1. – Location of the experimental plots
On the field, for every stand there were located a experimental plots which was measured with the GPS.
The field works consisted by inventories on classes diameter to 2 in 2 cm by the measurement to the diameter to 1,30 m to ground to all the trees to the space of its.
By the structure optimization to the studied forest stands, was appealed to the their structure characterization by Charlier, type A distribution and Beta theoretical distribution (specified to the echien and relative- echien structures.) That functions can adapt to a big diversity to experimental distributions and they are suitable to the properly interpretation to the specified results to the pursued objective.
The theoretical Charlier, type A distribution takes in consideration the asymmetry (a3) and the kurtosis (a4) by the next frequency function (Giurgiu, 1979, Leahu, 1994):
... ,
24 1 6
1
ˆ ( ) 3 ( ) 4 ( )
IV
u III
u
u a f a f
f s Nh
n (1)
where :
) (u
f is the frequency function to the normal distribution, 2 )
(
2
2
1 u
u e
f
; (2) f III (u) - is the III class derived to the f(u) function, fIII(ui)(3ui ui)f(ui); (3)
f IV (u) - is the IV class derived to the f(u) function, fIV(ui)(ui4 6ui23)f(ui); (4)
u - the normal deviation ( ,
s d d
u where 2 2
s d
d g ); (5)
111
3
a - the asymmetry coefficient,
k i i k i i i n s d d n a 1 3 1 3 3 ) (; (6)
4
a - the kurtosis coefficient, 3 ) ( 4 1 4 4
Ns d d a N i i; (7)
d - the arithmetic average to the diameter classes (d); N - the total tree number by the forest stand taken in study; h - the range size between the diameter classes;
n - the theoretical frequencies.
The frequency function (the repartition density) type Beta has the next expression (Giurgiu,1979, Leahu, 1994):
b a dx x b a x x b a x N x f ) ( ) ( ) ( ) ( )( (8)
where : x is the trees diameter;
a and b - the minimum diameter, respective the maximum diameter to the trees of forest stand
α and γ - the Beta distribution exponents; N - the total trees number.
The unitary volumes were calculated using the method of two - factors regression equation for the trees volume (Giurgiu, Decei, Drăghiciu, 2004):
h a h a d a d a a
v 3 4 2
2 2 1
0 log log log log
log , (9) where: d - the dbh of the tree;
h - the height of the tree; v- the volume of the tree;
a0, a1, a2, a3, a4 - the regression coefficients, established on species (Giurgiu, Decei, Drăghiciu, 2004).
By the multiplication of the unitary volumes with the trees number there resultated the multiples volumes, and by by their summing there were determinate the total volumes. The verification of the quality to the experimental distributions with the theoretical distributions was realized with 2 the adjustment test.
4. RESEARCH RESULTS
4.1. Stands structure by the trees diameter
In the statistical analysis of the forest populations, the DBH is the most important biometrical indicator, of dimensional characterization of the forest stands, both on its relevance regarding the tree form but because of the facilities in measurement, processing and interpretation.
112
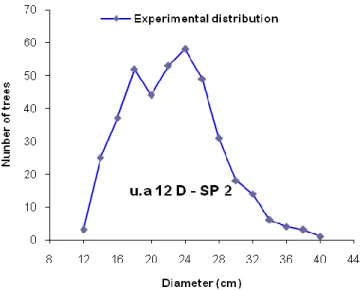
Figure 2. The experimental distribution of the Figure 3 The experimental distribution of the
number of trees in diameter classes in S.P. 1 number of trees in diameter classes in S.P.2
We observe that, to the studied areas, the DBH of the trees varies to 10 at 46 cm (table 1).
Table 1 Statistical parameters of the experimental distribution
of the number of trees in diameter classes
Specifications SP1 (ua 15B) SP2 (ua 12D)
Minimal (cm) 10,00 12,00 Maximal (cm) 46,00 40,00
Amplitude (cm) 36,00 28,00 Average (cm) 27,78 22,57 Varianţa (cm2
) - s2 - 31,93 28,72 Standard deviation (s) 5,65 5,36
The coefficient of variation (s%) 20,34 23,74
The standard deviation of the average (cm) 0,21 0,27
Index of asymmetry (A) 0,38 0,42
Index of kurtosis (E) 0,53 -0,13
The variation coefficients (s%) have values under 30%, proving the homogeneity to the two forest stands, so the scattering degree to the values around the averages of the distributions is low. Also, we can observe that any distribution doesn’t present an index of the significantly kurtosis.
By the asymmetry index, the both forest stands have a positive left asymmetry, characteristic for these types of forest stands. The asymmetry and kurtosis indexes are very important for the choice of the theoretical distribution type.
113
biomass accumulation. So, a little number of favoured trees attain big diameters by the embarrassment to a much bigger number of copies with small diameters” (Giurgiu, 1979, Leahu, 1994).
4.2. Stands structure by the trees volume
As the forest stand structure by the trees diameter, some aspects of the forest stand structure by the trees volume could be express by the trees distribution on volume classes. This type of distribution in less studied (Leahu, 1994).
Analyzing the frequency bends that express the trees distribution on volumes classes (fig. 4 and 5), we observe the positive left asymmetry to the frequency bends, so,
„the majority of the trees is classify in the lower volumes categories “. Also, this left
asymmetry is more pronounced than the distribution bends asymmetry of the trees on diameter classes (u.a 15B: Avol = 1,15, Adiam = 0,38; u.a 12D: Avol = 1,13, Adiam = 0,42).
SP 2 - u.a 12D
Varianta (s^2)= 0,06 Abaterea standard (s) = 0,25 Coef. de variatie (s%) = 53,08
Asimetria (A) = 1,13 Excesul (E) = 1,57
0 10 20 30 40 50 60 70
0 0,2 0,4 0,6 0,8 1 1,2 1,4 1,6
Clase de volume, mc
N
um
a
r de
a
rbo
ri
Nr. Arbori
Fig. 4. The experimental distribution of the Fig. 5 The experimental distribution of the
number of trees in volume classes in u.a 15B number of trees in volume classes in u.a 12D
For the variability of the trees volume, we observe that the values of the variation coefficients are much bigger than the values of the diameter variation coefficients (u.a 15B: s%vol= 44,99; s%d = 20,34; u.a 12D: s%vol = 53,08; s%d = 23,74). This thing is explicable if we know that the trees volume is the result of the variation of the diameter, the height and the form coefficient.
4.3. Optimal structures of the researched forest stands
4.3.1. The fitting of the experimental distribution of the number of trees in diameter classes
How we specified previously, the left asymmetry is a characteristic of these frequence curves, because „the extension of the right branch of the frequence bend is determinated by the growth of the thick trees which develop the crown, being less influenced by the others trees to the inferior ceiling” (Leahu, 1984).
SP 1 - u.a. 15B
Varianta (s^2) = 0,10 Abaterea standard (s) = 0,32 Coef. de variatie (s%) = 44,99
Asimetria (A) = 1,15 Excesul (E) = 1,85
0 20 40 60 80 100 120 140
0 0,2 0,4 0,6 0,8 1 1,2 1,4 1,6 1,8 2
Clase de volume, mc
N
u
m
a
r
a
rb
o
ri
114
The manifestation of the left asymmetry (positive) is an important particularity for the choice of the theoretical distribution type after that we make the adjustment. In the specialty literature, often is proposed the using of Charlier distribution- type A because, „by the introduction in calculation to the asymmetry index and to the kurtosis index […], that’s more flexible ” (Giurgiu, 1972) and „ this must be applied when the asymmetry indexes and the kurtosis indexes show significantly values”.
So, there wes used this theoretical distribution for the adjustment of the real distributions to the trees number on diameter classes (fig. 6 şi 7), but with the theoretical distribution Beta (fig. 8 şi 9).This function is very flexible and it is used for the continuous variables.
)] ( 00542 . 0 ) ( 07 . 0 ) ( [( 51 , 148
^
i IV i
III
i f u f u
u f
n
Fig. 6 The fitting of the experimental distribution Fig. 7 The fitting of the experimentaldistribution of the number of trees in diameter classes of the number of trees in diameter classes with with theoretical distribution Charlier A in SP1 theoretical distributions Charlier A in SP2
n= 0.0000000023986 (x – 9)4.09 (47 – x)4.21
n= 0.000261 (x – 11)1.48 (41 – x)2.95
)] ( 022 . 0 ) ( 063 . 0 ) ( [( 55 , 266
^
i IV i
III
i f u f u
u f
115
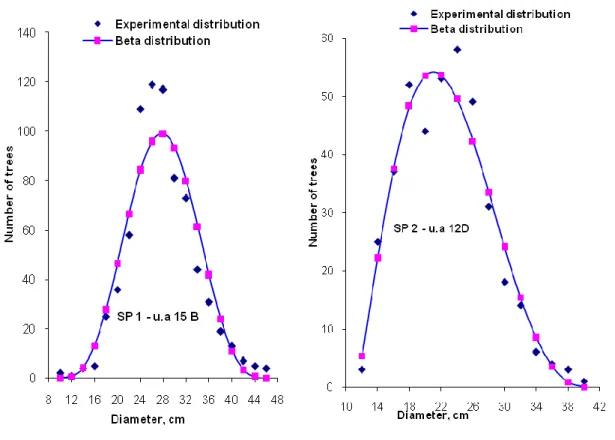
Fig. 8 The fitting of the experimental distribution Fig. 9 The fitting of the experimentaldistribution of the number of trees in diameter classes of the number of trees in diameter classes with with theoretical distribution Beta in SP1 theoretical distributions Beta in SP2
The significance of the difference between the empirical distribution and theoretical distribution was analyzes with the test of adjustment2
, known for the statistics examination of the significance (table 2).
Table 2
Significance analysis between the experimental distribution and the theoretical distribution
Experi-mental
plots
Statiscal test
% 5 2
teoretic
Charlier distribution Beta distribution Experimental
distribution (χ2
exp)
Theoretical distribution
(χ2 0,05)
Experimental distribution
(χ2 exp)
Theoretical distribution
(χ2 0,05)
1
(u.a 15B) 11,34 19,68 20,82 23,68
2
(u.a 12D) 7,70 14,07 9,575 19,68
After the adjustement of the experimental distributions with the theoretical function Charlier type A and Beta and the verification of the quality of the adjustment with the test
2
we can take the next essential conclusion: the experimental value is less than the theoretical values (exp2 < 02,05), so the experimental dates follow the two theoretical regularities, and the two distributions are almost the same.
4.3.2. The establishment of the optimal structures
116
For the establishment of the normal distribution (optimum) for the forest stands taken in study was calculated the average quadratic reside (the standard deviation of the appraisal) - snnˆ - considering optimum that theoretical distribution for which there was obtained the smallest average quadratic reside (table 3) and which realize the most appropriate graphic adjustment.
Table 3
Significance of the distinction between experimental distribution and theoretical distribution
Statistical parameters
u.a 15B (SP I) u.a 12D (SP II)
Ch. ß Ch. ß
2 exp
χ 11,34 20,82 7,70 9,575
2 teor
χ 19,68 23,68 14,07 19,68
α 5% 5% 5% 5%
g.l. 11 14 7 11
n n
s ˆ 0,93 1,79 1,03 0,89
α = probabilitatea de transgresiune; g.l. = grade de libertate;
n n
s ˆ= reziduul mediu pătratic; Ind. stat. = indicatori statistici
Ch. = distribuția teoretică Charlier tip A; ß = distribuția teoretică Beta.
How we can observe to the table 3, the theoretical distributions with the smalles average quadratic reside are the Charlier function, type A for u.a 15B (snnˆ = 0,93) and Beta function for u.a 12D (snnˆ = 0,89), for which correspond the next mathematical models:
(10) for u.a. 15B (SP1)
n = 0.000261 (x – 11)1.48 (41 – x)2.95 (11) for u.a 12D (SP2)
These distributions represent mathematical expressions of structure to the optimum structure of the forest stands by the distribution of the trees number on diameter classes.
5. CONCLUSIONS
By the made researches we tried the highlighting of the particularities and of the regularities about the structure to the sessile oak forest stands to the NE of Mehedinti Plateau. In this sense, we can formulate the next conclusions for the researches results:
- the two sessile oak forest stands a high homogeneity, specific for the echien and relative echien forest stands. This thing is confirmed with the values of the variation coefficients to the diameters (s%) which have values under 25;
- the structure of the studied forest stands by the trees diameter, confirm previous researches to the echien and relative echien forest stands in the sense that these are characterized graphically by a curve with a certain asymmetry and flattening, that could have ecological explanations. So, we found that the sessile oak forest stands of the two prove areas (u.a 15B şi u.a12D), is distributed after a frequency curve characterization by a positive left asymmetry (A>0), with a maximum. This means that we constate a bigger frequency to the trees to middle categories in the same time with the extension of the right twig of the curve;
- the structure of the forest stand in report with the trees volume shows a positive left asymmetry more evident that the asymmetry of the curves to repartition of the trees on diameter categories (u.a 15B: Avol = 1,15, Adiam = 0,38; u.a 12D: Avol = 1,13, Adiam = 0,42);
)] ( 022 . 0 ) ( 063 . 0 ) ( [( 55 , 266
^
i IV i
III
i f u f u
u f
117
- the studied forest stands present a big variability to the volumes (the variation coefficients of the volume (s%vol) have values between 44,99% and 53,08%);
- how the asymmetry of the frequency curve to the tree number on diameter classes represents a general phenomen, the experimental distributions to the trees number on diameter classes were shaped by theoretical distributions recommended of the speciality literature (Charlier, tip A şi Beta). These functions are very flexible and they permit a good adaptation at several specific cases (experimental distributions);
- for the test of the meaning, we used the statistical test of adjustment χ2. The results of the researches highlighted, in the both experimental plots and for the both adjustement fuction, some small values to the experimental dates comparing with the theoretical values( 2
experimental
< 2
teoretic
). These prove the fact that the experimental
distributions follow the two regularities, so the two distributions (experimental and theoretical) don’t distinguish significantly.
- for the establishment of the mathematical model which reproduces the optimum structure of the forest stands by the diameter of the trees, there was used the average quadratic reside (snnˆ). So, for u.a. 15B, there were resulted the next mathematical model
reproduced by the Charlier function, type A:
(12)
and for u.a12D, the optimal structure is characterizated by Beta function, like in the next formulate:
95 , 2 48
, 1
) 41 ( ) 11 ( 00006558 ,
0 100 ˆ
% x x
N n
n (13)
The knowledge of the frequency function of the trees by the diameter( the relations 12 and 13) permits the determination of the proportion of the trees number on diameter classes, and the comparing of the theoretical distribution considered normal with the real distribution of the trees number an diameter classes permits „the establishment of principle to the application mode of the thinning methods necessary for the raising of the forest productivity by the indication of the diameter surplus or deficient classes by the trees number”. So the increase of the growth in volume to the stands could obtain by the change of the distribution of the trees number on diameter classes, effect that can be obtained by the rational management of the forest stands, applying a certain the thinning methods.
6. BIBLIOGRAPHY
1. Giurgiu, V., 1972 - Statistical methods applied in forestry, Ceres Publishing House, Bucharest;
2. Giurgiu, V., 1979 - Dendrometrics and forestry auxology. Ceres Publishing House, Bucharest;
3. Giurgiu, V., Decei, I., Drăghiciu, D. - 2004 - Dendrometrics methods and tables. Ceres Publishing House, Bucharest;
4. Leahu, I., 1984 – Functional-structural methods and models in management forests functional. Ceres Publishing House, Bucharest;
5. Leahu, I., 1994 - Forest mensuration. Didactic and Pedagogic Publishing House, Bucharest.
)] ( 022 . 0 ) ( 063 . 0 ) ( [( 40 , 35 100 ˆ %
^
i IV i
III
i f u f u
u f N
n