89
INFLUENCE TANK SOMATIC CELL COUNT COOLING THE
COMPOSITION OF MILK COW
M COLĂ .,FLORICA COLĂ
University of Craiova faculty of Agronomy
Key words: somatic cell count, fat, solid non-fat, protein,urea nitrogen
ABSTRACT
The experiment was done on samples of milk collected from the farm SCDA Simnic bulk tank milk in the summer of 2010. The fallowing parameters were determined: somatic cell count, fat, solid non-fat, protein,urea nitrogen and the test for antibiotic or inhibitory substances. High somatic cell count milk has lower protein and solid non-fat levels and increased levels of fat than low cell count milk. Mean milk urea nitrogen of 12.68 indicates a possible dietary deficiency. No antibiotic or inhibitory substances were detected.
INTRODUCTION
Bulk tank SCC indicates the overall level of mammary inflammation in the milking herd at each milking. It is the bulk tank SCC that is used by the milk processor plant to determine milk quality premiums to the producer. A single cow with high SCC probably will not increase the bulk tank SCC by very much, however if the herd has many chronically infected cows, then the bulk tank SCC may increase significantly. High SCC milk is not desirable because it reduces the shelf life of dairy products and diminishes the quantity and quality of milk.
It is generally accepted that during mastitis, there is an decrease in caseins coupled with an influx of blood-borne proteins (such as serum albumin, immunoglobulins, the minor
serum proteins, transferring, α- macroglobulin) into the milk . According to Auldist et al.
(1995) and Auldist and Hubble (1998) this increase in proteins of blood serum origin during mastitis is possibly due to a disruption to the integrity of the mammary epithelia by microbial toxins and opening of the tight junctions. Auldist and Hubble (1998) continue that the decrease in casein concentrations during mastitis is largely due to post-secretory degradation of casein by proteinases originating from mastitis-causing organisms, leucocytes or the blood and in part to a reduction in the synthesis and secretion of casein as a result of physical damage to the mammary epithelial cells by microbial toxins during mastitis. This has important implications for the manufacturing potential of the milk, particularly, but not exclusively, for cheese manufacture.
On the other hand, the whey proteins synthesised de novo are relatively resistant to
proteolytic attack. However, in mastitic and high SCC milk there is an evident decrease in α-lactalbumin and β-lactoglobulin. This would be, according to Auldist and Hubble (1998), partly due to impaired cellular synthetic and secretory function, and partly due to leakage of these proteins out of the milk and into the extra-cellular fluid via the paracellular pathways that proliferate during mastitis. To support their theory the authors mention that
an elevated concentrations of α-lactalbumin in the blood of cows with elevated SCC is
registered.
There are contradictory results in the literature dealing with the effect of mastitis on fat content. For example, Auldist and Hubble (1998) report a decrease in fat concentration, but the majority of the authors recorded an increase in total fat content of mastitic milk.
90
in breakdown of triglycerides, oxidation of fatty acids and off-flavours. It has been assumed that milk with a high SCC is more susceptible to spontaneous lipolysis. The factors that increase the hydrolysis of triacylglycerols in the fat droplet, during mastitis, are very poorly understood. One possible explanation is that this process may be accentuated by the addition of blood-serum components (Na+ and Cl-) to the milk during mastitis.
These are residual antibiotic in the milk and tissue after treatment with antibiotic for mastitis.. Each antibiotic has a prescribed period where the milk from that cow should not be put into the bulk tank. The presence of antibiotics is prohibit in milk intended for human consumption to protect hypersensitive individuals from exposure to specific antibiotics and to reduce the remote possibility of the emerge of antibiotic resistant organism in milk.
Urea is produced in the liver from ammonia derived mainly from the breakdown of the protein in the rumen and from normal daily metabolism of absorbed amino acids and body protein. If bacteria in the rumen cannot capture the ammonia and convert it to microbial protein, the excess ammonia is absorbed across the rumen wall. Excess ammonia circulating in blood can be toxic and the conversion of blood ammonia to urea is the way to prevent the toxicity. The body excretes blood urea in urine and milk. Urea nitrogen (N) levels in blood and milk of an individual cow are highly related. Milk urea nitrogen (MUN) values should not be use by themselves when evaluate a herds's feeding program but can be used in conjunction with evaluating milk productions records feeding management practices, and dry matte, degradable protein, undegradable protein, nonstructural carbohydrates, and water intake.
MATERIAL AND METHOD
The present study was conducted during April 2010 to October 2010 at Agricultural Research &Development Station Simnic Craiova. The work was completed at Agricultural Research & Development Station Șimnic (A.R.D.S.S.) Romania. Somatic cell count was estimated using SOMASCOPE milk test MK II (Delta instruments). Fat, solids non-fat,protein were determined using Ultrasonic Milk Analyzers ECOMILK(EON trading). Presence of antibiotic or inhibitory substances was tested with EKOTEST(EON trading). Assays were made on 53 composite milk samples collected in sterile bottles directily from the bulk milk tank. The milk samples were collected twice per day after each milking.
Milk samples, were taken to measure also milk urea nitrogen. Samples were analysed at Institut of Animal Diagnostic and Health Bucharest Romania ( I.D.S.A. Bucharest, Romania ). Data were analysed statistically
RESULTS AND DISCUSSIONS
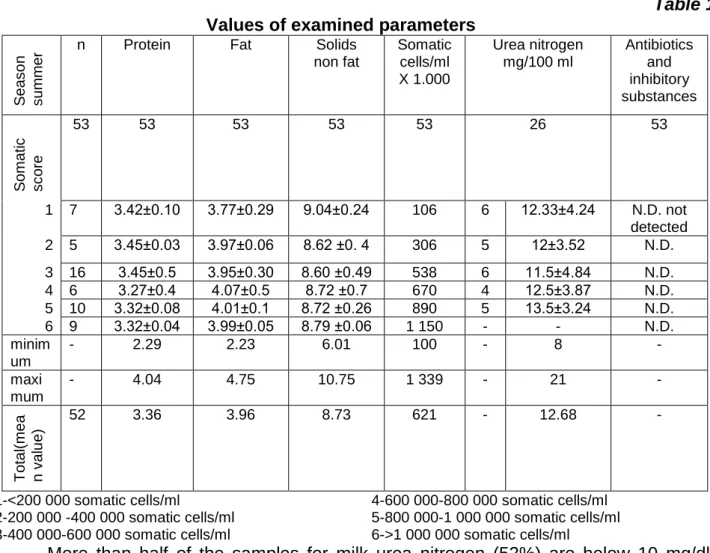
Table 1 shows correlations among variables in the study. The mean protein content in milk decreased from 3.42±0.10 to 3.32±0.04. This decreased was previous reported (2) and the results of the present study suggest that is due to the influx of SCC in the milk. The fat content of milk rise steadily reaching a peak of 4.07±0,5 in the samples with over 600 000 cells/ml.
91
Table 1
Values of examined parameters
S
ea
s
o
n
s
um
me
r n Protein Fat Solids non fat
Somatic cells/ml X 1.000
Urea nitrogen mg/100 ml
Antibiotics and inhibitory substances
S
om
ati
c
s
c
ore
53 53 53 53 53 26 53
1 7 3.42±0.10 3.77±0.29 9.04±0.24 106 6 12.33±4.24 N.D. not detected 2 5 3.45±0.03 3.97±0.06 8.62 ±0. 4 306 5 12±3.52 N.D.
3 16 3.45±0.5 3.95±0.30 8.60 ±0.49 538 6 11.5±4.84 N.D. 4 6 3.27±0.4 4.07±0.5 8.72 ±0.7 670 4 12.5±3.87 N.D. 5 10 3.32±0.08 4.01±0.1 8.72 ±0.26 890 5 13.5±3.24 N.D. 6 9 3.32±0.04 3.99±0.05 8.79 ±0.06 1 150 - - N.D. minim
um
- 2.29 2.23 6.01 100 - 8 -
maxi mum
- 4.04 4.75 10.75 1 339 - 21 -
T
ota
l(
m
ea
n v
al
u
e)
52 3.36 3.96 8.73 621 - 12.68 -
1-<200 000 somatic cells/ml 4-600 000-800 000 somatic cells/ml 2-200 000 -400 000 somatic cells/ml 5-800 000-1 000 000 somatic cells/ml 3-400 000-600 000 somatic cells/ml 6->1 000 000 somatic cells/ml
More than half of the samples for milk urea nitrogen (52%) are below 10 mg/dl. These results show an excess of energy and an imbalanced of ruminal protein, protein fraction and energy (nonstructural carbohydrates).
The mean fat content of the cows’ milk was 3.91% for spring period, 4.00% for
summer period and 4.10% for autumn. The mean protein content was 3.40% for spring period, 3.30% for summerperiodand3.20%forautumn. The mean solids non fat content was 9.02% for spring period, 8.70% for summer period and 8.48% for autumn. The mean freezing point was -0.589°C for spring period -0.571°C for summer period and -0.556°C for autumn. The extreme levels of milk fat content were recorded in May (3.81%) and in October4.21%. The extreme values of protein content, 3.46% and 3.14% were in May and in October respectively. Solids non fat had the highest values in May (9.14%) and the lowest October (8.31%). Freezing point had the highest valuesinApril(0.579°C) andthelo west October (-0.546°).
Table2 shows seasonal variation in all components and parameters. In general, fat, protein, solids nonfat percentages and freezing point had a minimum value in the spring and a maximum value in the autumn. Although the level of the main components can differ, similar seasonal patterns have been found in other studies .
92
increased ventilation, changing the time of feeding to the late afternoon, and an appropriate administration of mineral elements with the feed rations are necessary to prevent deterioration of cheese yield and quality. Nutrition can be regarded as one of the most important sources of variation in the yield and composition of milk, but climatic conditions and seasonal variation and regional differences can also play an important role. Also the quality and the composition of the milk are of the most importance to the dairy industry and human health because milk composition is related to milk process ability.
Figure 1 Mean fat and protein percentages for a period of 7 months ( April-October)
Table 2.
Mean values of examined parameters Fat ±SD Protein ±SD Freezing ±SD
Point
Solids ±SD no fat
April 4.02 0.68 3.35 0.03 -0.579 0.07 8.91 0.17 May 3.81 0.21 3.46 0.14 -0.600 0.01 9.14 0.32
Mean 3.91 0.44 3.40 0.08 -0.589 0.04 9.02 0.24 June 4.00 0.25 3.33 0.07 -0.578 0.01 8.82 0.21
July 4.04 0.28 3.33 0.12 -0.577 0.01 8.74 0.48 August 3.97 0.18 3.24 0.18 -0.560 0.02 8.56 0.42 Mean 4.00
September 3.99 October 4.21 Mean 4.10
0.35 0.25 0.57 0.41
3.30 3.27 3.14 3.20
0.12 -0.571 0.01 0.17 -0.567 0.02 0.27 -0.546 0.51 0.22 -0.546 0.26
8.70 0.37 8.66 0.44 8.31 0.66 8.48 0.55 Mean IV-X 4.00 0.34 3.30 0.14 -0.572 0.06 8.73 0.38
The amount of fat in milk composition was affected by a lot of factors. The seasonal variation and lactation period were the important factors among them. In the lactating cow, seasonal variations have been observed for milk protein content and to a lesser extent, for the milk fat content. This might ascribe a high light-to-dark ratio leading to a reduction in fat and protein contents of milk, probably as a consequence of a greater secretion of prolactin whose concentration in plasma is higher in the summer than in winter.
CONCLUSIONS
1. The total protein content does not seem to change significantly and these variations in protein are probably due to the decline in levels of casein.
2. High cell count milk has lower solid non-fat levels, but incred levels of fat probably as a result of incresed levels of blood constituents in milk and decred levels of the components of mammary origin.
4,02
3,81 4 4,04 3,97 3,99
4,21
3,35 3,46 3,33 3,33 3,24 3,27
3,14
0 0,5 1 1,5 2 2,5 3 3,5 4 4,5
April Ma y June July August Septem ber October
93
3. When interpreting bulk tank SCC it is important to remember that elevation of the count may result from a few cows having exceptionally high cell counts or from a general elevation of counts in many of the cows in the herd. The large variations of somatic cells observed in this study are probably the result of one or two cows with more than 1 000 000 cells/ml. The influence of season (summer) can also explain these figures.
4. Bulk tank counts do not provide any information about which cows are affected. Never the less they alert that there are problems in the herd. The somatic cells must be determine from individual quarter samples.
5. Mean milk urea nitrogen of 12.68 indicates a possible dietary deficiency, which can result when the rumen bacteria yield is reduced, thereby limiting milk production and milk protein yield.
6. It was determined that the fat content has been affected importantly by the seasonal changes. However the other contents of milk was not affected significantly by this factor. According to the results obtained in this study, it is possible to say that when the milk fat content was higher, protein, total solid contents, freezing point were also higher and that milk fat, protein and total solid percentages were the lowest during the spring and the highest during the autumn.
7. The chemical composition of milk can be highly variable in concentrations and yearly patterns, and protein and fat content can vary independently, regardless of factors that are difficult to control in the short term (average estimated breeding value, calving period). Therefore, substantial opportunity exists to manipulate independently the mean concentrations and patterns of protein and fat content, in particular through nutritional factors.
BIBLIOGRAPHY
1. Auldist, M.J., Hubble, I.B., 1998-Effects of mastitis on raw milk and dairy products. The Australian Journal of Dairy Technology, 53: 28-36.
2. Bruckmaier R.M., O., C.E., Blum, J.W., 2004-Fractionized milk composition in dairy
cows with subclinical mastitis, Veterinary medicine-Czech, 8(283-290).
3. Colă M., Colă F.,2016-Study on certain indicators of oxidative stress used in diagnosing sub-clinical mastitis in cows, 16th International Multidisciplinary Scientific GeoConference Sgem Conference Proceedings, ISBN 978-619-7105-68-1 / ISSN 1314-2704, June 28 - July 6, 2016, Book 6 Vol. 1, pp. 775-782 .
4. Cola M., Cola F,2017- Researches Regarding The Profile Of Fatty Acids In The Milk
Resulting From Cows Diagnosed With Sub-Clinical Mastitis. 17 International multidisciplinary scientific geoconference & expo sgem , 770-782.
5. Găvan C,, Pătru C., Pavel E.R., Ciobanu C., 2009-Estimation of commercial milk parameters during season of the year in high producing Holstein cows, Analele Universității din Craiova, vol.XXXIX/A,The scientific conference with international participation „Durable agriculture- agriculture of the future”,Craiova, pag.132-135, ISSN 1841-8317
6. Kiro R.P., Stefanov E., 2006-Milk composition changes during mastitis,
www.milkproduction.com