Lucrări ştiinŃifice Zootehnie şi Biotehnologii, vol. 41(1) (2008), Timişoara
THE EFFICIENCY OF THE UTILIZATION OF
ELEMENTARY SELENIUM ADDITION TO THE RATIONS
FOR CHICKENS
EFICIEN
ł
A UTILIZ
Ă
RII ADAUSURILOR DE SELENIU
ELEMENTAR ÎN RA
ł
IILE TINERETULUI AVICOL
CAISÎN LARISA
Faculty of animal Sciences and Biotechnologies, Chishinau, Moldova
Almost all off the fodders don't provide necessity in selenium. Micro supplements of selenium salts into chicken’s ration favor stimulation of growth. Necessity in producing of mixed food with supplement of selenium for chickens are obvious. In order to study the efficiency of the utilization of selenium addition in the chicken rations we have done a scientific and farm experiment. During the experiment an addition of selenium at the level 0.25mg/kg of dry substance with fodder and water was added to the rations of the chickens in the experimental group. The data on the live mass have shown that the live mass of the chickens in the experimental groups was greater in comparison with that in the control group. In our experiments, in using selenium supplements in mixed food for quick-growing chickens we also got positive results in body mass, spending of fodders and preservation, but it is necessary to continue research.
Key words: selenium, quick-growing chickens, inorganic salts
Introduction
The biological qualities of selenium have been used as a basis for a large utilization in prevention and treatment of many diseases. Its influence on different functions of the body depends much on the strong binding of this microelement with a component part of the body, namely sulphur.
Selenium has the capacity to replace the sulphur in sulphuretted bindings, and to influence intensively the proteinic metabolism of sulphuric amino-acids.
There is a synergy between the selenium and alphatocopherol which is characterized by reciprocal decrease of the necessary quantity in them, but it doesn’t lead to the replacement of the activity of each other (2).
The diseases brought about by the deficiency in selenium are wide spread and cause considerable economic losses. These diseases are: myopia, diathesis, arthritis, parodentosis, etc.
In Grobovschi’s experiments the best results were obtained when to the rations for chickens of the age from one to sixty days sodium selenite in the quantity of 0.2 mg and vitamin E in the quantity of 10 mg per 1 kg of dry fodder were added (3). Odinet’s and Tomschih’s researches (1976) (6) proved that when the sodium selenite (0.2 mg/kg) was added to the complex fodder the chickens received extra 0.1 mg of selenium per head a day. Selenium given per bone in the same quantity did not influence negatively on the hematological indexes, anatomical system of internal organs, and productivity. At an admissible norm for a person, namely 0.05 mg of selenium per 24 hours, its content in the poultry meat and liver is of admissible limits. Therefore, the fowls that have been fed with the addition of sodium selenite (0.2 mg/kg of complex fodder) can be used in alimentation without restrictions (5).
Selenium poisoning is registered when the quantity of selenium is more than 15 mg/kg per body mass (12). In USA, Canada and England the selenium quantity for broiler chickens is of 0.10-0.15 mg/kg (16).
In connection with this fact, it is necessary to determine the quantity and methods of adding selenium to the fodder for chickens. The study of the impact of elementary selenium admixture on the fowls growing was the aim for these researches.
Material and Methods
In order to study the efficiency of the elementary selenium addition (with water and fodder) for chickens in the conditions of an individual farm researches were carried out during the period from 08.03.07 till 06.06.2007.
To perform the experiments there were used chickens, the crossbreeds of two hen breeds of mixed productivity – Silvery Adler and Jubilee Cucinsc, reared at the individual enterprise “Victor Harin”. The chickens for the experiment were selected using the method of analogues groups (of a single breed, age, weight, etc.) taking as a guide the “Methodical directions regarding the undertaking of scientific and experimental researches on fowl feeding (15).”
The researches lasted ninety days which were divided into two periods: I period – 41 days; II period – 42-90 days.
The selected chickens were divided into three lots 20 heads each.
The scientific and experimental researches regarding the efficiency of the impact of the selenium addition to the rations of fodder for chickens were carried out using the following scheme (Table1).
Table1
The scheme of scientific and experimental researches
Lots n Alimentation characteristics
witness 20 BR – Basic ration
One of the peculiarities of the chicken feeding in the first experimental lot was the fact that they were given in addition to the main fodder ration elementary selenium in the proportion of 0.25 mg/kg of dry substance of the total quantity of fodder.
The difference of the chicken feeding in the second experimental lot was that they were given elementary selenium in the proportion of 0.25mg/kg of dry substance together with water.
The breeding conditions of the chickens in the witness lot as well as of those in the experimental lots were similar.
It was used the breeding on permanent floor/ground with the air humidity of 70-75% and an average air temperature of 24-26°C.
The feeding was done by balanced rations in accordance with the “Norms and rations of agricultural animals breeding (4)
The live mass of the fowls was appraised by individual weighing at the beginning of the experiment (at the age of one day), after 7 days, and at the end of each experimental period.
The used quantity of fodder for the specific consumption was calculated on the basis of the data about the live mass and fodder consumption.
The chicken viability was appraised keeping a record of dead chickens.
The slaughter of the chickens was done in accordance with the “Methodical recommendation for undertaking scientific researches on fowl feeding (15)”, and the poultry quality was appraised in accordance with the “Methodical studies of poultry meat and poultry meat products” (1).
The obtained results were worked out statistically.
Results and Discussions
The chicken feeding was done according to the complex rations, which were prepared purposefully for the given studies taking into consideration each period of age and live mass. Fodder grown and spread in the given climatic zone was utilized to prepare them.
The quantity of selenium in the rations was calculated using the data from different books.
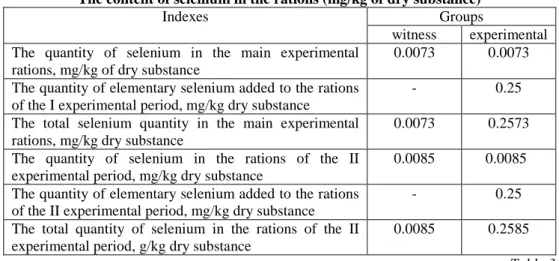
Table 2
The content of selenium in the rations (mg/kg of dry substance)
Indexes Groups
witness experimental The quantity of selenium in the main experimental
rations, mg/kg of dry substance
0.0073 0.0073
The quantity of elementary selenium added to the rations of the I experimental period, mg/kg dry substance
- 0.25
The total selenium quantity in the main experimental rations, mg/kg dry substance
0.0073 0.2573
The quantity of selenium in the rations of the II experimental period, mg/kg dry substance
0.0085 0.0085
The quantity of elementary selenium added to the rations of the II experimental period, mg/kg dry substance
- 0.25
The total quantity of selenium in the rations of the II experimental period, g/kg dry substance
0.0085 0.2585
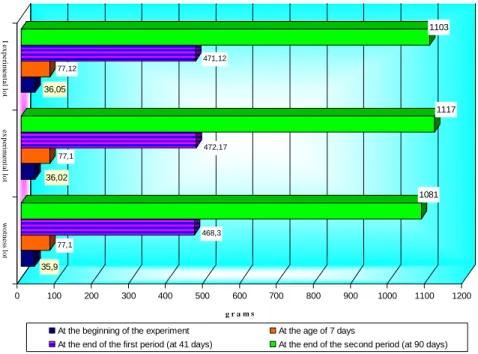
Table 3
The live mass (M±m) and the daily average growth of the experimental chickens
Experimental periods
Live mass of a chicken, g
witness I experimental II experimental; At the beginning of the
experiment
35.9±0.15 36.02±017 36.05±0.03
At the age of 7 days 77.10±0.36 77.13±0.24 77.02±0.17 At the end of the first
experimental period (41 days)
468.3±0.68 472.17±0.95 471.12±0.69
At the end of the second experimental period (90 days)
1081±0.99 1117±0.64* 1103±0.79**
The mass growth, g: total
average
1045 11.61
1081 12.01
1067 11.86
*B = 0.99 **B = 0.999
* – in comparison with the witness group;
** – in comparison with the first experimental group.
Diagram1. The dynamic of the live mass and the daily average growth of the
The data about the body mass and fodder consumption gave the possibility to calculate the fodder utilization per a growth unit of live mass (tab. 4).
Table 4
Fodder consumption per one kg increase in weight of body live mass
Indexes Lots
witness I experimental II experimental Fodder consumption per 1 kg of
increase: kg %
3.65 100
3.48 95.3
3.55 97.2
In table 4 it can be observed that the fodder consumption in the first and second experimental lots was lower with 4.6% and 2.7% respectively in comparison with the witness lot.
The analysis of the table 4 shows that the chicken viability in the first experimental lot was greater in comparison with the two others with 2.5%.
At the end of the researches the chickens were slaughtered. On this purpose three heads which had the same live mass, age and fattening capacity were selected from each lot. In table 5 and diagram 2 there are given the data about the chicken carcass weight obtained at their slaughter.
35,9 77,1
468,3
1081 36,02
77,1
472,17
1117 36,05
77,12
471,12
1103
0 100 200 300 400 500 600 700 800 900 1000 1100 1200
g r a m s
w
o
tn
e
ss
lo
t
e
x
p
er
im
en
ta
l l
o
t
I e
x
p
e
ri
m
e
n
ta
l l
o
t
At the beginning of the experiment At the age of 7 days
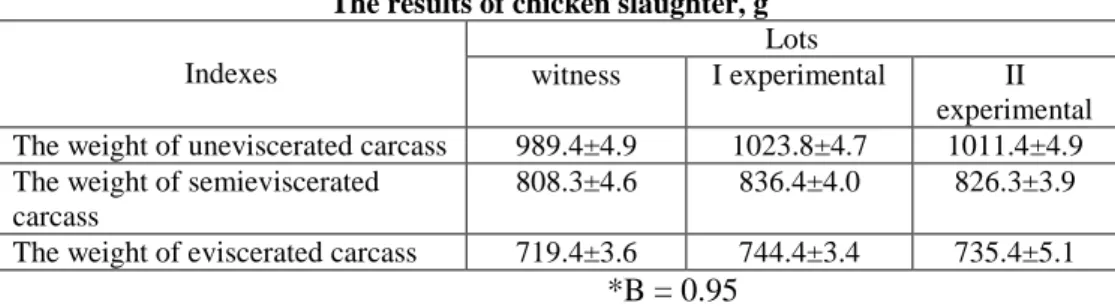
Table 5
The results of chicken slaughter, g
Indexes
Lots
witness I experimental II experimental The weight of uneviscerated carcass 989.4±4.9 1023.8±4.7 1011.4±4.9 The weight of semieviscerated
carcass
808.3±4.6 836.4±4.0 826.3±3.9
The weight of eviscerated carcass 719.4±3.6 744.4±3.4 735.4±5.1
*B = 0.95
The analysis of the results of the chicken slaughter showed that the eviscerated carcass weight in the first experimental lot was 744.4±3.4g, in the second experimental lot it was 735.4±5.1g, which is 3.4% and 2.2 % greater respectively in comparison to the witness lot (B=0.95). The difference between the eviscerated carcass weight in the first and second experimental lots was 9g or 1.2%.
Diagram 2. The results obtained at the chicken slaughter
At the addition of elementary selenium in the chicken rations the mass of the internal organs increased together with the body live mass and the carcass mass. In the table 6 it can be observed that the chickens in the second experimental lot have the largest weight of liver and predominate the witness and the first experimental lots with 3.5g (B=0.999) and 0,6g respectively. The greatest heart weight was observed in the first experimental lot which is greater than in the witness and second experimental lots with 5.1g and 4.1g. The muscular stomach weight as well as the liver weight is greater in the first experimental lot, in comparison to the witness and the second experimental lots with 2.5g and 0.2g respectively.
989
808,3
719,4
1023,8
836,4
744,4
1011,4
826,3
735,4
0 200 400 600 800 1000 1200
g
r
a
m
s
Control group I experimental group II experimental group
Table 6
Weigh difference of the edible and inedible parts of thecarcass
Indexes
Lots
witness I experimental II experimental The mass of edible parts:
- liver - heart
- muscular stomach
24.8±0.15 17.5±0.11 39.3±0.21 27.7±0.19 22.6±0.69 *41.6±0.45 28.3±0.23 18.5±0.51 41.8±0.38 The mass of inedible parts:
- head - legs
- wings (until the elbow)
51.3 54.3 51.6 51.3 52.7 52.6 53.0 54.1 51.6
The chemical composition of the chicken meat was found calculating the quantity of water and dry substance in order to appreciate the meat quality.
The results of the appraisal are shown in the next table.
The appraisal of the chemical composition of the chicken meat showed that a greater quantity of water was found in the chickens in the first experimental lot – with 1.8% more (B=0.95), which is 0.73% higher in comparison with the two other lots.
Table 7
Composition of chicken meat
Lots Marking numbers of chickens
It contains, in %
water dry substance
Witness 4 7 11 73.2 69.5 71.6 26.8 30.5 28.4
On the average 71.4±1.07 28.6±0.78
I experimental 3 5 9 73.5 72.4 74.1 26.5 27.6 25.9
On the average 73.2±0.51 *26.7±0.49
II experimental 1 7 8 70.6 74.1 72.7 29.4 25.9 27.3
On the average 72.47±1.02 27.5±1.02
*B = 0.95
The assessment of the chicken meat quality was also done. The water binding capacity in the chicken meat was appraised using the pressing method (table 8). The percentage of the bound water in the test was appraised using the formulas: X1 = (M- 8.4S) x 100/m° ; X2 = (M- 8.4S) x 100/M
of water in the test, mg; S is the surface of the moist spot, mg; m is the mass of the chicken meat test, mg.
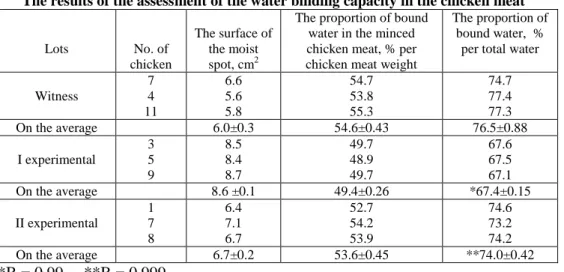
Table 8
The results of the assessment of the water binding capacity in the chicken meat
Lots No. of
chicken
The surface of the moist spot, cm2
The proportion of bound water in the minced chicken meat, % per chicken meat weight
The proportion of bound water, %
per total water
Witness 7 4 11 6.6 5.6 5.8 54.7 53.8 55.3 74.7 77.4 77.3
On the average 6.0±0.3 54.6±0.43 76.5±0.88
I experimental 3 5 9 8.5 8.4 8.7 49.7 48.9 49.7 67.6 67.5 67.1
On the average 8.6 ±0.1 49.4±0.26 *67.4±0.15
II experimental 1 7 8 6.4 7.1 6.7 52.7 54.2 53.9 74.6 73.2 74.2
On the average 6.7±0.2 53.6±0.45 **74.0±0.42
*B = 0.99 **B = 0.999
Using the results of the assessment of the water binding capacity it was found that in the first and second experimental lots the proportion of water bound on the average with 107% and 2.5% (B = 0.99) was lower that in the witness lot. To assess the capacity of water retaining a test of chicken meat well minced with the weight of 6 grams was placed on the interior large part of a butyrometer, than it was hermetically closed with a rubber tube and the narrow part of it was introduced into a water bath at a boiling temperature for 15 minutes, after which the mass of the eliminated moisture was appraised according to the butyrometer gradation.
The analysis of the data in the previous table 9 shown that on the average the capacity of water retaining in the first and second experimental lots was more reduced than in the witness lot with 109.7% (B = 0.95) and 1.9% respectively. The difference between the experimental lots according to this index was 9.8%.
Table9
The results of the appraisal of the chicken meat
Lots No. of chicken
The capacity of chicken meat to retain water, %
The capacity of chicken meat to eliminate water,
% Witness 4 7 11 53.4 51.7 51.2 21.3 25.7 26.1
On the average 52.2±0.67 24.3±1.53
I experimental 3 5 9 46.4 46.6 46.5 21.2 20.9 20.6
On the average *46.6±0.81 20.8±0.18
On the average 51.2±0.18 22.8±0.24
*B = 0.95 Conclusions
1.Elementary selenium addition to the chicken rations at a level of 0.25mg/kg of dry substance influences well their growth and development; it also prevents the illnesses caused by selenium deficiency.
2. Under the action of selenium addition the increase of live mass in the first experimental lot in comparison to the witness one rose with 36g (3.4%) and in comparison to the second lot – with 14g (1.2%); at a daily average increase in weight of 11.61g in the witness lot, 12.01g in the first experimental lot, and 11.86g in the second experimental lot.
3.The utilization of elementary selenium at a level of 0.25mg/kg of dry substance with fodder and water brings a supplementary income of 0.87 lei in the first experimental lot and of 0.48 lei in the second experimental lot per chicken.
Bibliography
1. Antipova L.V., Glotova I.A., Rogov I.I. (2001) - Metodâ isledovania miasa I miasnâh productov, Moscva, Colos, 376
2. Dutterman W.C. and Brown R.D. Jr. (2004) - Selenium Mineral Commoditz Profiles, 20
3. Grobovschii A.M. (1973 ) - Puti obespecenia ptiŃâ selenom I vitaminom E”, Trudâ Vsesoiuznogo zaocinogo seliscohozeaistvennogo institute, vâp. 71, 56-57
4. Calaşnicov A.P. i dr. (1985) - Normâ I raŃionâ cormlenia seliscohozeaistvennâh jivotnâh, Moscva., Agropromizdat, 352
5. Casumov S.N. (1981) - Osnovâ primenenia selena v cormlenii seliscohoyeaistvennîh jivotnîh i ptiŃî
6. OdâneŃ R.N., Tomskih Iu.I. (1976) - Soderjanie selena v necotorâh organah Ńâpleat i cur i scorosti ego vâvedenia iz organisma, Frunze, 236
7. Sidiovschi V.G..( 1973) - Vlianie selena na iaiŃenoscosti, vîlupleaemosti Ńâpleat i sohrannosti
8. Şcarin N. (2004) - Controli defiŃita selena i vitamina E v organizme priŃî”, PtiŃevodstvo № 1, 24
9. Stutman N. (1973) - O metaboliceskih cviazeah vitamina e I selena. Materialu po boihimii vitamina E I selena I ih primeneniu v meditsine I jivotnovodstve. Kiev, 82
10. Validman A.R. (1979) - Stimulriruişee deistvie solenovogo premixa na biologhiceschie pocazateli I productivnosti cur
11. Voshida M. c. a. (1977)- Selenium content in single cell proteins and selenium deficiency in cicks feil them as a sole protein sourse, Poultry Sci, V14(6), 284-289
12. Petruhin I.V. (2003) - Primenenie selenita natria i selenometionina na ptisefabrike OGUP «Sredneyraliskaia». Ptisevodstvo, № 3, 6
13. Tsals I.I.,Pelekis E.E. (1973) - Opredelenie selena v organah I tkaniah kur, Veterinaria, №8, 108