VOLUME 16 ISSUE 3 (2018) Page 1 - 12
HEALTHY LIFESTYLE OF URBAN RESIDENTS. CASE STUDY: SRI PAHANG PUBLIC HOUSING, BANGSAR,
KUALA LUMPUR, MALAYSIA
Oliver Ling Hoon Leh1, Nur Hidayah Shaharom2, Marlyana Azyyati Marzukhi3, & Sharifah Zannierah Syed Marzuki4
1,2,3Faculty of Architecture, Planning and Surveying,
UNIVERSITI TEKNOLOGI MARA, MALAYSIA
4Faculty of Business and Management,
UNIVERSITI TEKNOLOGI MARA, MALAYSIA
Abstract
The natural ecosystems are increasingly being replaced by urban built-up area due to fast urbanisation. The urban development pressure brought urban areas to the uncontrolled built environment which, in turn, significantly compromises the quality of public spaces and facilities. Furthermore, the urban environment discourages active living. Thus, research on the relationship between urbanisation and physical health is rapidly coming to the force. Urbanisation can have detrimental effects, particularly on physical health, which further attributed to unsustainable urban development. A study was carried out at Sri Pahang Public Housing (Flat), Kuala Lumpur with the aim to investigate the healthy lifestyle among residents and the relationship with the public facilities available at study area for the physical activity. Data was obtained through questionnaire survey. The relationship between healthy lifestyle particularly the level of physical activity and the facilities in the study area was analysed using correlation test. It was found that most of the respondents were physically inactive and their healthy lifestyle can be related to the planning aspects of facilities in the study area.
INTRODUCTION
Environmental risk factors played a crucial role in contributing more than 80% of the diseases globally (WHO, 2007), especially in urban areas. This is due to the urban settlements are more polluted with lower environmental quality and health condition as compared to rural settlements (Mohamed Musthafa, Ling, Omar, & Subramaniam, 2015; Ling, Mohamed Musthafa, & Mohamed, 2014). Due to the issue of environmental quality, communicable diseases such as Tuberculosis (TB) has become one of environmental health concerns in Malaysia. The notification rate of TB has increased from 72 per 100,000 population in 2011 to 81 per 100,000 population in 2014 (Abdul Rasam, Shariff, & Dony, 2016). Recently, non-communicable diseases (NCD) has also become the latest health concern in Malaysian urban areas. NCD was always associated with unhealthy lifestyle especially physical inactivity (Ling, Mohamed Musthafa, & Omar 2015; Mohamed Musthafa et al., 2015). The urban environment discourages active living due to lack of quality lighting, lack of access to open space, sports and recreational facilities, low quality of houses and neighbourhoods, and poor aesthetics (Edwards & Tsouros, 2006).
Physical inactivity, combined with poor diet, contributed to the unhealthy lifestyle of urban dwellers. Physical inactivity has been identified as the fourth leading risk factor for global mortality (6% of deaths globally) (WHO, 2010), and it increases the risk of NCDs. In Malaysia, 71% of death are NCD related, particularly cardiovascular diseases (CVD), diabetes, cancer, and chronic respiratory diseases. Malaysia has also recorded 17% of the risk of premature death from target NCDs (WHO, 2017a). Furthermore, from 1996 to 2006, Malaysia saw a dramatic increase in the prevalence of behaviour-linked diseases, including a 43% increase in hypertension, 88% increase in diabetes and 250% increase in obesity. The alarming rise of NCDs in Malaysia is largely due to poor lifestyle choices which include unhealthy behaviours regarding food, physical activity, sleep and peace of mind (Anusha, 2016). Only 40% Malaysians adopted healthy lifestyle by making sports as a culture (Bernama, 2016). These factors affected the NCD and affected by lifestyle choices that are often influenced by economic development and urban living (WHO, 2017b).
Urban area, particularly the study area (Sri Pahang Public Housing) was developed with limited public facilities that encourage active lifestyle (physical exercise) among residents. This might affect the healthy lifestyle of residents. Thus, a study was carried out with the aim to investigate the healthy lifestyle among residents and the relationship with the public facilities available at study area for the conduct of physical activity.
LITERATURE REVIEW
pressured to provide more houses, more retail and other facilities, more roads to accommodate the increasing traffic volume, and more waste disposal or treatment facilities for the increasing waste volume. All of these demands pressure urban areas to increase their densities as well as their size and reduce the green fields. The natural ecosystems are increasingly being replaced by built-up area due to fast urbanisation (Li, Wang, Paulussen, & Liu, 2005). Rapid urbanisation may also compromises the quality of public spaces. As urban density increases, the mean wind speed exponentially decreases (Zainol, Abdul Razak, Ali, Qi, & Zaki, 2017). It will also affect the thermal comfort among pedestrians, resulting in less people walking as pedestrian., and hence, increasing the level of physical activity. Thus, urbanisation can have detrimental effects, particularly on physical health, which further attributed to unsustainable urban development (Fisher, Andersen, Loft, & Pedersen, 2017).
Globally, research have been carried out in relation to urban land use and activities, healthy lifestyle (especially physical activity), and health/well-being (Richardson, Pearce, Mitchell, & Kingham, 2013; Soga, et al., 2017; Lau, Goodloe, Eatman-Williams, Dudovitz, & Wentz, 2018; Sarkar & Webster, 2017). In New Zealand, for instance, it was found that neighbourhood design and land use pattern affect health where residents of the greenest urban neighbourhoods had significantly lower risks of having poor mental health than those in the least green areas, suggesting a dose-response relationship (Richardson et al., 2013). In fact, individuals residing in neighbourhoods with more than 15% green space coverage had similarly reduced CVD risks. Meanwhile, the least green neighbourhoods have certain other characteristics (e.g., high population density, or urban centres) that also relate to CVD risk (Richardson et al., 2013). According to Schram-Bijkerk, Otte, Dirven and Breure (2018), urban gardens provide opportunities for physical activity and allow people to consume home grown fruit and vegetables. Urban gardens may also reduce stress levels of gardeners and improve social cohesion. In this way, they can help to prevent health problems. Also, research in Japan revealed that allotment gardeners, as compared to non-gardeners, reported better perceived general health, subjective health complaints, mental health and social cohesion (Soga et al., 2017).
RESEARCH METHOD
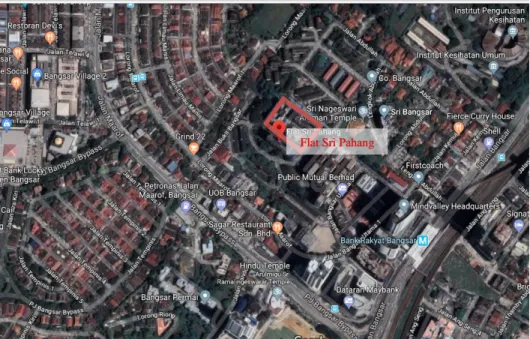
Study Area
Figure 1: Location of study area (Flat Sri Pahang)
Questionnaire Survey and Sampling of Respondents
The level of physical activity and evaluation of facilities for physical activity were identified through a questionnaire survey. A total of 263 respondents (at 95% confidence level) were selected from the total population of 3,840 in the study area by using systematic, simple random sampling method. The samples covered both male and female respondents, different ethnic groups, and different age groups. The samples were equally distributed among the three blocks of building in the study area (Table 1 and Table 2).
Table 1: Distribution of samples
Block Estimated Population Sample size %
1 1,280 88 33.4
2 1,280 88 33.4
3 1,280 87 33.2
Total 3,840 263 100.0
Note: 5 or 6 samples for every floor of the 3 blocks of flat
Table 2: Background of respondents
Variables Percentage (%)
Gender Male Female
53.2 46.8 Ethnicity
Malay Indian Chinese Others
80.6 14.4 4.6 0.4 Age
< 20 years old 20-29 years old 30-39 years old 40-49 years old 50-59 years old > 59 years old
22.8 22.1 18.6 14.8 12.5 9.9
Method of Analysis
Level of physical activity was measured based on frequency and duration. The level of facilities provided for conducting physical activities was evaluated based on respondents’ satisfaction in terms of quality, cleanliness, adequacy and safety. The data were analysed using Frequency, Cross-tabulation, Chi-square and Correlation tests available in the Statistical Package for Social Science (SPSS) software. The purpose of the analysis is to find out the level of physical activity among residents in the study area and the relationship with the facilities for physical activities (exercise) and demographic background of respondents.
RESULTS AND FINDINGS
Healthy Lifestyle and Level of Physical Activity
The results in Table 3 show that the majority of respondents were less active in carrying out their physical exercise with half of them did not exercise regularly. Only 7.6% of the respondents exercise more than three times a week.
exercise carried out by respondents, it showed that most of the respondents (> 50%) were engaged in the more vigorous physical activity, which were jogging and sports activities (Table 6). There were around one-quarter of respondents engaged in moderate or light physical activity, i.e. walking.
Table 3: Frequency of exercise
Per week Number of respondents Percentage (%)
Not regular 135 51.3
1 44 16.7
2 36 13.7
3 28 10.6
> 3 20 7.6
Total 263 100.00
Table 4: Duration of exercise
Venue Frequency %
< 0.5 hr 99 37.6
0.5 – 1 hr 102 38.8
1 – 2 hr 48 18.3
>2 hr 14 5.3
Total 263 100.0
Table 5: Frequency of exercise and types of most frequent free time activity
Frequency per week
Most frequent activity during free time (% of respondents)
Food stalls / restaurant
Watching TV / using
internet
Exercise Others Total
Not regular 17.7 58.6 1.5 22.2 100.0
1 13.8 59.0 15.9 11.3 100.0
2 8.4 61.1 25.0 5.5 100.0
3 7.2 50.0 32.1 10.7 100.0
> 3 0.0 48.0 52.0 0.0 100.0
Table 6: Type of exercise
Type Number of respondents Percentage (%)
Walking 71 27.0
Cycling 15 5.7
Jogging 68 25.9
Sports 74 28.1
Others 35 13.3
Total 263 100.0
respondents were not regularly carrying their exercises. Those who were categorised as normal weight, having the smallest percentage for “no regular exercise”. This indicates that physically inactive can be associated with overweight and obese.
Table 7: Frequency of exercise and body mass index (BMI)
Frequency per week
Body Mass Index (% of respondents) Underweight
(<18.5)
Normal weight (18.5 – 24.9)
Overweight
(25.0-29.9) Obese (>30)
Not regular 48.4 39.0 59.0 67.3
1 21.2 18.0 17.8 9.6
2 27.2 17.1 10.9 1.9
3 0.0 14.5 8.2 13.4
> 3 3.0 11.4 4.1 7.6
Total 100.0 100.0 100.0 100.0
Another aspect of healthy lifestyle is the cigarette smoking habit of respondents. Only 45.2% of respondents could be categorised as the non-smokers, while 27% were active smoker, 25% passive smoker and 3% ex-smoker (Table 8).
Table 10: Adequacy of facilities for physical activity by type of exercise
Adequacy Type of exercise by respondents (%)
Walking Jogging Cycling Sports Others Seriously not adequate 38.0 50.3 46.6 33.7 37.1
Not adequate 45.0 30.8 13.3 27.0 37.1
Neutral 5.6 11.7 13.3 13.7 14.4
Adequate 11.2 5.8 26.6 21.6 11.4
More than adequate 0.0 1.4 0.0 4.0 0.0
Total 100.0 100.0 100.0 100.0 100.0
Table 8: Cigarette smoking experience
Number of respondents Percentage (%)
Active smoker 70 26.6
Passive smoker 66 25.1
Ex-smoker 8 3.0
Non smoker 119 45.2
Table 9: Venue of exercise
Venue Frequency %
Internal spaces 64 24.3
Sport centre 24 9.1
Gymnasium 19 7.2
Parks 71 27.0
Roadside 14 5.3
Others 71 27.0
Total 263 100.0
Table 10: Adequacy of facilities for physical activity by type of exercise
Adequacy Type of exercise by respondents (%)
Walking Jogging Cycling Sports Others Seriously not adequate 38.0 50.3 46.6 33.7 37.1
Not adequate 45.0 30.8 13.3 27.0 37.1
Neutral 5.6 11.7 13.3 13.7 14.4
Adequate 11.2 5.8 26.6 21.6 11.4
More than adequate 0.0 1.4 0.0 4.0 0.0
Total 100.0 100.0 100.0 100.0 100.0
Planning Aspects and Healthy Lifestyle
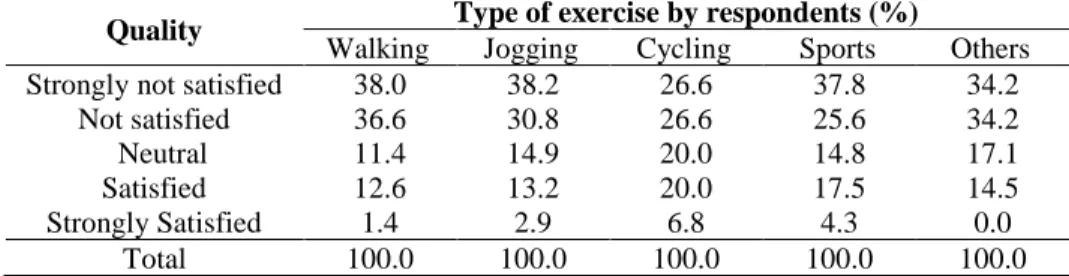
Majority of the respondents (more than 70%) carried out their exercise (physical activity) outside of the study area (Table 9). Only 24.3% of respondents carried out their exercise at venues located within the boundary of the study area (the flats), such as at the playground, badminton court and futsal court. Most of the respondents felt that facilities provided were inadequate (Table 10). Similarly, most of the respondents also were unsatisfied with the quality of facilities provided for conducting physical activity (Table 11). Thus, it can be inferred that the quality of facilities provided affects the level of physical exercise by the residents.
Table 11: Quality of facilities for physical activity located in the study area, by type of exercise
Quality Type of exercise by respondents (%)
Walking Jogging Cycling Sports Others Strongly not satisfied 38.0 38.2 26.6 37.8 34.2
Not satisfied 36.6 30.8 26.6 25.6 34.2
Neutral 11.4 14.9 20.0 14.8 17.1
Satisfied 12.6 13.2 20.0 17.5 14.5
Strongly Satisfied 1.4 2.9 6.8 4.3 0.0
Total 100.0 100.0 100.0 100.0 100.0
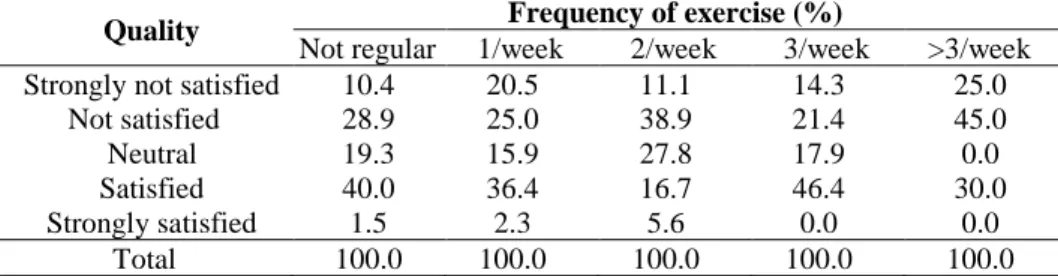
provided in the study area. Similarly, majority of them were also unsatisfied with the safety of the facilities (Table 13).
Table 12: Quality of facilities for physical activity located in the study area, by frequency of exercise
Quality Frequency of exercise (%)
Not regular 1/week 2/week 3/week >3/week Strongly not
satisfied 36.4 38.8 27.7 39.4 50.0
Not satisfied 35.5 31.8 25.0 25.0 20.0
Neutral 13.3 13.6 22.2 17.8 5.0
Satisfied 14.8 6.8 19.4 17.8 20.0
Strongly
satisfied 0.0 9.0 5.7 0.0 5.0
Total 100.0 100.0 100.0 100.0 100.0
Table 13: Safety of facilities for physical activity within the boundary, by frequency of exercise
Quality Frequency of exercise (%)
Not regular 1/week 2/week 3/week >3/week Strongly not satisfied 10.4 20.5 11.1 14.3 25.0
Not satisfied 28.9 25.0 38.9 21.4 45.0
Neutral 19.3 15.9 27.8 17.9 0.0
Satisfied 40.0 36.4 16.7 46.4 30.0
Strongly satisfied 1.5 2.3 5.6 0.0 0.0
Total 100.0 100.0 100.0 100.0 100.0
Correlation test (Table 14) on the relationship between planning aspects (facility provision) and physical activity among respondents showed weak and insignificant relationship even at the 0.05 level for the all the aspects. The relationship between safety aspect and cleanliness with the level of physical activity was negative. It means, there was a higher percentage of respondents who were more active felt public facilities in the study area were unsafe and with poor cleanliness.
Table 14: Correlation between duration & frequency of exercise with the satisfactionof the facilities for physical activity
Duration Frequency
Quality r
sig. value
-0.024 0.698
0.039 0.530
Cleanliness r
sig. value
-0.73 0.241
-0.040 0.522
Adequacy r
sig. value
-0.056 0.361
Safety r sig. value
-0.110 0.075
-0.104 0.093
Demographic Background and Healthy Lifestyle
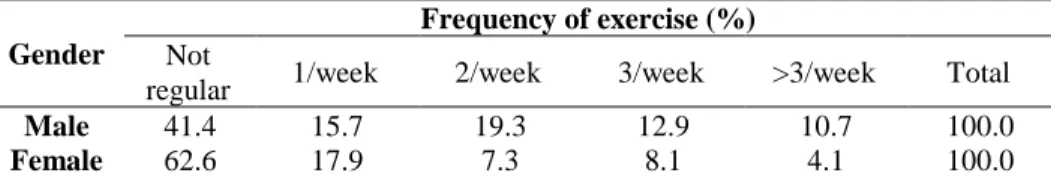
The level of physical activity conducted by respondents, as measured in frequency of exercise, was found to be significantly associated with gender at 0.01 level (Table 15). The analysis showed that female was less active (less frequent of exercise) as compared to male. Similarly, the correlation test also indicates a significant relationship between age and frequency of exercise at 0.01 level (Table 16). The relationship was negative and weakly correlated with the r value of -0.328. This means that that as one is getting older, one will conduct less physical exercise.
Table 15: Frequency of exercise by gender
Gender
Frequency of exercise (%) Not
regular 1/week 2/week 3/week >3/week Total
Male 41.4 15.7 19.3 12.9 10.7 100.0
Female 62.6 17.9 7.3 8.1 4.1 100.0
Note: Pearson Chi-square value = 17.936 ; sig. value = 0.001 (sig. at 0.01 level)
Table 16: Frequency of exercise by age group
Age Frequency of exercise by respondents (no. of respondents) Not regular 1/week 2/week 3/week >3/week Total
13-19 years old 14 17 15 9 5 60
20-29 years old 24 7 10 7 8 56
30-39 years old 28 11 4 3 3 49
40-49 years old 25 6 3 4 1 39
50-59 years old 25 2 2 4 0 33
> 59 years old 19 1 2 1 3 26
Total 135 44 36 28 20 263
Note: Spearman correlation r value = -0.328 ; sig. value = 0.000 (sig. at 0.01 level)
CONCLUSION
facilities. This could be one of the reasons why majority of them conduct their physical exercises at venues outside of the study area.
Further study should be carried out to extend the investigation of urbanisation, planning and design aspects in relation to the healthy lifestyle, especially the physical activities of urban dwellers.
ACKNOWLEDGEMENT
The authors would like to thank Universiti Teknologi MARA (UiTM) for the support and Ministry of Higher Education Malaysia for partly funding the study through the FRGS grant (FRGS/1/2014/SS06/UITM/02/3). The authors would also like to thank all the departments, organisations, and individuals who had contributed to this study.
REFERENCES
Abdul Rasam, A. R., Shariff, N. M., & Dony, J. F. (2016). Identifying high-risk population of tuberculosis using environmental factors and GIS based multi-criteria decision making method. The International Archives of the Photogrammetry, Remote Sensing and Spatial Information Sciences, XLII-4/W1, 9-13.
Anusha, T. (2016, June 12). Helping Malaysians be healthier. The Star. Retrieved from https://www.thestar.com.my/news/nation/2016/06/12/helping-malaysians-be- healthier-both-carrots-and-sticks-are-needed-to-empower-and-incentivise-malays/
Bernama (2016, August 29). Only 40% of Malaysians practise a healthy lifestyle: Khairy.
The Sun Daily. Retrieved from http://www.thesundaily.my/news/1953395 Edwards, P., & Tsouros, A. D. (2006). Promoting physical activity and active living in
urban environments: The role of local governments. Copenhagen: WHO
Regional Office for Europe.
Fisher, J. E., Andersen, Z. J., Loft, S., & Pedersen, M. (2017). Opportunities and challenges within urban health and sustainable development. Current Opinion in Environmental Sustainability, 25, 77-83.
Lau, C., Goodloe, J., Eatman-Williams, J., Dudovitz, R., & Wentz, S. (2018). Dancetricians: A street dance intervention to improve physical activity self-efficacy and motivation among urban minority school children. Pediatrics, 141(1).
Li, F., Wang, R., Paulussen, J. & Liu, X. (2005). Comprehensive concept planning of urban greening based on ecological principles: a case study in Beijing, China.
Landscape and Urban Planning,72(4), 325-336.
Ling, O. H. L., Mohamed Musthafa, S. N. A., & Mohamed, N. (2014). Air quality and land use in urban region of Petaling Jaya, Shah Alam and Klang, Malaysia.
EnvironmentAsia, 7(1), 134-144.
Mohamed Musthafa, S. N. A., Ling, O. H. L., Omar, D., & Subramaniam, K. (2015). Theoretical review on environmental health in relation to neighbourhood planning and human physical activity. Procedia - Social and Behavioural Sciences, 201, 325-332.
Richardson, E. A., Pearce, J., Mitchell, R., & Kingham, S. (2013). Role of physical activity in the relationship between urban green space and health. Public Health, 127(4), 318-324.
Sarkar, C., & Webster, C. (2017). Healthy cities of tomorrow: The case for large scale built environment – health studies. Journal of Urban Health,94(1), 4-19. Schram-Bijkerk, D., Otte, P., Dirven, L., & Breure, A. M. (2018). Indicators to support
healthy urban gardening in urban management. Science of the Total Environment,621, 863-871.
Soga, M., Cox, D. T. C., Yamaura, Y., Gaston, K. J., Kurisu, K., & Hanaki, K. (2017). Health benefits of urban allotment gardening: improved physical and psychological well-being and social integration. International Journal of Environmental Research and Public Health,14(1), 71.
World Health Organization [WHO] (2007). Preventing disease through healthy environments: Towards an estimate of the environmental burden of disease. Available at http://www.who.int.
World Health Organization [WHO] (2010). Global recommendations on physical activity for health. Geneva: Author.
World Health Organization [WHO] (2017a). Noncommunicable Diseases Progress Monitor 2017. Geneva: Author.
World Health Organization [WHO] (2017b). Non-communicable diseases fact sheet. Retrieved from http://www.who.int/mediacentre/factsheets/fs355/en/