PLANNING MALAYSIA
Journal of the lvfalaysian Institute of Planners (2008) VI, 99- 128
ENERGY CONSUMPTION AND CARBON DIOXIDE
EMISSION CONSIDERATIONS IN THE URBAN
PLANNING PROCESS
Abstract
IN MALAYSIA
Wee-Kean Fong'
CTI ENGINEERING INTERNATIONAL CO., LTD., JAPAN Hiroshi Matsumoto
TOYOHASHI UNIVERSITY OF TECHNOLOGY, JAPAN Chin-Siong Ho2
UNJVERSITI TEKNOLOGI MALAYSIA, MALAYSIA Yu-Fat Lun
TOHOKU UNIVERSITY, JAPAN
In handling global wanning issues, among the most ilnportant measures are to reduce energy constunptions and carbon dioxide emissions. While many countries have recognized the importance of the role of urban planning in energy conservation and reduction of carbon dioxide etnissions, spatial planning fra1ne\vork in Malaysia is still lacking in this aspect. Although there are some spatial planning policies indirectly favoring energy conservation, there is still no measure that directly emphasizes on promoting energy conservation and capping carbon dioxide emissions. Energy and carbon dioxide issues should thus be taken as one of the core parts in the urban planning process. It is necessary to develop and incorporate a decision 1naking tool to assess the overall impact of development plans on energy consumptions and carbon dioxide emissions. While achieving the desired economic and social developments, it is necessary to create a lo\v energy-consuming, carbon dioxide-emitting sustainable society.
Key,vords: Global \varming, Energy consumption, Carbon dioxide emission, Urban planning
1
He can be contacted at [email protected] or f\[email protected] Jp.
2
He can be contacted at [email protected].
Wee Kean Fong, Hiroshi Afa1s111110/o, Chi11 Siong Ho, and Yu Fat Lim
Energy Co11s11111plio11 and Carbon Dioxide Emission Co11sideratio11s i11 the Urban Pla1111i11g Process in Afalaysia
INTRODUCTION
The world is facing the challenges of global warming and climate change issues. The anthropogenic driver of climate change is the increasing concentration of greenhouse gases (GHG) in the atmosphere. Carbon dioxide (C02) is the most important anthropogenic greenhouse gas, and the global increase in carbon dioxide concentration is due primarily to fossil fuel use and land use change (IPCC, 2007).
The most significant increase of energy consumptions and C02 emissions is
taking place in cities, where rapidly expanding populations enjoy higher living standards and material affluence (Fong et al., 2007a & 2007b; IGES, 2004). Thus, dealing with the issues of energy consumptions and C02 emissions, it is necessary to focus on the urban sector, and urban planning plays an important role in combating global warming, or at a small scale, mitigating the urban heat island (UHi) phenomenon.
One of the key principles in urban planning is to achieve 'sustainable development'. The most well-known definition of sustainable development that is accepted by the United Nations is 'development that meets the needs of the present without compromising the ability of future generations to meet their own needs'. In achieving sustainable development, there are many aspects that should be taken into consideration. The Division for Sustainable Development under the UN Department of Economic and Social Affairs has listed down the fields within the scope of sustainable development, and 'climate change' and 'energy' are among the main focuses (UN, 2007). Hence, it is necessary to take the climate change and energy issues as one of the main considerations in the urban planning process. However, studies show that population and economic growth are the major driving forces behind increasing energy consumption and C02 emissions (Fong et al., 2007a; IGES, 2004). So, it would be a big challenge to maintain the high quality of life in the cities while ensuring low energy consumptions and C02 emissions.
In recent years, due to the increasing concerns on global warming issues that are closely associated with C02 emissions, the concept of 'low carbon city' is currently gaining popularity among the urban planners and city governments. Planning of low carbon cities involves creation of a low carbon society (LCS) by promoting low carbon emissions. The increases of C02 concentration are due primarily to fossil fuel use and land use change. Hence, urban planning, through land use planning and planning control can play a vital role in implementing the idea of low carbon city, particularly during the formulation of development plans (Ho and Fong, 2007).
PLANNING A-!ALAYSIA Jou ma{ ofrhe Afa/aysim1 l11sti111re of Planners (2008) Article Refereed Ref MIP-PMJ 06(08
This paper attempts to highlight the importance of energy conservation and reduction of C02 emissions, and to examine the spatial planning process in
Malaysia from the perspective of energy consumptions and C02 emissions. It provides a guide for further consideration in incorporating energy and C02 issues as the core part of urban planning process, in achieving sustainable development based on the concept of low carbon city.
GLOBAL WARMING, CARBON DIOXIDE EMISSIONS AND ENERGY CONSUMPTIONS
Global Warming and Climate Change
The issues of global warming and climate change have become a subject of intense interest all over the world since the last decade. Warming of the climate system is now evidenced from observations of increases in global average air and ocean temperatures, widespread melting of snow and ice, and rising global average sea level.
In the Climate Change 2007 report (IPCC, 2007), the Intergovernmental Panel on Climate Change (IPCC) reported that eleven of the last twelve years (1995-2006) rank among the 12 warmest years in the instrumental record of global surface temperature since 1850, and the total temperature increase from
1850-1899 to 2001-2005 is about 0.76°C. It is predicted a rise in the average global surface temperature of about 2°C between 1990 and 2100 (IPCC, 2004).
The same report also revealed that, as a result of global warming, mountain glaciers and snow cover have declined and contributed to sea level rise. Global average sea level rose at an average rate of 1.8 mm per year over the period of 1961 to 2003. The rate was faster over 1993 to 2003, which was about 3.1 mm per year.
Also, at continental, regional, and ocean basin scales, numerous long-term changes in climate have been observed. These include changes in Arctic temperatures and ice, widespread changes in precipitation amounts, ocean salinity, wind patterns and aspects of extreme weather including droughts, heavy precipitation, heat waves and the intensity of tropical cyclones. Average Arctic temperatures increased at almost twice of the global average rate in the past I 00 years. Satellite data since 1978 showed that annual average Arctic sea ice extent has shrunk by 2. 7% per decade, with larger decreases in summer i.e. 7.4% per decade.
1Vee Kean Fong, Hiroshi Afats11111olo, Chi11 Siong Ho, and Yu Fat Lim
Energy Co11s11mptio11 and Carbon Dioxide Emission Co11sideratio11s i11 the Urban P/011ning Process in Malaysia
In term of precipitation, long-term observation from l 900 to 2005 showed significant increase in precipitation in eastern parts of North and South America, northern Europe and northern and central Asia, while drying has been observed in the Sahe!, the Mediterranean, southern Africa and parts of southern Asia. More intense and longer droughts have been observed over wider areas since the 1970s, particularly in the tropics and subtropics. Increased drying linked with higher temperatures and decreased precipitation has contributed to changes in drought.
It was also reported that increase of intense tropical cyclone activity in the North Atlantic since 1970 is correlated with increasing tropical sea surface temperatures.
Global Warming and Carbon Dioxide Emissions
Human activities influence the environment. Human activities, in particular
those involving the combustion of fossil fuels and biomass burning, produce
GHG that affects the composition of the atmosphere and lead to the depletion of the stratospheric ozone layer. Land use change due to urbanization and forestry and agricultural activities is also affecting the physical and biological properties of the earth surface and subsequently affecting the regional and global climate (IPCC, 200 I).
The increase in GHG concentrations in the atmosphere affects processes and feedbacks in the climate system. Qualitatively, an increase of atmospheric GHG
concentrations will lead to an average increase of the temperature of the surface-troposphere system. In this respect, C02 is the most important anthropogenic GHG. Increased C02 emissions from fossil fuel use is certain to be the dominant influence on the trends in atmospheric C02 concentration that eventually resulted in rising global temperatures and sea level (IPCC, 2005). C02 is the GHG that has the largest contribution from human activities (IPCC,
2005). The global atmospheric concentration of C02 has increased from a
pre-industrial value of about 280 ppm to 379 ppm in 2005. The atmospheric concentration of C02 in 2005 exceeds by far the natural range over the last 650,000 years (180 to 300 ppm) as determined from ice cores. The annual C02 concentration growth rate was larger during the last 10 years (1995-2005 average: 1.9 ppm per year), than it has been since the beginning of continuous direct atmospheric measurements (1960-2005 average: l.4 ppm per year) although there is year-to-year variability in growth rates. (IPCC, 2007)
PLANNING i1/ALAYSIA Journal of the ,\loloysfrm /11.stitwe of Plamiers (2008)
Article Refereed Ref' MIP·PMJ 06108
Carbo11 Dioxide Emissio11s and Energy Use
C02 is the most abundant anthropogenic (human-caused) GHG in the atmosphere. Emissions of CO, arise from a number of sources, mainly fossil fuel combustion in the power generation, industrial, residential and transportation sectors. It is released into the atmosphere by the combustion of fossil fuels such as coal, oil or natural gas, and renewable fuels like biomass (IPCC, 2005).
According to the International Energy Outlook 2006 ( cf. Figure 1 ), world C02 emissions from the consumption of fossil fuels is expected to grow at an average rate of2. l % per year from 2003 to 2030. The world C02 emission from the consumption of fossil fuels is predicted to increase from about 25,000 billion metric tons in 2003, to more than 40,000 billion metric tons by 2030.
C'J 0 0
"'
c:
0
....,
0
·;:: ....,
"
E c:
~
Cii
50
45 0 Non-OECD - __________ , ..
lllOECD
40
35
30
25
20
15
10
5
0
2003 2004 2010 2015 2020 2025 2030
Figure 1: World energy-related C02 emissions by region, 1990-2030 (EIA, 2007)
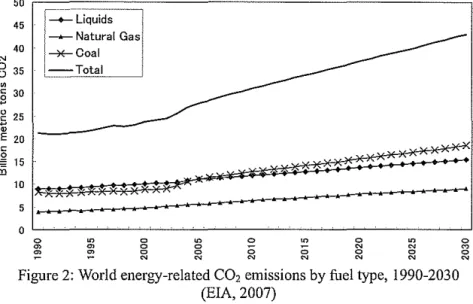
The relative contributions of different fossil fuels to total energy-related C02 emissions have changed over time as shown in Figure 2. Increasing trend of C02 emissions is observed for all fuel types and they are projected to further increase steadily over the projection period up to 2030. However, emissions from petroleum and other liquids that made up the largest proportion (42%) of world total emissions in 1990, was overtaken by coal since 2005. By 2030, it is projected that coal and liquids (petroleum and other liquids) will each be
Wee Kean Fong, Hiroshi ;\fa/s111110/o, Chill Siong Ho, and Y11 Fat Lim
Energy Co11s11111ptio11 and Carbon Dioxide Emission Considerations in the Urban Planning Process i11 Malaysia
contributing 43% and 36% of the world total emissions. The increasing share of coal is reflective of its important role in the energy mix of non-OECD countries, especially China and India (EIA, 2007). In 1990, emissions from China and India combined constituted 13% of world emissions, but by 2004, that share rose to 22%, largely because of a strong increase in coal use in these two countries. This trend is projected to continue, and by 2030 C02 emissions from
China and India combined are projected to account for 31 % of total world emissions, with China alone responsible for 26% of the world total.
45
~
·---····--,--+--Liquids
I
- Natural Gas ---*""-Coal
L=Total
I
40
5
0
0 ITT 0 ITT 0 ITT 0 ITT
m m 0 0
0 0 N N
:" :" 0 0 0 0
N N N N N N
Figure 2: World energy-related CO, emissions by fuel type, 1990-2030 (EIA, 2007)
0
M
0
N
GLOBAL AND MALAYSIAN CARBON DIOXIDE EMSSION AND ENERGY CONSUMPTION TRENDS
Carbon Dioxide E111issio11s
Figure 1 above reveals that world C02 emissions is at an increasing trend. Every country contributes different amounts of C02 into the atmosphere. From the figure, it can be seen that the growth rate of C02 emissions from non-OECD countries is higher than the OECD countries. 2004 marked the first time in history that energy-related C02 emissions from the non-OECD countries exceeded those from the OECD countries. Fmihermore, because the projected average annual increase in emissions from 2004 to 2030 in the non-OECD countries (2.6%) is more than three times the increase projected for the OECD countries (0.8%), C02 emissions from the non-OECD countries in 2030, at 26.2
PLANNING ,JfALAYSIA Journal of the Maloysia11 lnsti1111e of Planners (2008) Article Refereed Ref: MlP-PMJ 06/08
billion metric tons, are projected to exceed those from the OECD countries by 57%.
Table 1 shows the regional shares of C02 emissions against the world total
emissions. In line with Figure l, the share of OECD countries dropped from 65.9% in 1973 to 47.6% in 2005. Increases of share are seen in most of the other regions, including Asia, Latin America, Africa and Middle East. Among these regions, Asia has the most significant increase. Including China, the share ofC02 emissions from Asia escalated from 8.7% in 1973 to 28.3% in 2005. The rapid increase of C02 emissions from these non-OECD developing countries are mainly due to the development and industrialization over the last decades. Comparing this with the data shown in Figure 2, it can be seen that the rapid increase of C02 emissions from non-OECD developing countries is very closely related to the increased usage of coal as an energy source. Coal is not only the most carbon-intensive fossil fuels, but is also the fastest growing energy source. The increasing share of coal is reflective of its important role in the energy mix of non-OECD countries, especially China and India. In 1990, China and India combined for 13% of world emissions, but by 2004 that share had risen to 22%, which is largely because of a strong increase in coal use in these two countries (EIA, 2007).
0 '
Table l · Re0ional shares of C0
2 emission 1973 and 2005
Region/Country . S~
against
world total CO{emissions .· ··"'" ···) .'.)· <.'. :.. > 2005 ·. ·.· .. . .
. . ·
...
OECD 65.9% 47.6%
Non-OECD Europe 1.7% 1.0%
Former USSR 14.4% 8.5%
Asia (excluding China) 3.0% 9.5%
Latin America 2.7% 3.5%
Africa 1.9% 3.1%
Middle East 1.0% 4.6%
China 5.7% 18.8%
Bunkers 3.7% 3.4%
World total, rnil. 1netric tons 15,661 27,136
Notes:
1. rvorld includes international aviation and international n1arine bunkers, which are shown together as Bunkers.
2. C02 e111issions are fivrnfi1el cornbustion only.
Source: !EA, 2007.
Table 1 reveals that increase of C02 emissions in Asia is very significant over
the past decades due to rapid economic growth and industrialization. Malaysia,
Wee Kean Fang, Hiroshi Matsumoto, C/zi11 Siong Ho, and Yu Fat Lim
Energy Ca11s11111ptio11 and Carbon Dioxide Emission Ca11sideratia11s in the Urban Pla1111ing Process in flfalaysia
as part of Asia, is also experiencing rapid economic and population growth, and is expected to achieve the status of a developed nation by 2020 as envisaged under the Vision 2020 (EPU, 2001). The gross domestic product (GDP) growth of Malaysia was 7.0% during the last decade of the past century (1990-2000), and despite the Asian economic downturn in the late 1990's, the GDP growth rate was still maintained at 4.5% over the period of 2001-2005 (EPU, 2001 &
2006). In terms of population, Malaysian population has grown from 10.3 millions in 1970 to 27.6 millions in 2007, more than 260% growth over the 37-year period.
T a e bi 2 CO 2 emissions o f t h ewor Id an t d h e se ecte d re ~ions & countries, 2005 R.~~ollfci>urittj:· .. :>,··~,;:· '· ~Opu,lation;·:· GDp, ,'·•·· co, CQ,lc~pita c,o,IGDP,
.
..
.
...
millio.~ .. >·.:,-::;;~iHi?n
·.··•·•e:missions5·:,· metric ton kg9(J,I
. . . .... >
•>
<
i .··
20QO~·.·
.•.. ·.•···••...
ffilni·onmemc tons
2QOO$.
World 6,432 36,281 27,136 4.22 0.75
World re.clans:
OECD 1,172 28,394 12,910 11.02 0.45
Non-OECD Europe 54 152 263 4.87 1.73
Former USSR 285 525 2,303 8.08 4.39
Asia (excl. China) 2,080 1,974 2,591 1.25 1.31
Latin America 449 1,620 938 2.09 0.58
Africa 894 731 835 0.93 1.14
Middle East 187 786 1,238 6.62 1.58
China 1,311 2,098 5,101 3.89 2.43
GS countries: . .
Canada 32.27 822.39 548.59 17.00 0.67
France 62.70 1,430.13 388.38 6.19 0.27
Germany 82.46 1,961.79 813.48 9.87 0.41
I ta Iv 58.53 1,132.83 454.00 7.76 0.40
Jaoan 127.76 4,994.13 1,214.19 9.50 0.24
Russia 143.11 349.85 1,543.76 10.79 4.41
United Kingdom 60.22 1,626.78 529.89 8.80 0.33 United States 296.68 10,995.80 5,816.96 19.61 0.53
South east Asia: . .
Brunei 0.37 4.85 5.09 13.76 1.05
Cambodia 13.64 5.66 3.71 0.27 0.66
Indonesia 220.56 207.74 340.98 1.55 1.64
Malaysia 25.35 112.46 138.04 5.45 1.23
Myanmar 50.52 15.20 11.02 0.22 0.73
Philinnines 83.05 93.73 76.42 0.92 0.82
Singapore 4.34 112.22 43.10 9.93 0.38
Thailand 64.23 157.07 214.29 3.34 1.36
Vietnam 83.12 44.75 80.36 0.97 1.80
Source: IEA, 2007
PLANNING il!ALAYSIA
Journal of the Afalaysian 111stit11te of Planners (2008) Article Refereed Ref: MIP-PMJ 06/08
Table 2 presents the population, GDP and C02 emissions of Malaysia in comparison with the world, selected regions, and countries. Due to rapid economic growth and industrialization, C02 emission of Malaysia is relatively high compared to the world average and other Southeast Asian countries. In terms of per capita emission, Malaysia marks 5.45 metric tons, much higher than the world and Asian (excluding China) average figures of 4.22 metric tons and 1.25 metric tons respectively. Although this value is lower than developed countries, it ranks third in Southeast Asia, after Brunei and Singapore.
In terms of total C02 emission, the figure for Malaysia is also quite high compared to the other developing Southeast Asian countries, which is the third highest after Indonesia and Thailand. Although the total emission for Malaysia is only about 40% oflndonesia and 64% of Thailand, the per capita emission of Malaysia is about 3.5 and 1.6 times of the values of Indonesia and Thailand respectively.
For the intensity of C02 emission (C02/GDP), although the figure for Malaysia (1.23 kgC0,12000$) is quite high compared to the world average (0.75 kgC02/2000$) and most of the developed countries (0.24-0.67 kgC0,/2000$), it
is similar to the Asian average (excluding China) and much lower than Vietnam, Indonesia and Thailand in Southeast Asia. In this respect, it can be seen that emission intensities of the developing countries are generally higher than the developed countries. Besides the factor of energy efficiency, as mentioned above, it could also be attributed to the more intensive usage of coal as an energy source.
One important issue regarding the database for C02 emissions in Malaysia is the
inconsistency of data. For example, as shown in the above Table 2, the International Energy Agency reported that C02 emissions in Malaysia in 2005 was 5.45 metric tons per capita, whereas the United Nations revealed a value of 6.2 metric tons per capita for year 2002, and on the other hand, the World Resources Institute published a value of 5.4 metric tons per capita for year 2000 (!EA, 2007; UNEP, 2007; WR!, 2007). The questions are not only the consistency of the volume of emissions but also the base year of this data.
For the database on C02 emissions in Malaysia, the most reliable data is deemed to be the inventory developed by the Malaysia National Steering Committee on Climate Change, which was established subsequent to the signing of the Kyoto Protocol. The national GHG inventory was established during the preparation of the Initial National Communication (INC) for the UNFCCC, which was based on the 1994 database. After the Cabinet of
Wee Kean Fong, Hiroshi J.fatsumoto, Chin Sio11g Ho, and Yu Fat Lu11
Energy Co11sumptio11 and Carbon Dioxide Emission Co11sideralio11s ill the Urban Pla1111i11g Process in llfala)'Sia
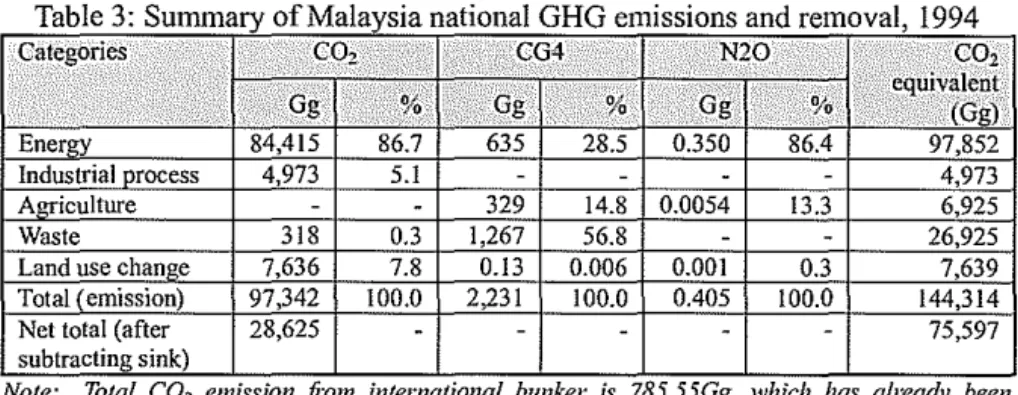
Malaysia had reviewed and approved the draft, the NC was launched on 18 July 2000 and submitted to the UNFCCC Secretariat on 22 August 2000 (MOSTE, 2000). Table 3 shows the emissions of the three main GHGs in 1994 on a sectoral basis. In order to provide an overall assessment, the various GHG emissions are also expressed as the equivalent of C02 emissions.
Table 3: Summary of Malaysia national GHG emissions and removal, 1994
Categories
.•
..
c:oz. : .;
;"'<' . ,,,, J:·CG.4••
N30 ··.· .·co2Gg
1><%
.·> ....
% Gg •·.·•.I ·> ·· eq~i~Ie.nt
.
.. · .. · i···.·· Gg ; o/oI
c . .. (Gg)Enerov 84,415 86.7 635 28.5 0.350 86.4 97,852
Industrial orocess 4,973 5.1 - -
-
- 4,973Agriculture -
-
329 14.8 0.0054 13.3 6,925Waste 318 0.3 1,267 56.8
-
-
26,925Land use chanQe 7,636 7.8 0.13 0.006 0.001 0.3 7,639
Total (emission) 97,342 100.0 2,231 100.0 0.405 100.0 144,314
Net total (after 28,625
-
--
-
- 75,597subtracting sink)
Note: Total C02 e1nission fi·o1n international bunker is 785.55Gg, which has already been
subtracted jiv111 the total C02 e1nissions in energy sec101:
Source: MOSTE, 2000
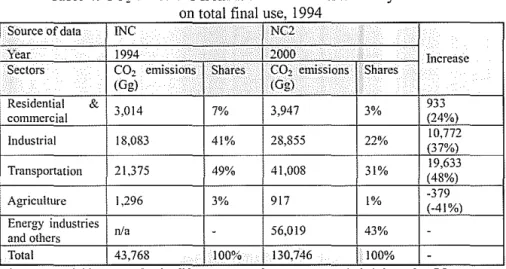
Table 4 (INC column) shows the C02 emissions from final energy use (excluding electricity) by economy sector: transportation (49%), industries (41%), residential and commercial activities (7%), and agriculture (3%). It is noted that the final C02 emission totaling 43,768 Gg from final energy use
(excluding electricity) as shown in Table 4 is very much less than the emission of 84,415 Gg estimated from primary energy supply as shown in Table 3. The latter assumed that all types of fuel are consumed for energy transformation and final use. The difference between the primary energy supply and energy demand (final use) figures could be attributed to, among others, transformation to secondary supply of energy, losses incurred during transformation and transmission, and statistical discrepancies. (MOSTE, 2000)
Subsequent to the NC that was based on the database of 1994, as an update of the first NC, the preparation of the Second NC (NC2) with the base year of 2000 was commissioned recently and scheduled to be launched in 2009. Table 4 presents the preliminary results on the C02 emissions from energy use in comparison with the INC data. The breakdown of C02 emissions by sector shows that it is dominated by transportation (31 %), energy industries (28%) (within the category of 'energy industries and others'), and manufacturing industries (22%). Comparing the data between 1994 and 2000 (excluding energy industries) revealed a significant increase of 53% in C02 emissions from
PLANNING 1l!ALAYSIA
Jo11r11al of 1he ,\falay.~ian !11s1i1111e of Pla1111er.~ (2008)
Anide Refereed Ref' MIP-PMJ 06/08
energy use. Within these six years, C02 emissions had increased from 43,768
Gg to 93,621 Gg. However, it must be noted that the sectoral energy use under the 1996 IPCC Guidelines have been refined, hence a direct comparison between these two years is rather complicated.
Table 4: C02 emissions from fuel combustion in Malaysia based
on total final use 1994 '
Source of data INC NC2
"".fear 1994 2000 Increase
Sectors C01 emissions Shares C02 emissions Shares
(Gg) (Gg)
Residential &
3,014 701o 3,947 3o/o 933
conunercial (24%)
Industrial 18,083 41% 28,855 22% 10,772
(37%)
Transportation 21,375 49% 41,008 31% 19,633
(48%)
Agriculture
I
1,296 3~~I
917 1% -379(-41%)
Energy industries
n/a
-
56,019 43%-and others
Total 43,768 lOO~rO 130,746 100%
-nla: not avcnlable. 1Vote: In the INC, energy 1ndustnes was excluded finn1 the C01 e1111ss1on calculation.
Source: INC: lv!OSTE, 2000; 1\/C2: Az111an et al., 2006
From the above, it can be seen that the national data on CO, emissions is rather complete although there are some variations between different sources of data. However, literature review revealed that there is complete absence of local level
C02 emission data in Malaysia. In view of the fact that the main source of C02
emissions is from the urban sector (to be explained in further detail in the later
sections), there is an urgent need to establish the local level (city level) C02
emission data in Malaysia, especially for the major cities such as Kuala Lumpur (or Klang Valley) and Johar Bahru (or the Iskandar Development Region).
Energy Co11s11111ptio11s
Despite high oil prices, the world economic growth is expected to continue with strong growth, driving the robust increase in world energy use. The total world consumption of marketed energy is expected to increase from about 421 quadrillion British thermal units (Btu) in 2003 to 722 quadrillion Btu in 2030
(71 % increase) (cf. Table 4).
/Vee Kean Fong, Hiroshi .Alatsumoto, Chin Siong Ho, and Yu Fat L1111
Energy Co11s11111ptio11 and Carbon Dioxide Emission Considerations in lhe Urbo11 Pla1111i11g Process in Afo/aysio
When comparing the energy consumption of developed and developing countries, from Table 4, it can be seen that the growth rate in energy consumption for the non-OECD countries, including Malaysia, accounts for three-fourths of the increase in world energy use. Non-OECD energy use is expected to surpass OECD energy use by year 2015. In 2030, total energy demand in non-OECD countries will exceed that in the OECD countries by 34%. During this projection period, the average growth rate of energy consumption in the non-OECD countries is triple of the OECD countries.
Table 4 W or Id mar ete k d energy consumot10n by country grouoing, 2003-2030
Enerrr consum1 tion, auadrillion Btu
Region 2003 2010 2015 2020 2025
OECD 234.3 256.1 269.9 281.6 294.5
North America 118.3 131.4 139.9 148.4 157.0
Europe 78.9 84.4 87.2 88.7 91.3
Asia 37.1 40.3 42.8 44.4 46.1
Non-OECD 186.4 253.6 293.5 331.5 371.0
Eurooe & Eurasia 48.5 56.5 62.8 68.7 74.0
Asia 83.l 126.2 149.4 172.8 197.l
Middle East 19.6 25.0 28.2 31.2 34.3
Africa 13.3 17.7 20.5 22.3 24.3
Central & South An1erica 21.9 28.2 32.5 36.5 41.2 Total World 420.7 509.7 563.4 613.0 665.4
Note: Totals· 111ay not equal sum of co111po11ents due to independent rounding Source: !EA, 2007
2030 %p.a.
308.8 1.0 166.2 1.3 94.5 0.7 48.0 1.0 412.8 3.0 79.0 1.8 223.6 3.7 37.7 2.4 26.8 2.6 45.7 2.8 721.6 2.0
When comparing among different regions of non-OECD countries, from the same table, it is obvious that Asia constitutes the largest portion, about 54% of the energy consumption. Also, in terms of growth rate, it is 3.7% p.a., the highest among all the regions.
From the above Table 4, it was found that developing countries are consuming more energy, while among the developing countries, Asia as a region consumes the most. Table 5 presents the comparison of energy consumption patterns for GS developed countries and Southeast Asian developing countries. In term of per capita energy consumption, the values of developed countries are very much higher than the developing countries. While among the developing countries, the per capita energy consumption of Malaysia is I 06.3 million Btu, which is comparatively high compared to the other Southeast Asian countries (except Brunei and Singapore) that generally are lower than 60 million Btu.
In terms of energy intensity, comparatively, the energy intensities of the developed countries are also generally higher than the developing countries,
PLANNING J!ALAYSJA
Journal of the Afalaysia11 !11slilule o/P/a1111ers (2008)
Article Refereed Ref; MIP-PMJ 06/08
particularly for the case of Canada and Russia. Similarly, among the developing countries, it can be seen that the energy intensity of Malaysia is obviously higher than other developing countries, and in fact it is higher than quite a number of developed countries.
bi
Ta e 5: Comoanson o f energy consumption pattern in se ecte d countries, 2005
Primary energy consumption
Country Per capita Energy intensity
(million Btu) (Btu oer 2000 US$)
Y(l$ countries ··.·,· •. ·• ·.· .. · .;
.,
); "< ··)><:):'.·;<:£'..·.':.'· :.·.::.:.:·: ... :·· ... ·: :, .Canada 436.2 13,825
France 181.5 7,243
Gennany 176.0 7,021
Italy 138.9 5,788
Jaoan 177.0 6,539
Russia 212.2 14,935
United Kingdom 165.7 6,048
United States 340.5 9,113
>s.OUthe:astAsiitri COUUfi:ikS.~:){; ·.;.:.}.'.'':'>··> ; .. :.': ..
Brunei 314.4 17,952
Cambodia 0.6 302
Indonesia 23.4 5,839
Malavsia 106.3 9,253
Myanmar 5.4 1764
Philinnines 15.2 4,865
Singapore 457.1 15,444
Thailand 56.5 6,848
Vietnam 14.7 4,857
Source: EJA, 2007
Table 6 shows the final commercial energy consumption in Malaysia during the Eighth and Ninth Malaysia Plans period, which covers the period of 2000 to 2010. In this respect, it includes the total energy delivered to final consumers, but excluding gas, coal and fuel oil used in electricity generation. The data show that the energy consumption has grown from 1,244 PJ in 2000 to 1,632 PJ in 2005, and expected to further grow up to 2,218 PJ by 2010. In line with the rapid economic and population growths, the energy consumption growth rate for 2000-2005 was 5.6% p.a., and it is projected to increase up to 6.3% p.a. in 2005-2010.
In terms of sectoral demand, no major change is expected during the period of 2000 to 2010, in which transport and industrial each constitutes about two fifths
Wee Kean Fong, Hiroshi Mats11111oto, Chin Sio11g Ho, and Yu Fat l1111
Energy Commmplioll and Carbon Dioxide Emission Considerations in the Urban Planning Process in Afalaysia
of the total consumption, and followed by residential/commercial, non-energy and agriculture/forestry.
Tab e 1 6 F 1na commercia enerPV emand d by sector, Malaysia
Sources Energy consumption (PJ) · Growth rate(% p.a.)
2000(%) 2005 (%) 2010 (%) 2000-2005 2005-2010
Industrial 1
477.6 630.7 859.9 5.7 6.4
(38.4%) (38.6%) (38.8%)
Transport 505.5 661.3 911.7 5.5 6.6
(40.6%) (40.5%) (41.1%)
Resident/ 162.0 213 284.9 5.6 6.0
co1nmercial (13.0%) (13.1%) (12.8%)
Non energy" 94.2 118.7 144.7 4.7 4.0
(7.6%) (7.3%) (6.5%)
Agriculture/ 4.4 8.0 16.7 12.9 15.9
Forestry (0.4%) (0.5%) 0.8%)
Total 1,243.7 1,631.7 2,217.9 5.6 6.3
Note:
1Jnclude111a11ufacturing, 111ining and construction.
21nclude natural gas, bitu111en, asphalt, industrial feedstock and grease.
Source: EPU, 2006.
With respect to per capita consumption, in terms of final commercial euergy demand, it was 52.9 GJ in 2000, and then rapidly increased to 62.2 GJ in 2005. In line with the projected strong national economic growth, it is projected to further escalate to 76.5 GJ by 2010, more than 40% increase over the 10-year period from 2000 to 2010 (EPU, 2006).
INTERNATIONAL COOPERATION IN HANDLING GLOBAL
WARMING ISSUES
Global warming and climate change are the two greatest issues to mankind cuffently. The urgency to fight against them has drawn serious attentions from leaders, scientists and individuals all over the world. In fact, the event that for the first time drawing attentions from the world on the global warming and climate change issues can be traced back to the
first "World Climate Conference" organized by the World
Meteorological Organization (WMO) in 1979. The conference expressed concern that "continued expansion of man's activities on earth may cause significant extended regional and even global changes of climate", and it called for "global cooperation to explore the possible future course of global climate and to take this new understanding into account in planning for the future development of human society" (IPCC, 2004 ).
PLANNING 1l/ALAYS/A
Journal of rhe Afofoysian lnsti111re of Planners (2008) Article Refereed Ref MIP-PMJ 06/08
Subsequent to the said conference, various international efforts have been taken to monitor the climate change and to mitigate it. In l 9SS, the IPCC was set up and followed by the adoption of the United Nations Framework Convention on Climate Change (UNFCCC).
Presently the primaiy international policy framework against global warming and climate change is the UNFCCC, specifically the Kyoto Protocol, which sets emission limits for many of the world's most economically developed nations. Under the Kyoto Protocol, the participating developed countries are committed to reduce their GHG emissions on an average of about 5% by the target years of 200S to 2012 (UN, 199S).
For post-Kyoto Protocol, during the United Nations Climate Change Conference 2007 held in Bali, Indonesia, it was decided to adopt the Bali Roadmap, which charts the course for a new negotiating process to be concluded by 2009 that will ultimately lead to a post-2012 international agreement on climate change (UNFCCC, 2007).
Also, during the GS Summit 2007 held in Heiligendamm on 6-8 June 2007, the participating countries have agreed to consider seriously the target of halving of GHG emissions by 2050 (GS, 2007). Presently, the common global target is to cut the GHG emissions, particularly C02 emissions, by 50% of the present level by year 2050. In this respect, Japan has launched the national campaign of 'Cool Earth 50', which targeting to cut the C02 emissions up to half of the present level, by the year 2050. Also, the State of California of the United States is aiming to cut the emission to SO% below I 990 level, while London has set the target of 60% carbon emission reduction from 2000 level, both with the common target year of2050 (TMG, 2006).
Presently the international policy frameworks on combating climate change are focusing on the developed countries. However, due to rapid increase of GHG emissions from developing countries ( cf. Table 1 and Table 2), particularly for the case of China and India, there are increasing concerns on the necessity to cap emissions from the developing countries. For the case of Malaysia, Malaysia is one of the 172 countries
Wee Kean Fong. Hiroshi Mmsumoro, Chin Siong Ho, and Y11 Fa1 L1111
Energy Co11s11mptio11 and Carbon Dioxide Emission Considerations in the Urban Pla1111i11g Process in Afofaysia
signed the Kyoto Protocol but is not within the 35 countries that have committed to cap their emissions.
In spite of the absence of international commitment on the cap of C02 emissions, Malaysian Govermnent has been continuously promoting energy efficiency, usage of renewable energy and combating climate change. In this respect, Malaysia is one of the 16 countries signed the
Cebu Declaration on East Asian Energy Security Cebu, Philippines, 15
Janumy 2007 (ASEAN, 2007). Under the Cebu Declaration, the
participating countries officially acknowledged the energy and climate change issues. All the countries concerned have agreed to make concerted efforts to improve energy efficiency, to promote alternative and renewable energy, and to mitigate GHG emissions.
ROLES OF URBAN PLANNING IN HANDLING ENERGY AND CARBON DIOXIDE ISSUES
Urbanization, Energy Consumptions and CO, Emissions
The most significant increase of energy consumptions and GHG emissions is taking place in cities, where rapidly expanding populations enjoy higher living standards and material affluence than people in the rural areas (Fong et al., 2007a; IGES, 2004). With respect to GHG emissions, Larson (2007) reported that the share of GHG emissions in building sector, thus in urban area, is in the range 20% to 25%, and this would be higher in developed countries. It is therefore clear that strategies for the reduction of energy consumption and GHG emissions would have to be focusing on urban sector, which is the main source of energy consumptions and GHG emissions.
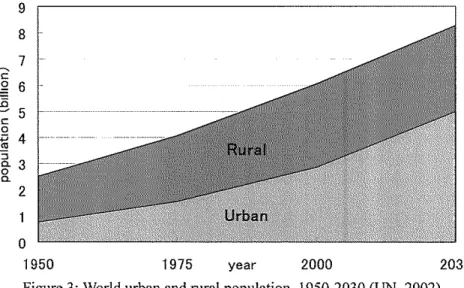
Rapid urbanization is in progress all over the world, and the urban population is expected to continue to increase. In 2000, world urban population was about 2.9 billion (47.2% of world population) and it is expected to rise to about 5 billion (60.2% of world population) by 2030 (cf. Figure 3). During the period of 2000-2030, the world urban population is projected to grow at an average rate of 1.9% per year.
9
8
7
c
~ 6
8
c 5 0 ·.;:; 4
-"
::!0. 3
0
0. 2
0
1950 1975 year
PLANNING i\IALAYSIA
Journal of the A/a/aysia11 /11sti//lfe af Planners (2008)
Article Refereed Ref: MIP-PMJ 06f08
2000 2030
Figure 3: World urban and rural population, 1950-2030 (UN, 2002)
Although concentration of people in cities brings advantages in terms of work and modem conveniences, it causes deterioration of living standards by various environmental problems, and in global environmental problems that spread beyond national borders (AIJ, 2005). Thus, urban environmental problems are significant elements in global environmental problems. Hence, if no immediate
action is taken in cutting do\vn the energy consumptions in urban sector, the
impacts on climate change and other associated adverse impacts on the global,
regional and local environments \vould be \vorsen.
Rapid urbanization has resulted in more rapid change of microclimate in the urban areas. One of the phenomena is the URI effect whereby a zone of higher air temperature is found in the central area of a city, displaying temperature contours like an island of heat. The world average temperature increase due to URI effect is 0.006°C (IPCC, 2007). There are many factors contributing to the occurrence of UH! phenomenon, and energy consumptions and C02 emissions are among of the main factors, whereby the heat generated by the consumption of energy by air-conditioning equipment, lighting systems, automobiles, factories, etc. is released into the atmosphere (AIJ, 2005).
Although urban energy consumption is one of the main causes of URI phenomenon as well as global climate change, unfmtunately, presently, the nature of energy use in and GHG emissions from cities is still not well understood. Although a number of research projects on sectoral energy use for
IVee Kean Fong, Hiroshi Afatsumofo, Chin Sio11g Ho, and Yu Fat lu11
Energy Co11s11111ptio11 and Carbon Dioxide Emission Co11sideratio11s in the Urban Pla1111i11g Process ill Malaysia
industries, urban transportation and so on have been conducted from the viewpoint of managing air pollution, an overall picture of energy consumption and C02 emissions is still missing (IGES, 2004). Due to the growing concern
about GHG, it is thus vital to understand energy use at city level in greater detail and to take GHG emissions into consideration so that systematic actions can be implemented in the urban planning process. In this respect, the present authors have carried out several studies focusing on the topics of energy conservation and C02 reduction (Fong et al., 2007a-2007g; Ho 2005 & 2007;
Ho and Fong, 2007).
Urban Planning, Energy Consumptions and CO, Emissions
The issues of global climate change and the UHI phenomenon has drawn concern among policy makers, urban planners and scientists on the importance of promoting a low carbon city. Researchers and policy makers responsible for climate change and energy modeling have used the term low carbon society in 2003 when the developed nations announced a target for reducing C02 emissions in order to stabilize the world climate. Low carbon society projects have been initiated by Japan/UK collaboration to draw out comprehensive vision and definition oflow carbon society (NIES, 2006).
Scientific research has been carried out to investigate the urban C02 emission scenarios, and to study the methodologies to reduce urban energy consumptions and for achieving low carbon city. From these studies, it is obvious that urban planning is playing an important role in creating a low energy consumption and low C02 emission city. It is found that there are several urban planning related factors that can determine the extent and nature of energy use and C02 emissions in cities, as explained below (Fong et al. 2007a-2007g; Ho 2005 &
2007; Ho and Fong, 2007; IGES, 2004):
Compactness and density of development
The compactness and density of urban development has very significant influence on the transportation system, thus influencing the energy consumption and C02 emissions. A highly compact city facilitates the transit oriented development (TOD) that directly reduces the private vehicle trip and reduces the energy consumptions and C02 emissions from the transportation sector. The compactness of urban development also influences the district heating and cooling using co-generation systems. In this respect, urban sprawl results in the necessity of lengthy distribution systems, and thus undermines efficient energy
use.
Urban structure
PLANNING il!ALAYSIA
Joumal of the ,\fafaysian /11stit11te of P/01111ers (2008)
Article Refereed Ref' MIP-PMJ 06i08
Urban structure and urban functions affect energy use, and thus C02 emissions, as they influence the transportation systems. Mixed land use (residential, commercial, industrial, etc.) results in different energy use than does segregated land use. A reduction of physical separation of activities has been urged in nearly all studies of energy and spatial structure. Urban zoning policies and industrial relocation from city centers to suburb areas significantly influence the travel demand and energy use. Spatial strategies such as compact cities and TOD are effective in reducing energy demand for transportation. However, any saving from transportation energy requirement must not be overweighed by losses in economies of scale including energy economic of scale.
Settlen1e111 patlern
Comparative analyses of different urban structures suggest that an energy efficient settlement pattern would consist of small to medium sized settlements or settlement clusters. Within settlements, over-concentration should be avoided. Residential areas should be planned around more disperse clusters of employment and services in relatively compact urban sub-units. However, high densities would not necessarily be a feature of this settlement pattern.
Transportation svsten1
The transportation system is one of the key factors affecting the urban energy consumption and C02 emissions. As mentioned above, the transportation system is heavily depends on the urban structure. Ho and Fong (2007) pointed out that increased density favored public transportation because of critical mass. By doing so, a shift to public transportation can be done easily. Also, energy implications of transportation systems depend on a number of factors, such as the availability of infrastructure for rail and road networks, mass transportation systems, the share of public and private transportations, as well as the role of
alternative fuel vehicles. Besides, socio-economic factors, such as income, are
also influencing the transportation pattern. In most of the developing countries, rising incomes and perception of social status through car ownership have resulted in cars dominated transportation. This trend results in increased demand for transportation and eventually increases the urban energy demand and CO, emissions.
Income level and lifestvle
Past research on the relationship between income and energy use at the national scale has clearly demonstrated that there is a strong correlation between per capita commercial energy consumption and GDP (IGES, 2004). It is generally accepted that per capita energy use increases with income. High income is
Wee Kean Fong, Hiroshi A1atsumoto, Chin Sio11g Ho, and Yu Fat L1111
Energy Co11s11mprio11 and Carbon Dioxide Emission Considerations in the Urba11 P/a1111ing Process in J.Jalaysia
associated with better lifestyles and higher material affluence, which eventually result in increased energy use and C02 emissions.
Building technologies and floor svace use
Building-related technologies such as air conditioners, district heating and cooling systems, insulation systems and other building energy management systems have a significant effect on energy use. Services such as lighting and space heating/cooling depend directly on floor space, whose use depends on a number of factors such as real estate market prices, business culture and socio-cultural factors.
ENERGY AND CARBON DIOXIDE EMISSION CONSIDERATIONS IN THE URBAN PLANNING PROCESS IN MALAYSIA
Spatial Planning Framework in Malaysia
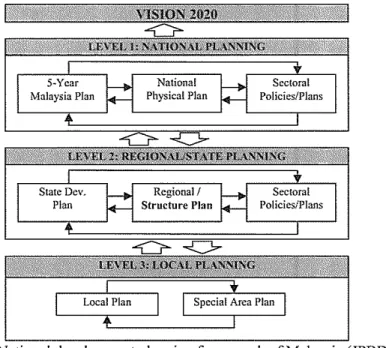
In Malaysia, development planning is practiced at three tiers of government as shown in Figure 4. At the national level, development planning in the country operates within the stated goals outlined in long-term Vision 2020 and the Outline Perspective Plans (OPPs), then followed by the short- and medium-terms Malaysia Plans, National Physical Plan (NPP) as well as the other sectoral policies/plans.
In this respect, spatial development is mainly guided by the NPP. In order to achieve the goals of NPP, which is to establish an efficient, equitable and sustainable national spatial framework to guide the country towards achieving developed nation status by 2020, four mutually supportive objectives have been identified as follows:
a. To rationalize national spatial planning for economic efficiency and global competitiveness
b. To optimize utilization of land and natural resources for sustainable development
c. To promote balance regional development for national unity
d. To secure spatial and environmental quality and diversity for a high quality of life.
In 2006, National Urbanization Policy (NUP) was formulated to complement the NPP. NUP serves as the main thrust for all urban planning and development activities in Peninsular Malaysia including development plans at the state and local level. This policy outlines the thrusts, policies, measures and
PLANNING 11/ALAYSIA
Jo11mal of the ,\lala)~~ia11 /11stit11te of Plmmers (2008)
Arlicle Refereed Ref; MIP-PMJ 06/08
implementation plans to coordinate and manage the urbanization process of the country. It guides and coordinates the planning and urban development of the country to be more efficient and systematic, particularly to handle the rapid increase of urban population, with emphasis on balancing the social, economic and physical development within urban areas. It also serves as the foundation to encourage racial integration and solidarity for those who reside in the urban
areas.
Figure 4: National development planning framework of Malaysia (JPBD, 2005)
At the state level, development is guided by the Structure Plans and sectoral policies that are articulated from time to time. Local level planning is catTied out in the form of statutory development plans such as the Local Plans and Special Area Plans for the local authority areas. Structure Plans distribute the expectation of development within each state and propose major economic and infrastructure projects for the states. The time perspective for structure plans is 20 years, and for the current set of Structure Plans, commensurate with the time perspective of Vision 2020. (JPBD, 2005)
Wee Kean Fong, Hiroshi Matsumoto, Chi11 Siong Ho, and Yu Fat Ltm
Energy Co11sumptio11 and Carbon Dioxide Emission Considerations in the Urban Pla1111ing Process i11 Afala;:da
Absence of Energy Consumption and C01 Emission Considerations
Presently, most of the developed countries are committed to cut down their C02 emissions as stipulated under Kyoto Protocol as well as the recent declaration during the GS Summit 2007 in Heiligendamm, Germany (GS, 2007). In this respect, developing countries are still lapsed behind most of the developed countries. However, being a country of responsible, Malaysia, one of the fastest growing developing countries in Southeast Asia, is continuously putting aggressive efforts in combating global warming. This section examines the present efforts in controlling energy consumptions and C02 emissions in Malaysia, from the perspective of spatial planning.
As mentioned above, spatial development in Malaysia is mainly guided by the NPP. Presently, there is no specific policy related to energy conservation and controlling of C02 emissions in the NPP. However, there are several principles that have indirect implications on energy conservation, namely Policy 3:
Maximize use of existing infrastructure, Policy 6: Favor public transport over
private transport, and Policy 7: Compact urban forms.
For the case of NUP, although NUP is a comprehensive plan, there is also no policy directly referred to energy conservation and reduction of C02 emission. Policies that may have indirect implications on energy planning are found in Policy Thrust 1 and Policy Thrust 3 as follows:
Thrust I
Thrust 2
Thrust3 Thrust4 Thrust 5 Thrust 6
Towards an efficient and sustainable urbanization
Development of a resilient, dynamic and competitive urban economy
Towards an integrated and efficient urban transportation system
Provide quality urban services, infrastructure and utility
Create a conducive urban living environment with a distinct identity
Effective urban governance
Part of Policy Thn1st 1 - Towards an Efficient and Sustainable Urbanization
highlighted the policy to promote national growth conurbation policy, and specific conurbation zones have been identified. The advantage of the national conurbation policy in term of energy conservation is that it promotes economic of scale and energy efficient system of these designated growth regions.
PLANNING ,lfALA }'SIA
Jou ma/ of the Jlalaysitm lnsti/llfl.! of Plannen (2008) Article Refereed Ref: ?.HP-PMJ 06/08
Compact city development can be developed to optimize energy utilization in the region by reduction in inovetnent and transportation energy.
Policy Thrust 3 - Towards an Integrated and Efficient Urban 7i·ansportation System promotes an integrated and efficient urban transportation system. As
transpo11ation sectors consume more than a quarter of the total energy consumption in Malaysia, an efficient and comprehensive transportation system is vital. The current pressing issues are increase in private car ownership and low utilization of public transportation. The policy thrust promotes the use of integrated public transportation system emphasizing on multi-modal transportation terminal, implementation of TOD development, provision of Park and Ride Terminals, use of environmental-friendly vehicles to reduce level of air pollution.
SECTORS OF STUDY·
Regional contexts
Ponulation and hun1an resource Economic base and nrosnect Land use and nhvsical Urban pattern & develop1nent corridor
Housing
Com111ercial and services
---·"·--~~ ...•...
Industrial
Agriculture, forestry and 111inin_g Touris111
Social facilities Recreation and sports
Environinent and natural resource
_!_~~"~~~g.~.~-~~-~ -
---Comn1unication and transoortation Infrastructure and utilities
Institution and i1nplementation Development concept and strategv StrateQic EIA
Social assess1nent
...
,
...
,
...
Infrastructure
Utilities
,
....,
....•
i···I
.
.
Electricity sunnlv
Telecominunication Infonnation technoloi:>v Gas sunn!y
. .
Figure 5: Energy sector (electricity supply) was a sub-sector under the ut1hties sector in the Johor Structure Plan 2001-2020 study (JPBD, 2001)
For the State and local levels, in the process of the preparation of Structure Plans and Local Plans, energy sector study very often focuses on fulfilling the energy demand rather than investigating measures to reduce the city-wide or region-wide energy consumption through an integrated approach. For example, in the study of Johor Structure Plan 2001-2020, the energy sector was
Wee Kean Fong, Hiroshi Matsumata, Chin Siang Ho, and Yu Fat L1111
Energy Co11s11111ptian and Carbon Dioxide Emissian Considerations in the Urba11 Pla1111i11g Process i11 ,\1afa.1:~ia
considered as one of the sub-sectors under the utility sector, also, in fact, the study focused on electricity supply rather than energy demand and supply as a whole ( cf. Figure 5). Besides, energy issue was also not covered in the environmental sector despite that energy and C02 emission issues have been widely recognized as global environmental issues that require immediate attentions from all parties.
On a whole, spatial planning framework in Malaysia is still lacking serious considerations on the issues of energy consumptions and C02 emissions. Although there are some policies in the NPP and NUP indirectly favoring energy conservation, there is still no measure that directly focuses on promoting energy conservation/efficiency and capping C02 emission. Also, instead of promoting energy conservation/efficiency, most of the Structure Plans, focus on fulfilling the continuously increasing energy demand so as to support the desired high economic growth rate.
CONCLUSIONS REMARKS
This paper highlighted the importance of energy conservation and reduction of C02 emissions from both global and Malaysian points of view. Although Malaysia is presently not a developed nation, and there is no clear commitment to cut down C02 emissions under any international framework, toward achieving the developed nation status under the Vision 2020, it is necessary to take concerted efforts to cap C02 emissions as part of the global efforts in combating global warming and climate change, while maintaining the desired economic and population growths.
The earlier parts of this paper pointed out that the main contributors to the global wanning phenomenon are energy use and land use change. In this respect, urbanization is one of the essential aspects that must not be neglected in handling global warming issues, as the main portion of energy consumption and C02 emission is occurring in the cities. Hence, spatial planning that deals with planning for land use and urban structure plays a very important role m controlling energy consumption and C02 emissions in the urban systems. While many countries have recognized the importance of the role of spatial planning in energy conservation and reduction of C02 emissions, in Malaysia, to date there is still no spatial planning policy that directly deals with the energy and C02 issues. Instead, in the urban planning process, efforts have been put on fulfilling the high energy demand (which focusing more on electricity supply) so as to support the desired high economic growth. Hence, this paper aims to
PLANNING ,l/ALAYSIA Journal of the }.falaysfrm [11stilllle of Pla1111ers (2008)
Article Refereed Re/ MIP-PW 06/0S
highlight the importance of energy conservation and C02 reduction as the core considerations in the spatial planning process in Malaysia, from national till local levels.
For instance, in the preparation of Structure Plans, instead of trying to fulfill the expected high energy demand, measures should be taken to cut down the energy
consumptions and C02 emissions, so as to achieve a balance between economic
development and environmental conservation. Every proposal in the structure plan, to a certain extent, would have some impacts on the energy consumptions and C02 emissions in the planning area as a whole. For instance, a proposal to convert a forest area to commercial development would not only increase the
energy consumption and C02 emission in the area concerned, but will also
reduce the capacity of carbon sink due to the loss of green areas. Hence, due consideration must be taken on the impacts of each proposal on energy consumptions and C02 emissions. In this respect, it is necessary to develop and incorporate a decision making tool to assess the overall impact of development plans (or proposal options) on the city or regional level energy consumptions and C02 emissions as a whole. This decision making tool should be able to assist the decision makers as well as the other relevant stakeholders in making the best choices of development options with due considerations on both
economic and environmental aspects.
For the development of this decision making tool, it is necessary to develop a comprehensive model that is able to provide a holistic analysis on the various development options on the overall urban energy consumptions and C02 emissions. Jn this respect, the present authors are attempting to develop a comprehensive but reasonably simple model that is suitable to be applied in the urban planning process in Malaysia, and parts of the research outputs are reported in Fong et al. (2007a & 2007b) and Ho and Fong (2007).
There are many strategies that can conserve energy and reduce C02 emissions
through spatial planning. For the case of Malaysia, being a developing country, economic development is no doubt the most important consideration in any development plan. Hence, it is vital to identify the best practice with minimum energy consumption and C02 emission while achieving the desire economic
growth. In this respect, the concept of the Kaya Identity would serve as an
important guide in achieve a lo\v energy consumption and low C02 emissions
society under the concept oflow carbon city. The Kaya Identity involved 3 main
concepts, namely per capita activity, energy intensity and carbon intensity ( cf.
Figure 6). From the concept, it is clear that reducing C02 emission by reducing per capita activity is not feasible for a developing country like Malaysia.
Wee Kean Fong, Hiroshi Matsumoto, Chin Siong Ho, and Yu Fat L1111
Energy Consumption ond Carbon Dioxide Emission Co11sideratio11s in the Urba11 Pla1111i11g Process in Aialaysia
Instead, it is important to reduce C02 emission by reducing energy intensity and
carbon intensity.
AMOUNT TOTAL [
CHANGE RATE &SPEED
;per-CaPlta~ ~-Energy~
I I I I
: activity : : intensity:
I I I I
Co 2 em1ss1ons • op • . . p :Activity : : Energy : 1 , 1
L_~pp
___ :
L12-~~~~tz:_:~Jng.
~ ~~ ~
-
"
§.: 0
C02 emissions • Pop •
Activity Energy
Pop Activity
t
t
t
t
change change change change
rate rate rate rate
Figure 6: Concept of Kaya Identity
(Sow~e: NIES, 2006)
~CirbOii-~
' '
: intensity :
'
': C02 :
'
'
L _ ~12t?_r~y _:
co,
Energy
t
changerate
In order to examine the relationship between energy and spatial planning, it is necessary to look into more detailed variables of both of these aspects. The three main components in Figure 7 define the interrelationship between energy demand and spatial structure are(!) Energy demand and supply, (2) Urban form and other aspects of built environment, and (3) Mechanisms of interaction between the energy system and spatial structure. Demand and supply of energy will influence the urban form. The configuration of urban form will affect the interaction of spatial structure and system interaction. It will then form a cyclic cycle in the near futnre when its technology is more advance and appropriate as well as the demand for clean energy is more pressing in future.
This simplified concept attempts to illustrate the energy-spatial relationship, which in reality is far more complicated. The concept must also allow feedback systems that would themselves stimulate new developments and adjustments in the energy system. From the concept, the most commonly explored interactions have been those between various attributes of urban form (size, shape and density) and energy requirement for transportation. The questions that arise are whether any anticipated society changes should be guided by planning intervention into socially desirable forms or whether land use planning control
PLANNING ftfALAYSIA Journal of the /;Jalaysian J11sti111te of Plam1ers (2008) Article Refereed Ref: MIP-PMJ 06f08
is used to ensure spatial structures, which are both efficient in their consumption
of energy resources and realistic.
ENERGY DEMAND AND SUPPLY
RENEWABLE ENERGY
SYSTEM INTERCTION (ENERGY SYTEM &
SPATIAL STRUCTURE)
URBAN FORM AND BUILT ENVIRONMENT
Figure 7: Interrelationship between energy and urban form (Ho, 2007)
On the whole, while it is widely recognized that in achieving a low energy consumption and low C02 emission sustainable society, it is important to carry
out continuous research on the energy saving technologies and measures in various energy consuming sectors such as transportation, industrial, commercial
and residential sectors; more importantly, it requires a holistic analysis and clear understanding of the nature of the highest energy consuming and C02 emission sector i.e. the urban sector as a whole. This paper thus serves a the starting point towards incorporating energy and C02 issues as the core part of spatial planning process in Malaysia, in achieving a low carbon sustainable society of future.
REFERENCES:
AIJ. 2005. Architecture for a Sustainable Future - All about the Holistic Approach in Japan. Tokyo: IBEC.
Anqing Shi. 200 I. Population Growth and Global Carbon Dioxide Emissions.
IUSSP General Conference, 18-24 August 2001, Salvador, Brazil.
Session-S09. (http://www.iussp.org/Brazi/2001/ soo/S09 _Shi.pdf, Retrieved: 4 Nov
2007)
ASEAN. 2007. Cebu Declaration on East Asian Energy Security Cebu, Philippines, 15 January 2007. Jakarta: The Association of Southeast Asian Nations. (http://www.aseansec.org/19319.htm. Retrieved: November 2007)