VOLUME 18 ISSUE 3 (2020), Page 229 – 240
PROFILING THE PERCEIVED MANGROVE FOREST USE
VALUE AND COMMUNITY’S WILLINGNESS TO PAY FOR
MANGROVE CONSERVATION
Yakin Nur Sunoto1, A.A. Fatiah2, Zakiah Ponrahono3 & Mariana Mohamed Osman4
1,2,3 Faculty of Forestry and Environment
UNIVERSITY PUTRA MALAYSIA
4 Kulliyyah of Architecture and Environmental Design,
INTERNATIONAL ISLAMIC UNIVERSITY MALAYSIA
Abstract
A broad range of ecological services from mangrove forest encompasses a mixture of landward and seaward transition around tropical and subtropical areas in many regions that are threatened by humans. Among the issues highlighted in this research are i) the decline in mangrove areas due to development activities, and ii) zero price value of mangrove areas. This study reports on the direct use value of mangrove forest, willingness to pay for the conservation of mangrove forests, and satisfaction towards current mangrove management in Kampung Sungai Melayu, located at Johor state in Malaysia. A face-to-face survey was employed, targeting 111 heads of households and 219 individuals from the local community through a simple random sampling technique. This study concludes that the local community are willing to pay for mangrove conservation at RM17.84 per year. Based on the significant results from the Chi-Square analysis, three factors have a significant correlation with the “willingness to pay” for mangrove conservation which includes the length of residency (X2 = 11.780) and household income (X2 =13.463).
INTRODUCTION
A biologically complex mangrove forest encompasses a mixture of landward and seaward transition area that supports biodiversity with a wide range of habitats for flora and fauna (Nagelkerken et al., 2010). The variety of mangrove resources is a source of income for many lower and middle-class households living near a mangrove forest (Vo, Kuenzer, Vo, Moder, & Oppelt, 2012). The appropriate monetary value can be channelled for the protection and conservation of mangroves. Total Economic Value (TEV) is one of the tools used to quantify natural assets by placing a monetary value on environmental goods and services (Kumar, 2012). However, the inability to trade it in the market for monetary gain is viewed as an issue and challenge in valuing environmental assets when many of them have zero market price, and the ecosystem services is granted 'freely’. in the present study, the mangrove forests are mainly situated along the edges of ‘Sungai Melayu’ (Melayu River) and ‘Sungai Perepat’ (Perepat River) in the state of Johor in Malaysia and the respective tributaries of these two rivers cover an area of about 378.17 ha. Harvesting activities have ceased in the study area for the past 15 years. As such, the mangrove forests are still regenerating, thus it can be considered as a moderately mature forest.
PROBLEM STATEMENT
The forest cover in the state of Johor is currently less than 50% and its mangrove forest area is declining with a total loss 6,120.7 ha within two decades, contributed by large scale projects involving land reclamation activities resulting in the disruption of their ecosystem (PLANMalaysia@Johor, 2017; Azwan, Hani, Hamdan, Aziz, & Shamsudin, 2011). The primary factor contributing to this decline as identified by Azwan et al., (2011) is mainly due to aquaculture industry activities (66.03%), followed by coastal erosion (14.92%), agriculture (11.45%) and others (7.6%). Conflict often arises between environmental protection and economic development; thus, managing land use from an economic perspective is crucial for key decision-makers and stakeholders to use economic approaches to strengthen the intrinsic value of the ecosystem (Vo et al., 2012). This study aims to determine the local community’s “Willingness to pay (WTP)”, and evaluate their satisfaction level on the current mangrove forest management; The objectives of this study are to determine the WTP among the local community for mangrove conservation; to identify the perception of the responsibility of individuals and the community in mangrove conservation and finally to assess the current satisfaction level towards mangrove forest management.
LITERATURE REVIEW
where it incorporates the “Willingness to pay (WTP)” measure. The major weakness in the current economic assessment of the mangrove ecosystem is the lack of nature-human values.
Environmental Valuation
Total Economic Value (TEV) framework comprises two major components which are use value and non-use value, that are further classified into three subcomponents including direct uses, indirect uses and existence value. The direct use value (DUV) is derived from the direct consumption of a mangrove forest including i) consumptive uses of its readily-available resources such as charcoal, wood, fisheries stock and ii) non-consumptive functional services such as tourism, recreation, research and education. In general, direct-use value is straightforward since it is observable and quantifiable (Department of Marine Park Malaysia, 2011). The option value is a more complex use-value as it combines both direct and indirect use values and is associated with future mangrove use. The option value is derived since there is an uncertainty in the future individual consumption (Department of Marine Park Malaysia, 2011). Meanwhile, the non-use value consists of i) existence value: values one place on a resource just by knowing that it exists (Azmi, 2014) and ii) bequest value: a value derived from whether the person can benefit directly or indirectly from it.
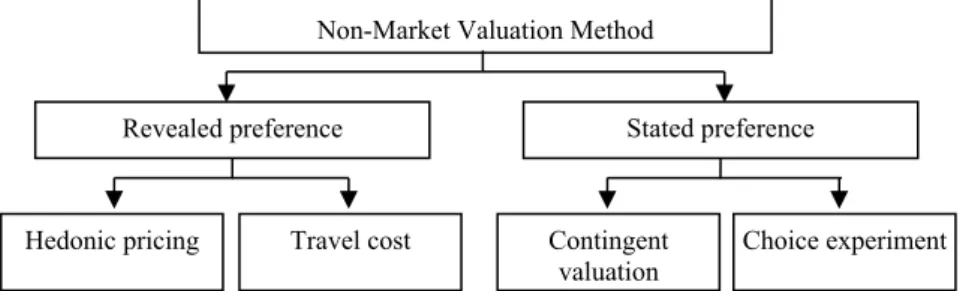
There are two common existing valuation techniques for non-market valuation of goods and services which are the preference and stated preference method (Barbier, 2016). In this study, stated preference method is used to obtain the value of WTP by using the Contingent Valuation Method (CVM), which can reflect the economic value of non-market goods. As far as this paper is concerned, CVM is the only method that can measure bequest value and existence value of environmental goods or services (Nor Hizami, 2014). Figure 1 presents the non-market valuation method. WTP is considered as one of the most crucial approaches in CVM as it can determine the amount of money that a person is willing and can afford to pay to receive goods or services (Samdin, 2008).
Community-Based Conservation
Figure 1 Non-market valuation method (Source: Barbier, 2016; Vo et al., 2012)
METHODOLOGY AND MATERIALS
The research approach consists of descriptive analysis, factor analysis and economic valuation analysis. In this study, the data used consist of primary and secondary data. The primary data were collected using face-to-face surveys with respondents. The survey was conducted from 18 January 2018 until 21 January 2018 in Kampung Sungai Melayu, Johor, Malaysia. Secondary data collection involved acquiring data, for example, numerical data, reports, and maps from agencies in the private sector. Other than that, a preliminary site visit was conducted on Thursday (19 October 2017) to get the overall view of local activities at Kampung Sungai Melayu. The study area is Kampung Sungai Melayu which is located downstream of ‘Sungai Melayu’ (Melayu River) (Figure 2). Kampung Sungai Melayu is selected as the study area because of its vicinity to the mangrove forest of Sungai Melayu and has a local community who depends on fisheries activities. The population size of Kampung Sungai Melayu is 813 villagers.
Questionnaire
In this study, probability sampling techniques were employed through simple random sampling. The sampling technique ensures all the residents have an equal chance of being selected and produce precise estimates of the population percentage. By using Slovin’s formula of sample size, the number of samples for the local community was determined, which was 269 respondents. Two sets of questionnaires were distributed to the selected respondents. The first set was for the heads of households, and the second set was for the common villagers. The questionnaires were prepared in the Malay language as all the villagers are of Malay race; this was to provide an easy and locally intact atmosphere during the survey and to reduce any possibility for errors. The items constructed in the questionnaires were referred and based on previous studies to ensure the answer could reflect and represent the variables. Experts in the fields related to this study were consulted to validate the items in the questionnaires.
Non-Market Valuation Method
Revealed preference Stated preference
Choice experiment Contingent
valuation Travel cost
Figure 2 Satellite image of Kampung Sungai Melayu (Source: Google Map, retrieved on 16 January 2018)
RESULTS AND DISCUSSIONS
The local community survey successfully engaged with 111 heads of households and 219 villagers; and the data analysis is conducted by using descriptive analysis and inferential analysis.
Socio-demographic profile of the head of household
Out of the total 111 heads of households that participated in the survey, 91.9% (102) were male and 8.1% (9) were female. More than half of the respondents have primary school education (55.9%); 65.8% (73) respondents are self-employed mostly as fishermen, 10.8% (12) are working in the government sector, 18.0% (20) work in the private sector while the other 6 respondents were categorised as others. Majority of the respondents, 86.5% (96) has been a resident in the study area for more than 20 years. A total of 75.6% (84) respondents have a household income of RM2000 and below, 11.7% (13) had a household income within RM2001-RM3000, and the rest generated more than RM3000 monthly. 61.3% (68) respondents are fishermen, and 38.7% (43) are non-fishermen. Only 16.2% (18) respondents said that they had a side income by doing other jobs, and 8 of them are involved in fisheries activities as their source of side income. Mangrove Use Value by Head of Households
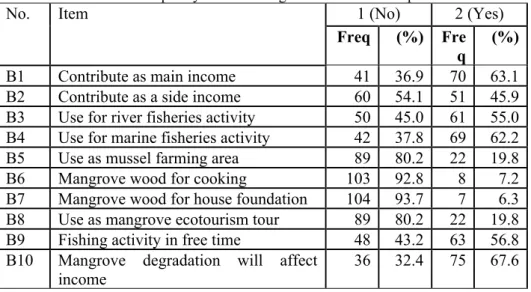
directly utilising the mangrove products as their main source of income, and 45.9% of them are earning a side income from the mangrove produce. A total of 55.0% respondents claimed that they use the mangrove area for fisheries activities at the river; however, 37.8% of respondents stated that they are involved in marine fisheries activities at the Straits of Johor. Overall, 67.6% of respondents claimed that their income would be affected if the mangrove area is compromised, thus indicating its significant contributions to the households’ livelihoods.
Table 2 Frequency table of mangrove related consumption
No. Item 1 (No) 2 (Yes)
Freq (%) Fre q
(%)
B1 Contribute as main income 41 36.9 70 63.1
B2 Contribute as a side income 60 54.1 51 45.9
B3 Use for river fisheries activity 50 45.0 61 55.0 B4 Use for marine fisheries activity 42 37.8 69 62.2
B5 Use as mussel farming area 89 80.2 22 19.8
B6 Mangrove wood for cooking 103 92.8 8 7.2
B7 Mangrove wood for house foundation 104 93.7 7 6.3 B8 Use as mangrove ecotourism tour 89 80.2 22 19.8 B9 Fishing activity in free time 48 43.2 63 56.8 B10 Mangrove degradation will affect
income
36 32.4 75 67.6
Among 19 (17.1%) respondents who gave an estimation of the value for one acre of mangrove forest, the lowest value recorded was RM8000, while the highest was RM1,000,000. The average value between these 19 respondents is RM128,315.79, and the median is RM50,000.00. Contrary to an earlier study (Kuenzer & Tuan, 2013), the average was 7,145.29 USD or RM23,436.55 (RM3.28 per USD in 2013) per acre and that was multiplied by the size of the mangrove-covered area to get the overall value. However, in this study, the mangrove-covered area in Kampung Sungai Melayu is not known; thus, the overall value could not be calculated.
Table 3 Income gained from fisheries activity
Item Range Frequenc
y
Percenta ge (%) Income from
fisheries activities
0 35 31.6
1-500 22 19.8
501-1000
38 34.2
1001-2000
13 11.7
>2000 3 2.7
Socio-demographic profile of the respondents
The socio-demographic background of respondents in this study consists of 56.2% (123) male and 43.8% (96) female. Respondents with a secondary school education represent almost half from the total respondents (47.9 %). Meanwhile, 39.7% (87) of respondents were self-employed mostly as fishermen, and ‘others’ here referred to the housewives and the unemployed at 32.4% (71). Majority of the respondents, 79.5% (174) has been living in the study area for more than 20 years. This is similar to a study conducted by (Abdullah et al., 2014), where up to 75% of their respondents has lived in the area of interest for more than 20 years. The household income is considered low since 37.4% (82) of the respondents has a household income of below RM1000, and 37% have a household income between RM1001-RM2000. A total of 32.9% (72) respondents were fishermen, while 67.1% (147) were non-fishermen. Only 10% (22) of the respondents said that they had a side income by doing other jobs.
Willingness to pay for mangrove conservation
The amount that the local community were willing to contribute to mangrove conservation were identified through an open-ended question. It allows respondents to state whatever amount they are willing and able to pay based on their current income and situation. A simple majority of 62.1% (136) respondents are willing to contribute for mangrove conservation in the future while the rest disagreed.
Table 5 Frequency table of WTP
Willingness to pay Frequency Percentage (%)
Yes 136 62.1
No 83 37.9
the annual fee. The mode value listed was RM10 by 52 respondents. One respondent is willing to pay RM275 per year for mangrove conservation; however, this amount will be excluded in the calculation as it is classified as an outlier whilst the lowest amount recorded was RM1. The mean amount of WTP was RM17.84 per year for mangrove conservation. A study by (Kamri, 2014) on visitors’ WTP in Bako National Park, Sarawak reported that 80.5% tourists (non -local visitors) were willing to pay for conservation while only 43% of -locals were felt the same way. The WTP value for foreign visitors (RM51.76) was 1.58 higher than local visitors (RM18.80). Another study by Shammi (2014) discovered that a majority (61.2%) of tourists were willing to pay with an estimated median ranging from RM17.98 to RM21.72.
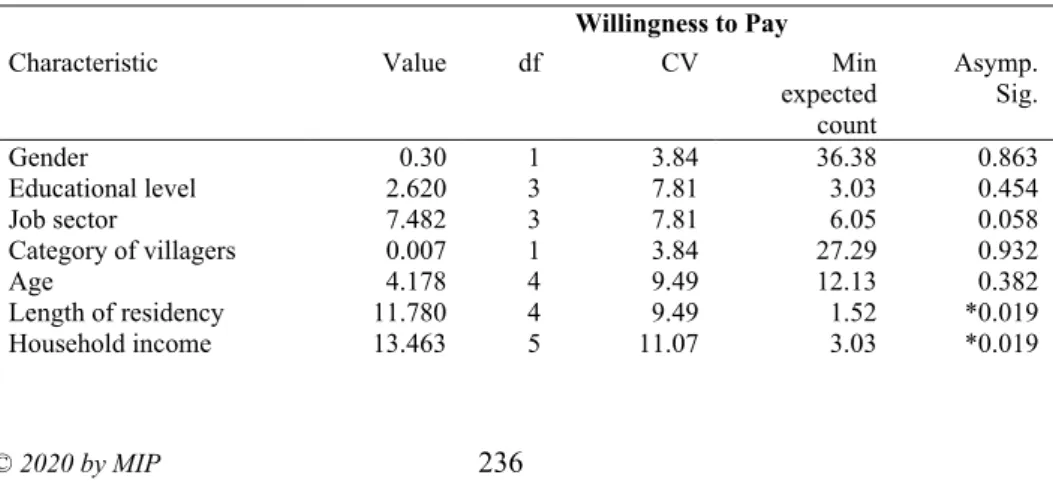
For the 83 respondents who answered, they were not willing to pay, the following question asked for them was ‘What is the reason for your answer in Question 1?’. Table 6 shows the frequency of the reasons stated by all the respondents. A majority (46) of respondents stated that they were not aware of the conservation measures, 18 respondents considered it as a government responsibility to fund the conservation works, while 12 respondents said it was because of income constraints. Further analysis is conducted in this study to identify the socio-demographic factors that are significant to the WTP by using Chi-Square test of significance (Table 7). Based on the results, two factors are significant which include the length of residency (X2 = 11.780) and household
income (X2 =13.463).
Table 6 Reasons for not willing to pay
Reason, not WTP Freq. Percentage (%)
Government responsibility 18 21.7
Income constraint 12 14.5
Did not know about conservation 46 55.4
Others 7 8.4
Table 7 Chi-square tests result between socio-demographic characteristics and WTP
Willingness to Pay
Characteristic Value df CV Min
expected count
Asymp. Sig.
Gender 0.30 1 3.84 36.38 0.863
Educational level 2.620 3 7.81 3.03 0.454
Job sector 7.482 3 7.81 6.05 0.058
Category of villagers 0.007 1 3.84 27.29 0.932
Age 4.178 4 9.49 12.13 0.382
Length of residency 11.780 4 9.49 1.52 *0.019
Number household members
0.665 4 9.49 1.89 0.956
*significant value, p<.05
Community’s satisfaction towards mangrove conservation activities
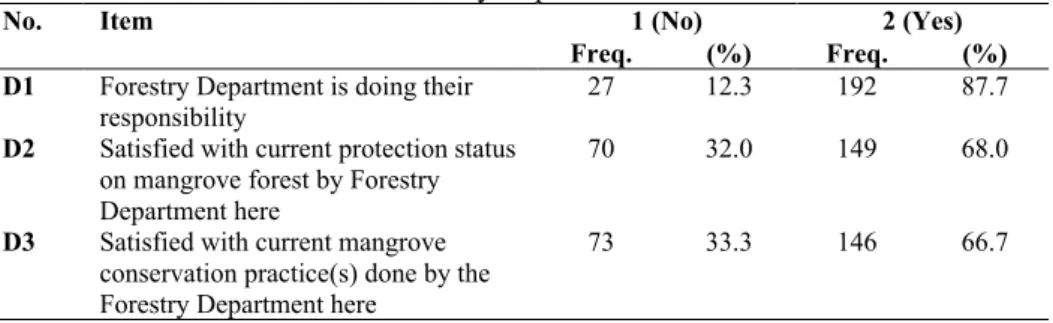
Items D1, D2 and D3 in Table 8 were employed to assess their satisfaction towards the current management practice(s) by the authority, which is currently under the control of the Forestry Department. Table 8 also presents the respondents’ view regarding the current mangrove management practices by the Forestry Department that is responsible to manage, maintain and protect the mangrove forest. This mangrove forest has only been gazetted in 2013 when this village was undergoing the eco-tourism program under the Iskandar Regional Development Authority. Previously, the local community can freely access and consume the products and by-products of the mangrove forest.
Table 8 Respondents’ satisfaction toward current management practice(s) by the
Forestry Department
No. Item 1 (No) 2 (Yes)
Freq. (%) Freq. (%)
D1 Forestry Department is doing their responsibility
27 12.3 192 87.7
D2 Satisfied with current protection status on mangrove forest by Forestry Department here
70 32.0 149 68.0
D3 Satisfied with current mangrove conservation practice(s) done by the Forestry Department here
73 33.3 146 66.7
A total of 149 (68%) respondents are unsatisfied with the current protection status of the mangrove forest by the Forestry Department in Kampung Sungai Melayu, while 146 (66.7%) of them are not in agreement with the current mangrove conservation practice(s) done by the Forestry Department. Majority of them, 192 (87.7%), also agreed that it is the Forestry Department’s responsibility in managing the mangrove area. On the other hand, item D4 and D5 as presented in Table 9 were employed to assess respondents’ view on themselves and the community regarding the responsibility towards the mangrove forest.
Table 9 Respondents’ view on self and community responsibility
N o.
Item 1 (No) 2 (Yes)
Fre q. ( % ) Fre q. ( % ) D
4 I feel responsible to take care of mangrove here 64 29.2 155 70.8
D
Then, the respondents were asked about their personal views on the matter of responsibility. Most of them, 155 (70.8%), felt responsible for taking care of the mangrove forest, while the remaining 64 respondents did not felt otherwise. They were then asked about community engagement in mangrove forest conservation with the Forestry Department. A majority of them, 156 (71.2%), agreed that the community should be involved in mangrove forest management and assist the Forestry Department in managing, maintaining and protecting the mangrove forest, whereas 63 (28.8%) respondents disagreed. These are the positive results obtained from the survey conducted where the local community does have a high sense of responsibility and agrees to the idea of collaborating with the Forestry Department to protect and manage the mangrove forest. Therefore, this indicates a significant opportunity for the authority to engage with the community in managing the mangrove forest together, whether it is through discussion or management and decision-making processes as well as in conducting related activities.
CONCLUSION AND RECOMMENDATIONS
In summary, the willingness of the local community to pay for mangrove conservation is important as an overall view for establishing a mangrove conservation fee that may be imposed on them. The unwillingness to pay also needs to be understood because, through their response, this study highlighted the probable causes of refusal in paying for mangrove conservation among the villagers, thus suggesting ways to overcome it. The mean payment that the local community are willing to contribute for mangrove conservation purposes is RM17.84 per year and the mode of the listed amount is RM10. This study also discovered that the local community agreed with the responsibility of the Department of Forestry. In addition, they felt that the local community should be involved in mangrove conservation along with the forestry rangers.
RECOMMENDATIONS
In summary, this study recommends:
i. Local community empowerment
Generally, the local community showed a positive response to mangrove conservation. Thus, empowerment initiatives in maintaining the mangrove forest are recommended to achieve excellent mangrove management. Governmental agencies, for example, should involve local villagers into the management, policy and decision making in mangrove management as shared property. Thus, conservation-based management will be able to be executed effectively.
Acknowledgement of perceived mangrove ecosystem benefits through ecotourism and fisheries activities could act as a foundation to formulate a sustainable mangrove forest management plan collectively. The authority or governmental agency may provide various forms of support for the community in helping them to develop their stewardship towards mangrove forest management, and conservation works as the mangrove area has a unique character which can be utilized in the tourism industry. Mangrove area in Kampung Sungai Melayu could be developed and rejuvenated as a passive recreational area.
iii. Promoting conservation efforts
Authorities should consider the inclusion of the whole village rather than focusing only on the fishermen in mangrove tour activities as being currently practised, through the promotion of local community’s participation in mangrove forest management.
iv. Setting the conservation fee
Finally, the WTP responses can be used as a predictor or indicator of future behaviour if the conservation or protection fee is initiated. Policymakers and forest managers might use the information to assess public support for conservation of the mangrove forest or as a measure of unwillingness and displeasure against the conservation to maintain its environmental quality. The monetization of the forest benefits in this study provides a useful insight into the allocation of the forest conservation and protection funds.
REFERENCES
Abdullah, K., Said, A. M., & Omar, D. (2014). Community-based Conservation in Managing Mangrove Rehabilitation in Perak and Selangor. Procedia - Social and Behavioral Sciences. https://doi.org/10.1016/j.sbspro.2014.10.047
Barbier, E. B. (2016). The protective service of mangrove ecosystems: A review of valuation methods. Marine Pollution Bulletin. https://doi.org/10.1016/j.marpolbul.2016.01.033
Kamri, T. (2014). Economic Values of Conservation and Management Attributes in Bako National Park, Sarawak, Malaysia (Doctoral dissertation, Universiti Putra Malaysia). Retrieved from http://psasir.upm.edu.my/id/eprint/39604/1/FEP 2014 14 IR.pdf
Kuenzer, C., & Tuan, V. Q. (2013). Assessing the ecosystem services value of can gio mangrove biosphere reserve: Combining earth-observation- and
household-survey-based analyses. Applied Geography.
https://doi.org/10.1016/j.apgeog.2013.08.012
Mukherjee, N., Sutherland, W. J., Dicks, L., Hugé, J., Koedam, N., & Dahdouh-Guebas, F. (2014). Ecosystem service valuations of mangrove ecosystems to inform decision making and future valuation exercises. PLoS ONE. https://doi.org/10.1371/journal.pone.0107706
Nagelkerken, I., De Schryver, A. M., Verweij, M. C., Dahdouh-Guebas, F., van der Velde, G., & Koedam, N. (2010). Differences in root architecture influence attraction of fishes to mangroves: A field experiment mimicking roots of different length, orientation, and complexity. Journal of Experimental Marine Biology and Ecology, 396(1), 27–34. https://doi.org/10.1016/j.jembe.2010.10.002
Samdin, Z. (2008). Willingness to pay in Taman Negara: A Contingent Valuation Method. International Journal of Economics and Management.
Vo, Q. T., Kuenzer, C., Vo, Q. M., Moder, F., & Oppelt, N. (2012). Review of valuation methods for mangrove ecosystem services. Ecological Indicators. https://doi.org/10.1016/j.ecolind.2012.04.022