MEF 41.0.1
© MEF Forum 2020. Any reproduction of this document, or any portion thereof, shall contain the following statement: "Reproduced with permission of MEF Forum." No user of this document is authorized to modify any of the information contained herein.
MEF Standard
MEF 41.0.1
Amendment to MEF 41: Clarification of Generic
Token Bucket Algorithm (GTBA) Behavior
MEF 41.0.1
© MEF Forum 2020. Any reproduction of this document, or any portion thereof, shall contain the following statement: "Reproduced with permission of MEF Forum." No user of this document is authorized to modify any of the information contained herein.
Disclaimer
© MEF Forum 2020. All Rights Reserved.
The information in this publication is freely available for reproduction and use by any recipient and is believed to be accurate as of its publication date. Such information is subject to change without notice and MEF Forum (MEF) is not responsible for any errors. MEF does not assume responsibility to update or correct any information in this publication. No representation or warranty, expressed or implied, is made by MEF concerning the completeness, accuracy, or applicability of any information contained herein and no liability of any kind shall be assumed by MEF as a result of reliance upon such information.
The information contained herein is intended to be used without modification by the recipient or user of this document. MEF is not responsible or liable for any modifications to this document made by any other party.
The receipt or any use of this document or its contents does not in any way create, by implication or otherwise:
a) any express or implied license or right to or under any patent, copyright, trademark or trade secret rights held or claimed by any MEF member which are or may be associated with the ideas, techniques, concepts or expressions contained herein; nor b) any warranty or representation that any MEF members will announce any product(s)
and/or service(s) related thereto, or if such announcements are made, that such announced product(s) and/or service(s) embody any or all of the ideas, technologies, or concepts contained herein; nor
c) any form of relationship between any MEF member and the recipient or user of this document.
Implementation or use of specific MEF standards, specifications, or recommendations will be voluntary, and no Member shall be obliged to implement them by virtue of participation in MEF Forum. MEF is a non-profit international organization to enable the development and worldwide adoption of agile, assured and orchestrated network services. MEF does not, expressly or otherwise, endorse or promote any specific products or services.
MEF 41.0.1
© MEF Forum 2020. Any reproduction of this document, or any portion thereof, shall contain the following statement: "Reproduced with permission of MEF Forum." No user of this document is authorized to modify any of the information contained herein.
Page iii
Table of Contents
1 List of Contributing Members ... 6
2 Abstract ... 7
3 Introduction ... 8
4 Changes to Section 3, Terminology and Acronyms ... 9
5 Changes to Section 8, Algorithm Parameters... 10
6 Changes to Section 9, Token Count Updating... 13
7 New Appendix B ... 16
MEF 41.0.1
© MEF Forum 2020. Any reproduction of this document, or any portion thereof, shall contain the following statement: "Reproduced with permission of MEF Forum." No user of this document is authorized to modify any of the information contained herein.
Page iv
List of Figures
Figure A1-1 Token Flows for TRF i ... 14
Figure A1-2 Token Request Sequence with a Burst Magnitude less than GTVi ... 18
Figure A1-3 Token Request Sequence with a Burst Magnitude greater than GTVi ... 18
Figure A1-4 GTBA Token Paths for Constant and Transient Bypass Examples ... 20
Figure A1-5 Transient Bypass Least Upper Bound Example ... 24
Figure A1-6 Transient Bypass Example Near Greatest Lower Bound ... 25
Figure A1-7 Example of the Rank n-1 Average Token Bypass Rate Bounds ... 28
Figure A1-8 Uncertainty in the Rank n-1 Average Token Bypass Rate ... 30
MEF 41.0.1
© MEF Forum 2020. Any reproduction of this document, or any portion thereof, shall contain the following statement: "Reproduced with permission of MEF Forum." No user of this document is authorized to modify any of the information contained herein.
Page v
List of Tables
Table A1-1 Constant Bypass Examples ... 21 Table A1-2 Transient Bypass Example ... 22
MEF 41.0.1
© MEF Forum 2020. Any reproduction of this document, or any portion thereof, shall contain the following statement: "Reproduced with permission of MEF Forum." No user of this document is authorized to modify any of the information contained herein.
Page 6
1
List of Contributing Members
The following members of the MEF participated in the development of this document and have requested to be included in this list.
AT&T Bell Canada Canoga Perkins CenturyLink Cisco
MEF 41.0.1
© MEF Forum 2020. Any reproduction of this document, or any portion thereof, shall contain the following statement: "Reproduced with permission of MEF Forum." No user of this document is authorized to modify any of the information contained herein.
Page 7
2
Abstract
This standard amends MEF 41 [1] to describe how differences in sequences of Token Requests can affect the application of the 𝐺𝑇𝑅 (and 𝑌𝑇𝑅 ) parameters in the Generic Token Bucket Algorithm, and how this affects the overall rate of tokens shared among Ranks and hence the overall rate of Token Requests declared Green (or Yellow) at each Rank.
MEF 41.0.1
© MEF Forum 2020. Any reproduction of this document, or any portion thereof, shall contain the following statement: "Reproduced with permission of MEF Forum." No user of this document is authorized to modify any of the information contained herein.
Page 8
3
Introduction
When the Generic Token Bucket Algorithm (GTBA) is applied by Ingress or Egress Bandwidth Profiles in a Carrier Ethernet Service, one might expect that when the average rate of traffic arrival for a set of several frames at one Rank in an envelope is less than the committed ( G een ) a e fo ha Rank, all of the frames in the set would be declared Green. Depending on frame arrival intervals, however, the amount of traffic declared Green can be less due to the application of the 𝐶𝐵𝑆 (𝐺𝑇𝑉 parameter. Furthermore one might expect that when 𝐶𝐹 0 and the rate of traffic arriving at one Rank in an envelope is less than the committed ( G een ) rate for that Rank, then the difference between the two rates would be shared to the next lower Rank in the envelope, up to the limit imposed by the 𝐶𝐼𝑅 (𝐺𝑇𝑅 ) parameter. Depending on frame arrival intervals, however, the rate shared to the lower Rank may be less than this intuitive expectation.
This amendment to MEF 41 [1] describes these behaviors in order to set expectations to match actual Token Request color declaration rates, and provides informative text to describe:
how differences in Token Request arrival intervals can affect the application of the 𝐺𝑇𝑅 (and 𝑌𝑇𝑅 ) parameters in the Generic Token Bucket Algorithm,
how this affects the overall rate of tokens shared from one Rank to other Ranks, and how bucket sizes and other factors might affect the behavior of the algorithm.
This information includes equations to provide upper bound and lower bound on the rate of tokens shared.
The equations in Section 6 (MEF 41 Section 9) are modified to separate tokens that Bypass the token bucket (due to the limits imposed by 𝐺𝑇𝑅 and 𝑌𝑇𝑅 ) from tokens that Overflow the token bucket (due to the limits imposed by 𝐺𝑇𝑉 and 𝑌𝑇𝑉 ). The sum of the tokens that Bypass or Overflow the token bucket is equal to what is con ide ed Overflow in MEF 41. This represents a change in the description of the GTBA, but not a change in the behavior. In particular, for any Token Request Flow (TRF) there is no change to the number of tokens added to a token bucket, converted from the Green token bucket to the Yellow token bucket, or shared to another Rank.
In this amendment, changes are shown as follows:
Instructions for how to apply the amendment are shown in blue italics
In MEF 41 sections being modified, text to be removed is shown with red strikethrough In MEF 41 sections being modified, text to be added is shown in red
MEF 41.0.1
© MEF Forum 2020. Any reproduction of this document, or any portion thereof, shall contain the following statement: "Reproduced with permission of MEF Forum." No user of this document is authorized to modify any of the information contained herein.
Page 9
4
Changes to Section 3, Terminology and Acronyms
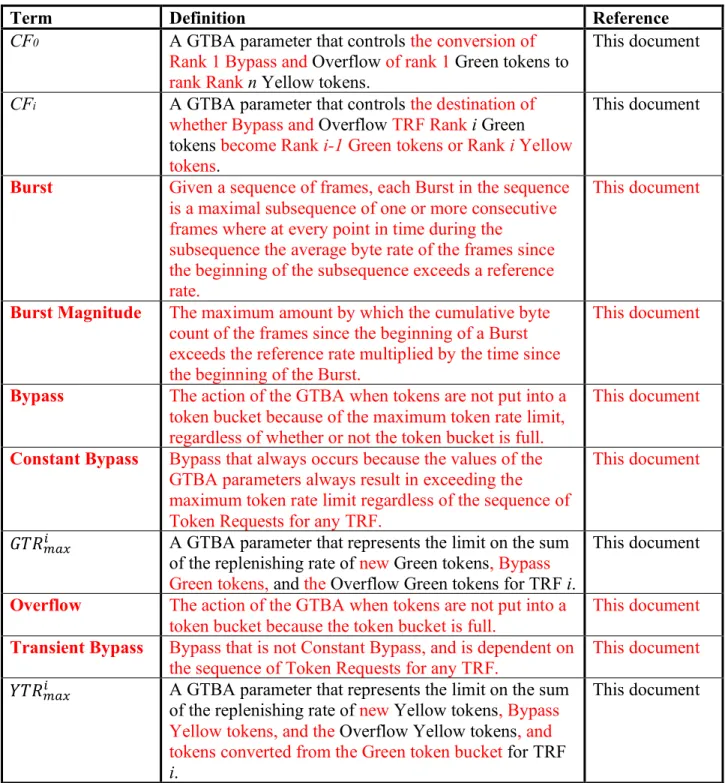
The following terms in Table 1 are changed as shown:
Term Definition Reference
CF0 A GTBA parameter that controls the conversion of Rank 1 Bypass and Overflow of rank 1 Green tokens to rank Rank n Yellow tokens.
This document CFi A GTBA parameter that controls the destination of
whether Bypass and Overflow TRF Rank i Green tokens become Rank i-1 Green tokens or Rank i Yellow tokens.
This document
Burst Given a sequence of frames, each Burst in the sequence
is a maximal subsequence of one or more consecutive frames where at every point in time during the
subsequence the average byte rate of the frames since the beginning of the subsequence exceeds a reference rate.
This document
Burst Magnitude The maximum amount by which the cumulative byte
count of the frames since the beginning of a Burst exceeds the reference rate multiplied by the time since the beginning of the Burst.
This document
Bypass The action of the GTBA when tokens are not put into a
token bucket because of the maximum token rate limit, regardless of whether or not the token bucket is full.
This document
Constant Bypass Bypass that always occurs because the values of the
GTBA parameters always result in exceeding the maximum token rate limit regardless of the sequence of Token Requests for any TRF.
This document
𝐺𝑇𝑅 A GTBA parameter that represents the limit on the sum of the replenishing rate of new Green tokens, Bypass Green tokens, and the Overflow Green tokens for TRF i.
This document
Overflow The action of the GTBA when tokens are not put into a
token bucket because the token bucket is full.
This document
Transient Bypass Bypass that is not Constant Bypass, and is dependent on
the sequence of Token Requests for any TRF.
This document 𝑌𝑇𝑅 A GTBA parameter that represents the limit on the sum
of the replenishing rate of new Yellow tokens, Bypass Yellow tokens, and the Overflow Yellow tokens, and tokens converted from the Green token bucket for TRF i.
This document
MEF 41.0.1
© MEF Forum 2020. Any reproduction of this document, or any portion thereof, shall contain the following statement: "Reproduced with permission of MEF Forum." No user of this document is authorized to modify any of the information contained herein.
Page 10
5
Changes to Section 8, Algorithm Parameters
Modify section 8 as follows:
8 Algorithm Parameters
There are two kinds of parameters that control the behavior of GTBA: General Parameters and TRF Parameters as described below.
8.1 General Parameters
There are two General Parameters:
𝑛 a positive integer representing the number of TRFs and
𝐶𝐹0 can be 0 or 1 and controls the conversion of Bypass and Overflow of Rank 1 Green tokens to Rank 𝑛 Yellow tokens.1
[R1] Values of 𝑛 and 𝐶𝐹0 MUST be specified for each instance of a GTBA. [R2] When 𝑛 1, 𝐶𝐹0 MUST have the value of 0.
8.2 TRF Parameters
Let the 𝑛 TRFs be ranked 𝑖 1,2, … , 𝑛 where 𝑛 is the highest Rank. Then for each 𝑖 ∈
1,2, … , 𝑛 , there are the following TRF Parameters:
𝐺𝑇𝑅 a non-negative number in units of tokens per unit time that represents the replenishing rate of new Green tokens for TRF 𝑖,
𝐺𝑇𝑅 a non-negative number in units of tokens per unit time that represents the limit on the sum of the replenishing rates of new Green tokens, Bypass Green tokens, and Overflow Green tokens for TRF 𝑖,
𝐺𝑇𝑉 a non-negative number in units of tokens that represents the upper limit on the Green token bucket count for TRF 𝑖,
𝑌𝑇𝑅 a non-negative number in units of tokens per unit time that represents the replenishing rate of new Yellow tokens for TRF 𝑖,
𝑌𝑇𝑅 a non-negative number in units of tokens per unit time that represents the limit on the sum of the replenishing rates of new Yellow tokens, Bypass Yellow tokens, Overflow Yellow tokens, and tokens converted from the Green token bucket for TRF 𝑖, 𝑌𝑇𝑉 a non-negative number in units of tokens that represents the upper limit on the Yellow token bucket count for TRF 𝑖, and
𝐶𝐹 can be 0 or 1 and controls the destination of whether Bypass and Overflow TRF Rank 𝑖 Green tokens become Rank i-1 Green tokens or Rank i Yellow tokens.
[R3] If 𝐶𝐹0 1, then 𝐶𝐹 MUST equal 0 for 𝑖 1,2, … , 𝑛.
MEF 41.0.1
© MEF Forum 2020. Any reproduction of this document, or any portion thereof, shall contain the following statement: "Reproduced with permission of MEF Forum." No user of this document is authorized to modify any of the information contained herein.
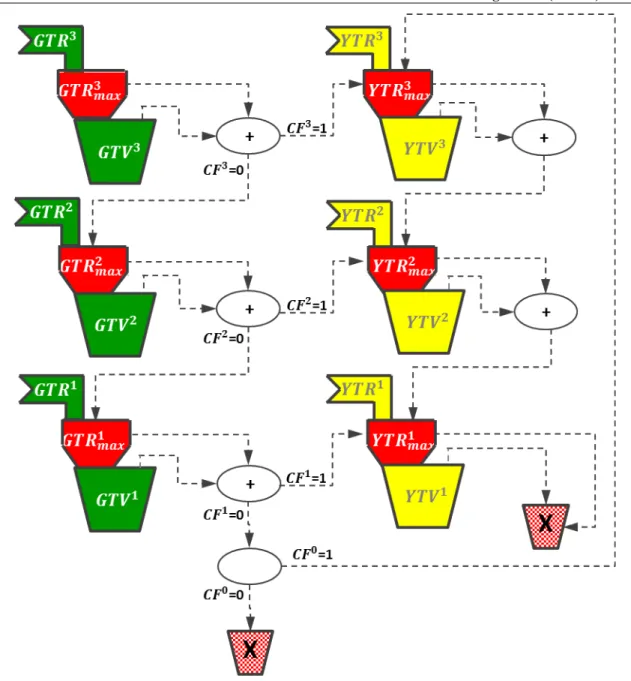
Page 11 Figure 3 shows a conceptual diagram of the token flows with three TRFs.
The solid arrows green and yellow flag-shaped icons labeled 𝐺𝑇𝑅 or 𝑌𝑇𝑅 represent a token source flowing into each token bucket new token sources for the TRF.
The red funnel-shaped icons labeled 𝐺𝑇𝑅 and 𝑌𝑇𝑅 represent the limits on how fast tokens can be added to each token bucket.
The green and yellow trapezoids trapezoid icons labeled 𝐺𝑇𝑉 and 𝑌𝑇𝑉 represent the Green and Yellow token bucket for each TRF.
The dashed arrows show where possible token paths. An arrow that originates at a funnel represents tokens that Bypass the token bucket due to 𝐺𝑇𝑅 and 𝑌𝑇𝑅 . An arrow that originates at a trapezoid represents tokens that Overflow each the token bucket go when the number of tokens in the token bucket reaches the capacity (𝐺𝑇𝑉 or 𝑌𝑇𝑉 ). The circles ellipses represent summation points and/or decision points in the token path. Ellip e i h o inp a o and a + mbol m he oken a i ing on he o paths. Ellipses with two exit arrows represent a decision point controlled by the Coupling Flag (𝐶𝐹 ).
The X ep e en poin a hich oken a e di ca ded (i.e., no added to any of the token buckets).
𝐺𝑇𝑅 and 𝑌𝑇𝑅 are not shown on the figure.
MEF 41.0.1
© MEF Forum 2020. Any reproduction of this document, or any portion thereof, shall contain the following statement: "Reproduced with permission of MEF Forum." No user of this document is authorized to modify any of the information contained herein.
Page 12 Figure 3 – Generic Token Bucket Algorithm Token Flows
MEF 41.0.1
© MEF Forum 2020. Any reproduction of this document, or any portion thereof, shall contain the following statement: "Reproduced with permission of MEF Forum." No user of this document is authorized to modify any of the information contained herein.
Page 13
6
Changes to Section 9, Token Count Updating
Modify section 9 as follows:
9 Token Count Updating
This Section specifies how the token bucket counts for each TRF are calculated. The token bucket counts for all TRFs are updated in response to each Token Request for any TRF. The times 𝑡 and 𝑡 represent the time of occurrence of consecutive Token Requests, regardless of the Rank of those Token Requests.
𝐶 𝑡 represents the Green token bucket count at time 𝑡 for TRF 𝑖, 𝑖 1,2, … , 𝑛 and 𝐶 𝑡 represents the Yellow token bucket count at time 𝑡 for TRF 𝑖, 𝑖 1,2, … , 𝑛.
𝑇 𝑡 , 𝑡 and 𝑇 𝑡 , 𝑡 represent the total maximum number of tokens available that might be
added to the Green and Yellow token buckets bucket counts, respectively, for TRF 𝑖 over the time interval 𝑡 to 𝑡 , for 𝑖 1,2, … , 𝑛.
𝐵 𝑡 , 𝑡 and 𝐵 𝑡 , 𝑡 represent the number of tokens that Bypass the Green and Yellow token
buckets, respectively, for TRF 𝑖 over the time interval 𝑡 to 𝑡 , for 𝑖 1,2, … , 𝑛 due to the limits imposed by 𝐺𝑇𝑅 and 𝑌𝑇𝑅 . Some of the effects of the maximum rate limits are discussed in Appendix B.2.
𝐴 𝑡 , 𝑡 and 𝐴 𝑡 , 𝑡 represent the number of tokens actually added to the Green and Yellow
token bucket counts, respectively, for TRF 𝑖 over the time interval 𝑡 to 𝑡 , for 𝑖 1,2, … , 𝑛.
𝑂 𝑡 , 𝑡 and 𝑂 𝑡 , 𝑡 represent the number of tokens that Overflow the Green and Yellow
token buckets, respectively, for TRF 𝑖 over the time interval 𝑡 to 𝑡 , for 𝑖 1,2, … , 𝑛. Tokens are said to Overflow when they cannot the number of tokens to be added to a token bucket count without causing would cause the count to exceed the upper limit imposed by 𝐺𝑇𝑉 and 𝑌𝑇𝑉 on the token bucket count. Some of the effects of the maximum token bucket count are discussed in Appendix B.1.
𝑅 𝑡 , 𝑡 represents the number of Green tokens that are converted by converting them to
Yellow and making them available to the Yellow token bucket of TRF 𝑖 over the time interval 𝑡 to 𝑡 for 𝑖 1,2, … , 𝑛.
𝑆 𝑡 , 𝑡 and 𝑆 𝑡 , 𝑡 represent the number of tokens available to be shared to the Green and
Yellow token buckets bucket counts of TRF 𝑖 1, respectively, from TRF 𝑖 over the time interval 𝑡 to 𝑡 for 𝑖 2, … , 𝑛, 𝑛 1.
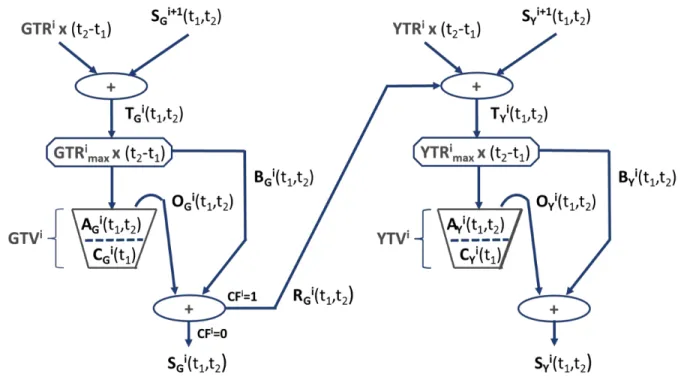
Figure A1-1 shows a detailed diagram of the token flows for a TRF 𝑖 with each of the above values labeled in the diagram.
MEF 41.0.1
© MEF Forum 2020. Any reproduction of this document, or any portion thereof, shall contain the following statement: "Reproduced with permission of MEF Forum." No user of this document is authorized to modify any of the information contained herein.
Page 14
Figure A1-1 – Token Flows for TRF i
The total maximum number of tokens available to the that might be added to Green token bucket count, 𝑇 𝑡 , 𝑡 , includes Green tokens sourced at the rate 𝐺𝑇𝑅 over the time interval and any Green tokens shared from the next higher Rank TRF. The total maximum number of tokens available that might be added to the Yellow token bucket count, 𝑇 𝑡 , 𝑡 , includes Yellow tokens sourced at the rate 𝑌𝑇𝑅 over the time interval, any Yellow tokens shared from the higher Rank TRF, and any overflow Green tokens from tokens that Overflow or Bypass the Green token bucket that are allowed and are converted to the Yellow token bucket by 𝐶𝐹 (𝑅 𝑡 , 𝑡 ). Note that for the Green token bucket count, TRF 𝑛 has no tokens shared from a higher Rank since there are no TRFs with a Rank higher than 𝑛. Therefore 𝑆 𝑡 , 𝑡 0. Similarly, for the Yellow token bucket count, there are TRF 𝑛 has no tokens shared from a Rank higher than 𝑛 since there are no TRFs with a Rank higher than 𝑛, however, depending on 𝐶𝐹0, there may be tokens converted from shared from the overflow of the Green token bucket at Rank 1. Therefore
𝑆 𝑡 , 𝑡 𝐶𝐹0 𝐵 𝑡 , 𝑡 𝑂 𝑡 , 𝑡 . The following equations capture the above
descriptions:
𝑇 𝑡 , 𝑡 𝐺𝑇𝑅 𝑡 𝑡 𝑆 𝑡 , 𝑡 for 𝑖 1,2, … , 𝑛
𝑇 𝑡 , 𝑡 𝑌𝑇𝑅 𝑡 𝑡 𝑆 𝑡 , 𝑡 𝑅 𝑡 , 𝑡 𝐶𝐹 𝑂 𝑡 , 𝑡 for 𝑖 1,2, … , 𝑛
Note that [R3] mandates that 𝐶𝐹 0 if 𝐶𝐹0 1 in the equation for 𝑇 𝑡 , 𝑡 and thus
𝑇 𝑡 , 𝑡 𝑌𝑇𝑅 𝑡 𝑡 𝐶𝐹 𝑂 𝑡 , 𝑡 , if 𝐶𝐹
0 0
MEF 41.0.1
© MEF Forum 2020. Any reproduction of this document, or any portion thereof, shall contain the following statement: "Reproduced with permission of MEF Forum." No user of this document is authorized to modify any of the information contained herein.
Page 15 The number of tokens that Bypass the token bucket is the number of tokens that exceed the maximum rate at which tokens are allowed to be added (𝐺𝑇𝑅 and 𝑌𝑇𝑅 ) over the interval.
𝐵 𝑡 , 𝑡 max 0, 𝑇 𝑡 , 𝑡 𝐺𝑇𝑅 𝑡 𝑡 for 𝑖 1,2, … , 𝑛
𝐵 𝑡 , 𝑡 max 0, 𝑇 𝑡 , 𝑡 𝑌𝑇𝑅 𝑡 𝑡 for 𝑖 1,2, … , 𝑛
The number of tokens actually added to a token bucket count is some or all of the tokens that do not Bypass the token bucket available to be added, limited by 𝐺𝑇𝑉 and 𝑌𝑇𝑉 and by the maximum rate at which tokens are allowed to be added (𝐺𝑇𝑅 and 𝑌𝑇𝑅 ).
𝐴 𝑡 , 𝑡 min 𝑇 𝑡 , 𝑡 𝐵 𝑡 , 𝑡 , 𝐺𝑇𝑉 𝐶 𝑡 , 𝐺𝑇𝑅 𝑡 𝑡 for 𝑖
1,2, … , 𝑛
𝐴 𝑡 , 𝑡 min 𝑇 𝑡 , 𝑡 𝐵 𝑡 , 𝑡 , 𝑌𝑇𝑉 𝐶 𝑡 , 𝑌𝑇𝑅 𝑡 𝑡 for 𝑖
1,2, … , 𝑛
The number of tokens that Overflow each token bucket is the number of available tokens that are not actually added to the token bucket count.
𝑂 𝑡 , 𝑡 𝑇 𝑡 , 𝑡 𝐵 𝑡 , 𝑡 𝐴 𝑡 , 𝑡 for 𝑖 1,2, … , 𝑛
𝑂 𝑡 , 𝑡 𝑇 𝑡 , 𝑡 𝐵 𝑡 , 𝑡 𝐴 𝑡 , 𝑡 for 𝑖 1,2, … , 𝑛
The number of tokens that are converted to Yellow tokens is the number of tokens that Bypass plus the number of tokens that Overflow the Green token bucket when the Coupling Flag is set (𝐶𝐹 = 1).
𝑅 𝑡 , 𝑡 𝐶𝐹 𝐵 𝑡 , 𝑡 𝑂 𝑡 , 𝑡 for 𝑖 1,2, … , 𝑛.
The number of tokens available to be shared from TRF 𝑖 to the next lower Rank, TRF 𝑖 1, is the number of tokens that Bypass or Overflow the Green and Yellow token buckets and, in the case of the Green token bucket count, are not made available converted to the Yellow token bucket count by 𝐶𝐹 .
𝑆 𝑡 , 𝑡 1 𝐶𝐹 𝐵 𝑡 , 𝑡 𝑂 𝑡 , 𝑡 for 𝑖 2,3, … , 𝑛.
MEF 41.0.1
© MEF Forum 2020. Any reproduction of this document, or any portion thereof, shall contain the following statement: "Reproduced with permission of MEF Forum." No user of this document is authorized to modify any of the information contained herein.
Page 16
7
New Appendix B
Insert the content below into the document as Appendix B.
Appendix B
Examples of GTBA Behavior (Informative)
This Appendix describes the behaviors of the GTBA resulting from the values of 𝐺𝑇𝑉 and 𝐺𝑇𝑅 . Appendix B.1 defines Burst, Burst Size, Burst Length and Burst Magnitude for a set of frames and demonstrates how two sequences of frames with the same average byte rate can have different color declarations when each frame length and arrival time is considered a Token Request for the GTBA. Appendix B.2 demonstrates how the value of 𝐺𝑇𝑅 can impact the use of tokens shared from Rank i+1 by the TRF at Rank i.
B.1 GTVi and Burst Detection
T affic in a ne o k end o be b , meaning ha he f ame a e picall no e enly spaced. Traffic that is excessively bursty is problematic because it can lead to frames being discarded unless there are large buffers within the network, which in turn makes it difficult to control the delay and delay variation of the transmission of frames through the network. Con olling he b ine of he affic e i e a pecific defini ion of a b , a quantitative measurement of the burstiness of the traffic, and a way to detect when the burstiness exceeds a specified limit. The GTBA provides a parameter (𝐺𝑇𝑉 ) for setting a limit on the acceptable burstiness, and a mechanism to detect when that limit is exceeded.
Intuitively, a burst within a network is a group of frames that are closer together in time than expected, or allowed, or desired, or simply closer together in time than other frames. This is obviously too general of a definition to lead to any quantitative measurement of burstiness. A more precise definition can be provided by a comparison to a reference rate, where the reference rate can be the long term average of the byte rate of the flow, or a predetermined target rate. Then the general definition becomes a sequence of frames where the byte rate of the frames exceeds the reference rate. A more precise definition is that, given a sequence of frames, each Burst in the sequence is a maximal subsequence of one or more frames where at every point in time during the Burst the average byte rate of the frames since the beginning of the subsequence exceeds the reference rate. The procedure for finding each maximal subsequence that comprises a Burst in a sequence of frames is:
1. The first frame in the sequence is always the start of a Burst.
2. For each subsequent frame, if the total byte count of all frames since the start of the current Burst (but not including this frame) is greater than the reference rate multiplied by the time since the start of the current Burst, then this frame is part of the current Burst; otherwise, it is the start of a new Burst.
MEF 41.0.1
© MEF Forum 2020. Any reproduction of this document, or any portion thereof, shall contain the following statement: "Reproduced with permission of MEF Forum." No user of this document is authorized to modify any of the information contained herein.
Page 17 Given this definition of a Burst, there are several properties of the Burst that can be measured. Three examples are:
Burst Size: The sum of the byte counts of the frames in the Burst.
Burst Length: The duration of the time interval from the arrival time of the first frame of the Burst to the first point in time where the cumulative byte count of the frames divided by the duration equals the reference rate.
Burst Magnitude: The maximum amount by which the cumulative byte count of the frames since the beginning of the Burst exceeds the reference rate multiplied by the time since the beginning of the Burst.
While all three of these capture interesting characteristics of the Burst, only the Burst Magnitude reacts to the relative timing of the frames within the Burst. Furthermore, the Burst Magnitude is the characteristic that directly affects the amount of buffering required within a network to accommodate the sequence of frames, and the delay and delay variation experienced by the frames within the network.
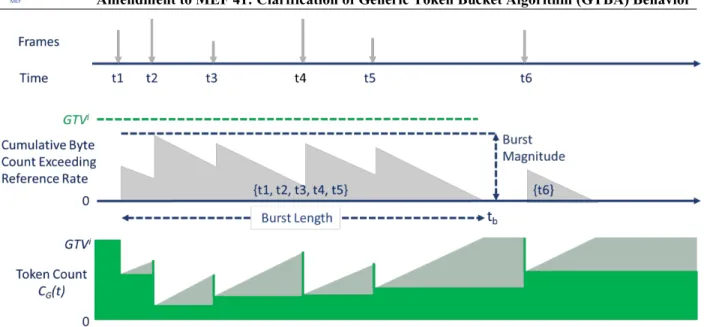
A Burst can be represented graphically by a plot of the difference between the cumulative byte count of the frames and the reference rate over time. An example of this is shown in Figure A1-2. The top portion of the figure depicts the sequence of frames in time where the length of the arrows represent the number of bytes in the frame. The sequence shown forms two Bursts, the first consisting of the first five frames (at times t1, t2, t3, t4, and t5) and the second consisting of the single frame at time t6. The middle portion of the figure depicts the cumulative byte count exceeding the reference rate. The downward slope of the gray shading is the negative of the reference rate. The time of the end of the first burst is designated as tb. The bottom portion of the
figure puts this in the context of a GTBA by depicting the response of the GTBA when each frame generates a Green Token Request equal to the number of bytes in the frame and the reference rate is the rate at which tokens are added to the Green token bucket. The dark green shading represents the number of tokens in the bucket over time, while the light green shading represents the number of tokens that would be in the bucket if the token count was continuously updated rather than only updated in response to a Token Request. In this example all Token Requests are declared Green because the Burst Magnitude of the sequence of frames never exceeds 𝐺𝑇𝑉 .
MEF 41.0.1
© MEF Forum 2020. Any reproduction of this document, or any portion thereof, shall contain the following statement: "Reproduced with permission of MEF Forum." No user of this document is authorized to modify any of the information contained herein.
Page 18 Figure A1-2 – Token Request Sequence with a Burst Magnitude less than GTVi
Figure A1-3 modifies the sequence of frames by moving the fourth frame earlier in time (from t4 o 4 ). This increases the Burst Magnitude of the sequence of frames such that it is larger than 𝐺𝑇𝑉 . When Burst Magnitude of the sequence of frames exceeds 𝐺𝑇𝑉 , the GTBA cannot declare all of the Token Requests generated by the frames Green without the token count dropping below zero, so the GTBA responds by declaring one or more Token Requests a different color (Yellow or Red). In this example the Token Request generated by the frame a 4 is declared Red, shown in the figure by the dashed red line that would drop the token count below zero.
Figure A1-3 – Token Request Sequence with a Burst Magnitude greater than GTVi
The sequence of frames from t1 to t5 in both Figure A1-2 and Figure A1-3 have the same Burst Size and Burst Length. Therefore the byte rate of both sequences equals the reference rate at the same point in time (tb). Yet in one case all Token Requests generated by the frames are declared
MEF 41.0.1
© MEF Forum 2020. Any reproduction of this document, or any portion thereof, shall contain the following statement: "Reproduced with permission of MEF Forum." No user of this document is authorized to modify any of the information contained herein.
Page 19 Green and in the other case one of the Token Requests is declared Yellow or Red. The difference is that in Figure A1-3 the first four frames are closer together in time, to the point that the Burst Magnitude exceeds the limit set by 𝐺𝑇𝑉 . Declaring the Token Request generated by the frame a 4 in Figure 3 Red, but not the Token Request generated by the frame at t4 in Figure A1-2, is an example that shows the GTBA can detect that the Burst Magnitude of a sequence of frames exceeds a desired limit (𝐺𝑇𝑉 ), even when the average byte rate of the frames does not exceed the reference rate (𝐺𝑇𝑅 ).
These examples have assumed that the reference rate used to delineate a Burst is a constant equal to the number of tokens sourced at a given Rank by the GTBA (𝐺𝑇𝑅 ). With token sharing the rate of tokens added to the token bucket is not necessarily constant, however it is bounded between a lower bound equal to the minimum of 𝐺𝑇𝑅 and 𝐺𝑇𝑅 , and an upper bound equal to 𝐺𝑇𝑅 . In this case two statements can be made about the relationship between a Burst Magnitude and the GTBA. First, when using the minimum of 𝐺𝑇𝑅 and 𝐺𝑇𝑅 as a reference rate to delineate a Burst, and the resulting Burst Magnitude is less than 𝐺𝑇𝑉 , all Token Requests generated by the frames within the Burst will be declared Green. Second, when using 𝐺𝑇𝑅 as a reference rate to delineate a Burst, and the resulting Burst Magnitude exceeds 𝐺𝑇𝑉 , one or more Token Requests generated by the frames in the Burst will not be declared Green. Analogous statements can be made regarding the actions of the Yellow token bucket in the GTBA, where the Token Requests being considered includes all Yellow Token Requests and all Green Token Requests that were not declared Green. In this case the rate of tokens added to the Yellow token bucket can include tokens from a Yellow token source at that Rank, tokens shared from another Rank, or Green tokens converted to Yellow at the same Rank.
B.2 GTRimax and Token Bypass
The maximum token rate parameters (𝐺𝑇𝑅 and 𝑌𝑇𝑅 ) divide the total tokens available at a Rank into tokens that are added to the token bucket (or Overflow if the bucket is full), and tokens that Bypass the token bucket at that Rank (regardless of whether the token bucket is full or not). This section discusses how the maximum token rate parameters affect the algorithm behavior under two different circumstances. The first occurs when tokens Bypass the token bucket purely as a result of the GTBA parameter values, regardless of the sequence of Token Requests. The rate of this type of Bypass does not vary between consecutive Token Requests, and is therefore referred to as Constant Bypass. The other occurs when tokens Bypass the token bucket as a result of a specific sequence of Token Requests. The rate of this type of Bypass can vary considerably between consecutive Token Requests, and is therefore referred to as Transient Bypass. These two types of Bypass are discussed separately in the following sections. The examples in each section assume the token flows shown in Figure A1-4.
MEF 41.0.1
© MEF Forum 2020. Any reproduction of this document, or any portion thereof, shall contain the following statement: "Reproduced with permission of MEF Forum." No user of this document is authorized to modify any of the information contained herein.
Page 20 Figure A1-4 – GTBA Token Paths for Constant and Transient Bypass Examples
B.2.1 Constant Bypass Example
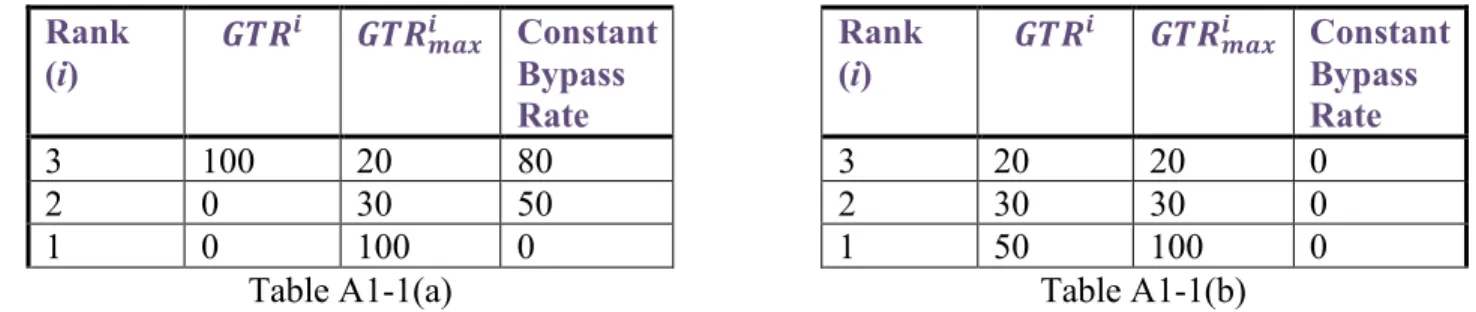
For Green token buckets, Constant Bypass occurs at a given Rank when the combination of the new token rate at that Rank (𝐺𝑇𝑅 ) plus the Constant Bypass Rate from a higher Rank (if any) exceeds the maximum token rate at that Rank (𝐺𝑇𝑅 ). This is exemplified in the tables of GTBA parameter values shown in Table A1-1. (All rates are in units of tokens per second.)
MEF 41.0.1
© MEF Forum 2020. Any reproduction of this document, or any portion thereof, shall contain the following statement: "Reproduced with permission of MEF Forum." No user of this document is authorized to modify any of the information contained herein.
Page 21
Rank
(i) 𝑮𝑻𝑹
𝒊 𝑮𝑻𝑹 𝒎𝒂𝒙
𝒊 Constant
Bypass Rate
Rank
(i) 𝑮𝑻𝑹
𝒊 𝑮𝑻𝑹 𝒎𝒂𝒙
𝒊 Constant
Bypass Rate
3 100 20 80 3 20 20 0
2 0 30 50 2 30 30 0
1 0 100 0 1 50 100 0
Table A1-1(a) Table A1-1(b)
Table A1-1 – Constant Bypass Examples
In Table A1-1(a) the 𝐺𝑇𝑅 of the highest Rank exceeds 𝐺𝑇𝑅 , resulting in a Constant Bypass rate at Rank 3 of 80. These tokens are shared to Rank 2, where they exceed the 𝐺𝑇𝑅 of Rank 2, resulting in a Constant Bypass rate of 50. These tokens are shared to Rank 1.
For Yellow token buckets, Constant Bypass occurs when the maximum token rate at that Rank (𝑌𝑇𝑅 ) is exceeded by the combination of the new token rate at that Rank ( 𝑌𝑇𝑅 ), plus any Constant Bypass from the Green token bucket at the same Rank converted to Yellow (if 𝐶𝐹 1), plus any Constant Bypass from the Yellow token bucket at a higher Rank (or, in the case of Rank n, any Constant Bypass from the Rank 1 Green token bucket converted to Yellow by
𝐶𝐹0 1).
In general, the Constant Bypass Rate for the Green and Yellow token buckets for Rank 𝑖, 𝐶𝐵𝑅 and 𝐶𝐵𝑅 respectively, can be calculated using the following equations:
𝐶𝐵𝑅 max 0, 𝐺𝑇𝑅 1 𝐶𝐹 𝐶𝐵𝑅 𝐺𝑇𝑅 for 𝑖 1,2, … , 𝑛
where 𝐶𝐵𝑅 0 and 𝐶𝐹 0.
𝐶𝐵𝑅 max 0, 𝑌𝑇𝑅 𝐶𝐵𝑅 𝐶𝐹 𝐶𝐵𝑅 𝑌𝑇𝑅 for 𝑖 1,2, … , 𝑛
where 𝐶𝐵𝑅 1 𝐶𝐹0 𝐶𝐵𝑅 .
Two instances of the GTBA are said to have identical color declaration behavior when any sequence of Token Requests yields identical color declarations when presented to each GTBA instance. The GTBA instance in Table A1-1(b) has identical color declaration behavior as that in Table A1-1(a), but has the token sources adjusted so that all Ranks have a Constant Bypass Rate equal to zero and 𝐺𝑇𝑅 greater than or equal to 𝐺𝑇𝑅 . There can be many GTBA instances that have identical color declaration behavior, but only one of those will have zero Constant Bypass Rates at all Ranks. Thi i efe ed o a he no mali ed GTBA in ance. Working with the normalized GTBA instance is useful for analyzing Transient Bypass, and will be used extensively in the Section B.2.2.3. It is possible to transform any instance of the GTBA that has a non-zero Constant Bypass Rate at one or more Ranks to the normalized instance of the GTBA that has the same color declaration behavior but has a Constant Bypass Rate of zero at all Ranks. This is done by changing the value of the token source rates 𝐺𝑇𝑅 and 𝑌𝑇𝑅 to the normalized token source rate values 𝐺𝑇𝑅 and 𝑌𝑇𝑅 , respectively, for 𝑖 1,2, … , 𝑛 where:
MEF 41.0.1
© MEF Forum 2020. Any reproduction of this document, or any portion thereof, shall contain the following statement: "Reproduced with permission of MEF Forum." No user of this document is authorized to modify any of the information contained herein.
Page 22
𝐺𝑇𝑅 𝑚𝑖𝑛 𝐺𝑇𝑅 1 𝐶𝐹 𝐶𝐵𝑅 , 𝐺𝑇𝑅 ,
𝑌𝑇𝑅 𝑚𝑖𝑛 𝑌𝑇𝑅 𝐶𝐵𝑅 𝐶𝐹 𝐶𝐵𝑅 , 𝑌𝑇𝑅 .
B.2.2 Transient Bypass Example
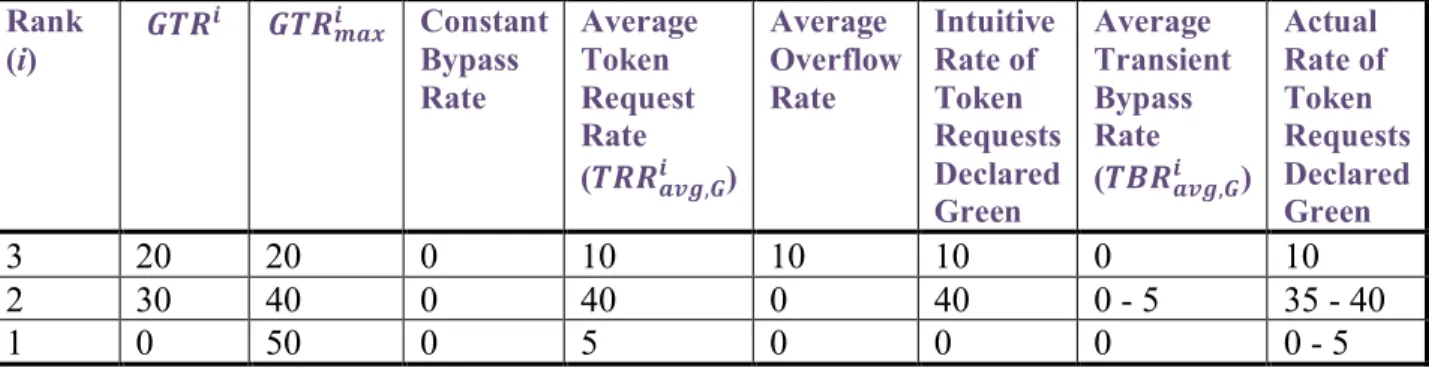
Transient Bypass is a more subtle effect of 𝐺𝑇𝑅 than Constant Bypass, because it depends not just on the GTBA parameter values but also on the Token Requests. Table A1-2 shows example GTBA parameter values and average Token Request rates, 𝑇𝑅𝑅 , , at each Rank. It is assumed in the discussion of these examples that the Token Requests at each Rank can be bursty, but that the 𝐺𝑇𝑉 values are sufficiently large that no Token Requests would fail to be declared Green if there were no Transient Bypass. This table will be used to demonstrate the effect of Transient Bypass on the average rate of Token Requests declared Green at Ranks 2 and 3.
Rank
(i) 𝑮𝑻𝑹
𝒊 𝑮𝑻𝑹 𝒎𝒂𝒙
𝒊 Constant
Bypass Rate Average Token Request Rate (𝑻𝑹𝑹𝒂𝒗𝒈,𝑮𝒊 )
Average Overflow Rate Intuitive Rate of Token Requests Declared Green Average Transient Bypass Rate (𝑻𝑩𝑹𝒂𝒗𝒈,𝑮𝒊 )
Actual Rate of Token Requests Declared Green
3 20 20 0 10 10 10 0 10
2 30 40 0 40 0 40 0 - 5 35 - 40
1 0 50 0 5 0 0 0 0 - 5
Table A1-2 – Transient Bypass Example
In this example the average rate of Token Requests at Rank 3 is 10 tokens per second, and both 𝐺𝑇𝑅 and 𝐺𝑇𝑅 are 20 tokens per second. Therefore the average Overflow rate is also 10 tokens per second.
The average rate of Token Requests at Rank 2 is 40 tokens per second. It might appear that with an average Overflow rate from Rank 3 of 10 tokens per second, a 𝐺𝑇𝑅 of 30 tokens per second, and a 𝐺𝑇𝑅 of 40 tokens per second, all Token Requests at Rank 2 would be declared Green, leaving no tokens to Overflow to Rank 1. With no Overflow or Constant Bypass from Rank 2 to Rank 1, and 𝐺𝑇𝑅 equal zero, the rate of Token Requests declared Green at Rank 1 would be zero. This is shown in the col mn labeled In i i e Ra e of Token Requests Declared Green . However, this intuition is based on the average Overflow rate from Rank 3 to Rank 2. On any given interval between Token Requests, the actual Overflow from Rank 3 could be higher or lower than the average. When it is higher it can exceed the value of 𝐺𝑇𝑅 , resulting in some tokens that Bypass the token bucket at Rank 2. This is Transient Bypass. The effect of Transient Bypass is that not all of the Token Requests at Rank 2 will be declared Green, and some Token Requests at Rank 1 can be declared Green.
Given a sequence of Token Requests, the average Transient Bypass rate at each Rank can be calculated by summing the number of Transient Bypass tokens calculated for that Rank at each token count update (i.e. at each Token Request), and dividing by the duration of the sequence. The average Transient Bypass rate for Rank 2 in Table A1-2 is shown as a range of values from
MEF 41.0.1
© MEF Forum 2020. Any reproduction of this document, or any portion thereof, shall contain the following statement: "Reproduced with permission of MEF Forum." No user of this document is authorized to modify any of the information contained herein.
Page 23 0 to 5. This is because even when all the GTBA Parameters and all the average Token Request rates are fixed, different sequences of Token Requests can result in different average Transient Bypass rates. The remainder of this section focuses on determining the bounds on the average Transient Bypass rate as a function of the GTBA Parameters and the average Token Request rates.
Section B.2.2.1 describes a specific sequence of Token Requests that results in the highest possible average Transient Bypass rate (i.e. the least upper bound) at Rank 2 given the GTBA Parameter and average Token Request rate values in Table A1-2. Section B.2.2.2 describes a specific sequence of Token Requests that results in a lower value for the average Transient Bypass rate at Rank 2, and extrapolates this to the lowest possible average Transient Bypass rate (i.e. the greatest lower bound) at Rank 2 given the GTBA Parameter and average Token Request rate values in Table A1-2.
Section B.2.2.3 develops general equations for bounds on the average Token Bypass rate as a function of the GTBA Parameters and average Token Request rates.
Section B.2.2.4 plots the average Transient Bypass rate at Rank n-1 as a function of the average Token Request rate at Rank n, and makes observations about how the average Transient Bypass rate is affected by changing values of the GTBA Parameters and/or the average Token Request rates.
B.2.2.1 Average Transient Bypass Rate Least Upper Bound Example
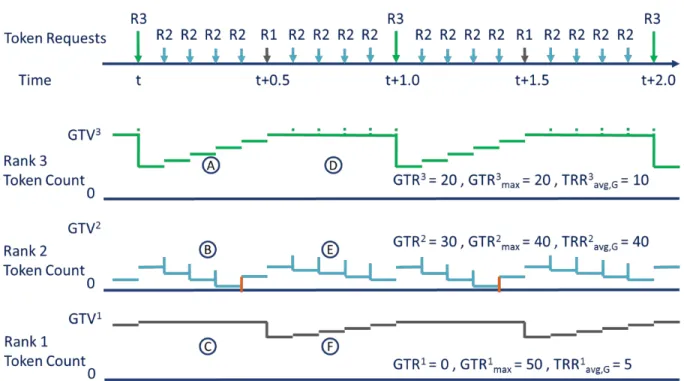
Suppose the Token Requests at Rank 3 are uniformly spaced at 1s intervals, and each request is for 10 tokens. Further suppose that between these there are nine Token Requests in other Ranks every 0.1s. Finally suppose that eight of these are requests at Rank 2 for 5 tokens each, and one is a request at Rank 1 for 5 tokens. Recall that the token count updates occur for all Ranks each time a Token Request occurs at any Rank, and therefore in this example the token count updates occur every 0.1s. This sequence of Token Requests is diagrammed in Figure A1-5. The figure also shows the timeline of the token count at each Rank.
MEF 41.0.1
© MEF Forum 2020. Any reproduction of this document, or any portion thereof, shall contain the following statement: "Reproduced with permission of MEF Forum." No user of this document is authorized to modify any of the information contained herein.
Page 24 Figure A1-5 – Transient Bypass Least Upper Bound Example
For the first 0.5s after a Token Request is received at Rank 3, the Rank 3 bucket will not be full, and so it will be replenished at 20 tokens per second (𝐺𝑇𝑅 ), or 2 tokens every 0.1s (reference point A in Figure A1-5). During this 0.5s period no tokens will Overflow from Rank 3 to Rank 2, the Rank 2 bucket will be replenished at 3 tokens every 0.1s, and 5 tokens will be removed if the Rank 2 Token Request is declared Green (reference point B). Also during this 0.5s period there is no change to the Rank 1 bucket until 5 tokens are removed when the Rank 1 Token Request is declared Green (reference point C). After 0.5s, the Rank 3 bucket will be full again, and so for the next 0.5s tokens will Overflow to Rank 2 at a rate of 20 tokens per second, or 2 every 0.1s (reference point D). For each 0.1s interval during this period there will be 5 tokens available at Rank 2 (3 from 𝐺𝑇𝑅 plus 2 overflowing from Rank 3), however, 𝐺𝑇𝑅 limits the number that can be added to the Rank 2 bucket to 4. Therefore 4 tokens will be added to the bucket, 5 tokens will be removed if the Rank 2 Token Request is declared Green, and 1 token will Bypass Rank 2 and be available at Rank 1 (reference point E). This single token is added to the Rank 1 bucket every 0.1s (reference point F).
The consequence of this sequence of Token Requests is that there are 35 tokens added to the Rank 2 bucket every second, and 40 tokens removed from the bucket (assuming all Rank 2 Token Requests are declared Green). Of course this will eventually empty the Rank 2 bucket, and will reach a steady state scenario where only 7 of the 8 Token Requests at Rank 2 are declared Green, and one is declared Red. Meanwhile Rank 1 receives 5 tokens per second due to the Transient Bypass from Rank 2, and therefore declares the one Token Request per second Green.
This sequence of Token Requests is an example that results in the maximum possible value for the average Transient Bypass rate at Rank 2 (i.e. the least upper bound). This is because there is one Token Request that occurs at just the right time for the Rank 3 bucket to be exactly filled,
MEF 41.0.1
© MEF Forum 2020. Any reproduction of this document, or any portion thereof, shall contain the following statement: "Reproduced with permission of MEF Forum." No user of this document is authorized to modify any of the information contained herein.
Page 25 which means that for all the Token Requests there will be either no tokens Overflowing the Rank 3 bucket, or all the tokens sourced by 𝐺𝑇𝑅 will Overflow. Therefore when tokens do Overflow, they do so at the maximum possible rate which maximizes the amount by which they exceed 𝐺𝑇𝑅 , and thus maximizes Transient Bypass at Rank 2. If there is no Token Request that exactly fills the Rank 3 bucket, but instead there is a Token Request where some tokens are added to the bucket (filling it) and some Overflow, then for those Overflow tokens the rate of Overflow would be less than 𝐺𝑇𝑅 , resulting in less Transient Bypass at Rank 2 and bringing down the average Transient Bypass rate.
B.2.2.2 Average Transient Bypass Rate Greatest Lower Bound Example
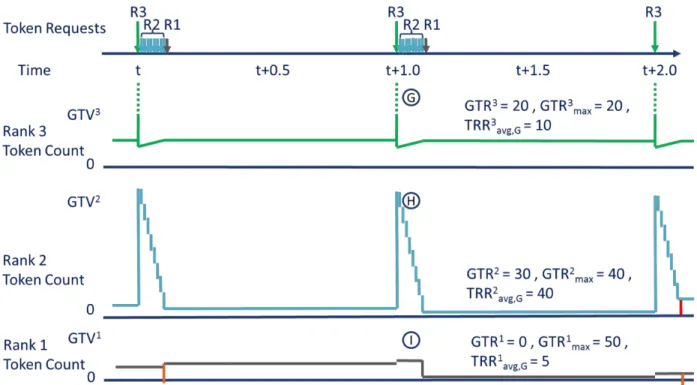
If the Rank 2 average Transient Bypass rate least upper bound is the result when a Token Request comes at just the right point in time to fill the Rank 3 bucket, it stands to reason that the Rank 2 average Transient Bypass greatest lower bound would be the result when all Token Requests were as far from this point in time as possible. Consider a sequence of Token Requests similar to that described in Section B.2.2.1, but instead of the Rank 2 and Rank 1 Token Requests being evenly distributed at 0.1s intervals, they all occur within the first 0.1s after a Rank 3 Token Request. This sequence of Token Requests, with the timeline of the token count at each Rank, is diagrammed in Figure A1-6.
Figure A1-6 – Transient Bypass Example Near Greatest Lower Bound
Each Rank 3 Token Request occurs after a 0.9s gap, so there will be 18 tokens sourced by 𝐺𝑇𝑅 , 8 of which will be added to the Rank 3 bucket (filling it) and 10 Overflow. 10 tokens are removed when the Rank 3 Token Request is declared Green. Over the next 0.1s there will be 2 tokens added to the Rank 3 bucket, and no tokens Overflow (reference point G in Figure A1-6). At Rank 2 there will be 37 tokens available (27 from 𝐺𝑇𝑅 plus the 10 Overflowing from Rank 3) when the Rank 3 Token Request occurs, however, 𝐺𝑇𝑅 limits the number that can be
MEF 41.0.1
© MEF Forum 2020. Any reproduction of this document, or any portion thereof, shall contain the following statement: "Reproduced with permission of MEF Forum." No user of this document is authorized to modify any of the information contained herein.
Page 26 added to the Rank 2 bucket to 36. Therefore one token will Bypass Rank 2 and be available at Rank 1. Over the next 0.1s there will be 3 tokens added to the Rank 2 bucket, and 5 tokens removed for each Rank 2 Token Request declared Green (reference point H). The single token that Bypassed the Rank 2 bucket will be added to the Rank 1 bucket, and 5 tokens will be removed if the Rank 1 Token Request is declared Green (reference point I).
This sequence of Token Requests results in an average Transient Bypass rate at Rank 2 of 1 token per second, whereas the previous example resulted in an average Transient Bypass rate at Rank 2 of 5 tokens per second. Compressing the Rank 2 and Rank 1 Token Requests into an even smaller interval following the Rank 3 Token Requests would result in an even lower average Transient Bypass rate at Rank 2, approaching the minimum possible value (i.e. the greatest lower bound) which occurs when all Token Requests are simultaneous. In this example the greatest lower bound of the Rank 2 average Transient Bypass rate is zero.
B.2.2.3 Calculating Bounds on the Average Transient Bypass Rate
The analysis in this section uses the normalized GTBA. Thus Constant Bypass is zero and 𝐺𝑇𝑅 is greater than or equal to 𝐺𝑇𝑅 at all ranks (Section B.2.1).
The examples in Section B.2.2.1 and Section B.2.2.2 show that the average Transient Bypass rate at Rank 𝑖 (𝑇𝐵𝑅 , ) varies depending on when token count updates occur, and therefore on the arrival of Token Requests at any Rank. However the value of the average Transient Bypass rate is bounded above and below. The greatest lower bound on the average Transient Bypass rate can be computed by observing that during any time interval the average rate of tokens added to the token bucket at Rank 𝑖 (i.e. the average rate of tokens shared from Rank 𝑖 1, denoted by 𝑆 , , plus 𝐺𝑇𝑅 minus the average Transient Bypass rate) can be less than 𝐺𝑇𝑅 but cannot exceed 𝐺𝑇𝑅 . Therefore the following inequality is true for any time interval:
𝑇𝐵𝑅 , 𝑚𝑎𝑥 0, 𝑆 , 𝐺𝑇𝑅 𝐺𝑇𝑅 .
In the case of Rank 𝑛 1, the average rate of tokens shared from Rank 𝑛 is the average rate of Overflow from Rank 𝑛. The greatest lower bound on the average rate of overflow is either zero (when the average Token Request rate, 𝑇𝑅𝑅 , , exceeds 𝐺𝑇𝑅 ), or 𝐺𝑇𝑅 minus the average Token Request rate (assuming the value of 𝐺𝑇𝑉 is large enough that all Token Requests are declared Green as long as the average Token Request rate is less than 𝐺𝑇𝑅 ). Therefore the greatest lower bound on the average Transient Bypass rate at Rank 𝑛 1 is:
𝑇𝐵𝑅 , 𝑚𝑎𝑥 0, 1 𝐶𝐹 𝑚𝑎𝑥 0, 𝐺𝑇𝑅 𝑇𝑅𝑅 , 𝐺𝑇𝑅 𝐺𝑇𝑅
In the general case of Rank 𝑖, the average rate of tokens shared from Rank 𝑖 1 depends upon the rate of tokens shared from Rank 𝑖 2. Tokens shared from Rank 𝑖 2 can only increase the tokens shared from Rank 𝑖 1, which can only increase the average Transient Bypass rate at Rank 𝑖. Therefore a lower bound on the average Transient Bypass rate at Rank 𝑖 can be calc la ed b aking he abo e e a ion and eplacing 𝑛 1 i h 𝑖 :
MEF 41.0.1
© MEF Forum 2020. Any reproduction of this document, or any portion thereof, shall contain the following statement: "Reproduced with permission of MEF Forum." No user of this document is authorized to modify any of the information contained herein.
Page 27 for 𝑖 1, . . , 𝑛 1.
Note that this inequality provides a lower bound, but not necessarily the greatest lower bound. When the rate of tokens shared from Rank 𝑖 2 is zero the lower bound calculated by this equation is the greatest lower bound. When the rate of tokens shared from Rank 𝑖 2 is large and 𝐺𝑇𝑅 is small, the lower bound calculated by this equation may significantly under estimate the greatest lower bound.
As discussed in Section B.2.2.1, the least upper bound on the average Transient Bypass rate at Rank 𝑛 1 occurs when there is a token count update in response to a Token Request at a Rank other than 𝑛 that exactly fills the Rank 𝑛 bucket. Then, during the interval when the Rank 𝑛 bucket is full, all the tokens sourced at Rank 𝑛 Overflow and there can be Transient Bypass at Rank 𝑛 1. During the interval when the Rank 𝑛 bucket is not full none of the tokens sourced at Rank 𝑛 will Overflow and there will not be any Transient Bypass at Rank 𝑛 1. The least upper bound on the average Transient Bypass rate at Rank 𝑛 1 can be determined by multiplying the Transient Bypass rate when the Rank 𝑛 bucket is full by the fraction of time that the Rank n bucket is full. This fraction is one minus the ratio of the average Token Request rate at Rank 𝑛 to the token source rate at Rank 𝑛. The Transient Bypass at Rank 𝑛 1 during the interval when the Rank 𝑛 bucket is full is the sum of the tokens sourced at Ranks 𝑛 and 𝑛 1, minus the maximum token rate at Rank 𝑛 1. Therefore the least upper bound on the average Transient Bypass rate at Rank 𝑛 1 is:
𝑇𝐵𝑅 , 𝑚𝑎𝑥 0, 1 𝑇𝑅𝑅 ,
𝐺𝑇𝑅 𝑚𝑎𝑥 0, 1 𝐶𝐹 𝐺𝑇𝑅 𝐺𝑇𝑅 𝐺𝑇𝑅
In the general case of Rank 𝑖, the maximum Transient Bypass occurs during intervals where the token buckets at all higher Ranks are full. During these intervals the Transient Bypass rate is the amount by which the sum of the token source rates at Rank 𝑖 and all higher Ranks exceeds 𝐺𝑇𝑅 (assuming 𝐶𝐹 0 at all higher Ranks). The Transient Bypass rate will be lower during any other intervals, with the actual value depending upon which of the higher Rank token buckets are full. Therefore calculating the least upper bound for Ranks lower than n-1 is complex and beyond the scope of this document. However, an upper bound on the average Transient Bypass rate at Rank 𝑖 can be calculated by assuming the token buckets at all higher Ranks fill at the same time, and that maximal rate of Token Bypass is sustained for the longest time that the token bucket at any Rank remains full:
𝑇𝐵𝑅 , 𝑚𝑎𝑥 0,1 , , . . ,1 , 𝑚𝑎𝑥 0, ∑ 𝐺𝑇𝑅 𝐺𝑇𝑅
for 𝑖 1, . . , 𝑛 and where 𝐶𝐹 0.
Note that this equation provides an upper bound, but not necessarily the least upper bound. The upper bound calculated by this equation will be the least upper bound only in two cases. One of these cases is that the token buckets at all higher Ranks are full for the same percentage of time, i.e. the ratio of the average Token Request rate to the normalized token source rate is the same at all Ranks. The other of these cases is when 𝐺𝑇𝑅 is greater than or equal to the sum of the normalized token source rates at all Ranks, in which case the average Transient Bypass rate is
MEF 41.0.1
© MEF Forum 2020. Any reproduction of this document, or any portion thereof, shall contain the following statement: "Reproduced with permission of MEF Forum." No user of this document is authorized to modify any of the information contained herein.
Page 28 zero. In all other circumstances the upper bound calculated by this equation will over estimate the least upper bound. When there is wide variation in the ratio of average Token Request rate to normalized token source rate at different Ranks, the over estimate can be quite large.
The greatest lower bound and least upper bound for the average Transient Bypass rate at Rank 𝑛 1 can be applied to the example in Table A1-2. First note that the Constant Bypass rate at each Rank is zero, so 𝐺𝑇𝑅 is equal to 𝐺𝑇𝑅 at all Ranks. Looking at the least upper bound, the ratio of the 𝑇𝑅𝑅 , to 𝐺𝑇𝑅 is 1/2, and the sum of 𝐺𝑇𝑅 and 𝐺𝑇𝑅 exceeds 𝐺𝑇𝑅 by 10 tokens per second, so the average Transient Bypass rate is a maximum of 5 tokens per second. Looking at the greatest lower bound, the overflow from Rank 3 plus 𝐺𝑇𝑅 equals 𝐺𝑇𝑅 , so the average Transient Bypass rate in this case is a minimum of zero. The consequence of this Token Bypass rate is that the actual rate of tokens declared Green at Rank 2 will be up to 5 tokens per second less than the intuitive rate of tokens declared Green, and the actual rate of tokens declared Green at Rank 1 will be up to 5 tokens per second more than the intuitive rate.
B.2.2.4 Observations Regarding the Average Transient Bypass Rate
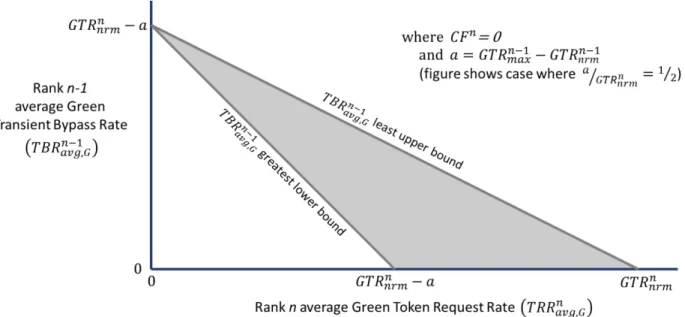
Figure A1-7 shows a plot of the least upper bound and greatest lower bound of the average Transient Bypass rate at Rank 𝑛 1 versus the average Token Request rate at Rank 𝑛. The shaded area between the bounds represents possible values of the average Transient Bypass rate. The exact value of the average Token Request rate is uncertain because it depends on the specific sequence of Token Requests at all Ranks. Nonetheless it is possible to use Figure A1-7 to make some observations about what value of the average Transient Bypass rate to expect for given GTBA parameters and average Token Request rate.
Figure A1-7 – Example of the Rank n-1 Average Token Bypass Rate Bounds Figure A1-7 assumes the Coupling Flag at Rank 𝑛 is zero. As can be seen in Figure A1-1, the tokens shared from Rank 𝑖 1 is always equal to zero when 𝐶𝐹 1. This leads to the first, somewhat trivial, observation:
MEF 41.0.1
© MEF Forum 2020. Any reproduction of this document, or any portion thereof, shall contain the following statement: "Reproduced with permission of MEF Forum." No user of this document is authorized to modify any of the information contained herein.
Page 29 1. When the Coupling Flag at Rank 𝑖 1 is one, there will be no tokens shared from
Rank 𝑖 1 to Rank 𝑖, and therefore there will be no Transient Bypass at Rank 𝑖. Figure A1-7 also assumes that 𝐺𝑇𝑅 𝐺𝑇𝑅 ⁄𝐺𝑇𝑅 , however observations 2 through 5 are true for any values of the GTBA parameters. As the average Token Request rate at Rank 𝑛 decreases, the number of tokens Overflowing the token bucket at Rank 𝑛 increases. Therefore the average rate of tokens shared to Rank 𝑛 1 increases, causing the average Transient Bypass rate at Rank 𝑛 1 to increase.
2. The value of 𝑇𝐵𝑅 , increases as 𝑇𝑅𝑅 , approaches zero. When 𝑇𝑅𝑅 , 0, the value of 𝑇𝐵𝑅 , 𝐺𝑇𝑅 𝐺𝑇𝑅 𝐺𝑇𝑅 .
As the average Token Request rate at Rank 𝑛 approaches the new token source rate at Rank 𝑛, the average rate of tokens shared to Rank 𝑛 1 decreases, and therefore the average Transient Bypass rate at Rank 𝑛 1 decreases.
3. The value of 𝑇𝐵𝑅 , decreases as 𝑇𝑅𝑅 , approaches 𝐺𝑇𝑅 . When 𝑇𝑅𝑅 ,
𝐺𝑇𝑅 , 𝑇𝐵𝑅 , 0.
The uncertainty (U) in the value of the average Transient Bypass rate at Rank 𝑛 1 is the difference between the least upper bound and greatest lower bound lines in Figure A1-7. U can be calculated as follows:
𝑈
{
1 𝑇𝑅𝑅 ,
𝐺𝑇𝑅 𝐺𝑇𝑅 𝑎 𝐺𝑇𝑅 𝑇𝑅𝑅 , 𝑎 𝑤ℎ𝑒𝑛𝑇𝑅𝑅 , 𝐺𝑇𝑅 𝑎
1 𝑇𝑅𝑅 ,
𝐺𝑇𝑅 𝐺𝑇𝑅 𝑎 𝑤ℎ𝑒𝑛𝑇𝑅𝑅 , 𝐺𝑇𝑅 𝑎
𝑎 𝑎
𝐺𝑇𝑅 𝑤ℎ𝑒𝑛𝑇𝑅𝑅 , 𝐺𝑇𝑅 𝑎 𝑤ℎ𝑒𝑟𝑒 𝐶𝐹 0 𝑎𝑛𝑑 𝑎 𝐺𝑇𝑅 𝐺𝑇𝑅
Figure A1-8 shows the uncertainty in the value of the average Transient Bypass rate at Rank 𝑛 1 as the average Token Request rate at Rank 𝑛 varies from zero to 𝐺𝑇𝑅 where the Coupling Flag at Rank 𝑛 is zero and 𝐺𝑇𝑅 𝐺𝑇𝑅 ⁄𝐺𝑇𝑅 .
MEF 41.0.1
© MEF Forum 2020. Any reproduction of this document, or any portion thereof, shall contain the following statement: "Reproduced with permission of MEF Forum." No user of this document is authorized to modify any of the information contained herein.
Page 30 Figure A1-8 – Uncertainty in the Rank n-1 Average Token Bypass Rate
The smallest uncertainty occurs when then average Token Request rate at Rank 𝑛 is either zero or greater than or equal to the new token source rate at Rank 𝑛. The largest uncertainty occurs when the greatest lower bound line intersects the horizontal axis. This is when the average Overflow rate from Rank 𝑛 (the difference between the new token source rate and the average Token Request rate at Rank 𝑛) is equal to the difference between the maximum token rate and the new token source rate at Rank 𝑛 1. At this point the uncertainty is equal to the least upper bound.
4. The uncertainty in 𝑇𝐵𝑅 , decreases as 𝑇𝑅𝑅 , approaches zero, and as 𝑇𝑅𝑅 , approaches 𝐺𝑇𝑅 . The uncertainty in the 𝑇𝐵𝑅 , is zero when 𝑇𝑅𝑅 , 0 or
𝑇𝑅𝑅 , 𝐺𝑇𝑅 .
5. The maximum uncertainty in the 𝑇𝐵𝑅 , occurs when 𝑇𝑅𝑅 , 𝐺𝑇𝑅
𝐺𝑇𝑅 𝐺𝑇𝑅 . At this point the greatest lower bound of 𝑇𝐵𝑅 , is equal to zero and the least upper bound is equal to 𝑎 𝑎 /𝐺𝑇𝑅 where 𝑎 𝐺𝑇𝑅
𝐺𝑇𝑅 .
Figure A1-7 and Figure A1-8 ha e been d a n ing a a io of 𝑎 o 𝐺𝑇𝑅 of ½, which is the same as in the example in Table A1-2. These figures can also help visualize how the average Transient Bypass rate is affected by changes in the GTBA parameters. Consider what happens to Figure A1-7 when the difference between the maximum token rate and the new token source rate at Rank 𝑛 1 (labeled 𝑎 in Figure A1-7) changes. As the difference gets smaller, the intersection of both the least upper bound and greatest lower bound lines with the vertical axis moves up, and the intersection of the greatest lower bound line with the horizontal axis moves right. The shaded area representing the possible values of the average Transient Bypass rate becomes an increasingly steep narrow triangle. When the difference equals zero the triangle becomes a line where the average Transient Bypass rate at Rank 𝑛 1 equals the new token source rate at Rank 𝑛 minus the average Token Request rate at Rank 𝑛. This makes sense since as the difference between the maximum token rate and the new token source rate gets small, very few tokens shared from the higher Rank can be added to the token bucket, and almost all shared tokens bypass the token bucket. Furthermore, as the intersection of the greatest lower bound line with the horizontal axis in Figure A1-7 moves right, the peak of the triangle of the uncertainty in Figure A1-8 follows the curved dashed line down and right until it also reaches zero.
MEF 41.0.1
© MEF Forum 2020. Any reproduction of this document, or any portion thereof, shall contain the following statement: "Reproduced with permission of MEF Forum." No user of this document is authorized to modify any of the information contained herein.
Page 31 6. The value of 𝑇𝐵𝑅 , increases and the uncertainty in 𝑇𝐵𝑅 , decreases as
𝐺𝑇𝑅 𝐺𝑇𝑅 approaches zero. When 𝐺𝑇𝑅 𝐺𝑇𝑅 0, the uncertainty in 𝑇𝐵𝑅 , is zero and 𝑇𝐵𝑅 , 𝐺𝑇𝑅 𝑇𝑅𝑅 , .
As the difference between the maximum token rate and the new token source rate at Rank 𝑛 1 increases, the intersection of both the least upper bound and greatest lower bound lines with the vertical axis moves down, and the intersection of the greatest lower bound line with the horizontal axis moves left. The shaded area representing the possible values of the average Transient Bypass rate becomes an increasingly long narrow triangle just above the horizontal axis. When the difference equals the new token source rate at Rank 𝑛, the triangle becomes a line where the average Transient Bypass rate equals zero. This makes sense since as the difference between the maximum token rate and the new token source rate at Rank 𝑛 1 gets close to the new token source rate at Rank 𝑛, almost all tokens shared from the higher Rank can be added to the token bucket, and very few shared tokens bypass the token bucket. Furthermore, as the intersection of the greatest lower bound line with the horizontal axis in Figure A1-7 moves left, the peak of the triangle of the uncertainty in Figure A1-8 follows the curved dashed line down and left until it also reaches zero. As an example, Figure A1-9 shows the uncertainty plot when
he a io of a o 𝐺𝑇𝑅 is changed to ¾.
Figure A1-9 – Uncertainty in the Rank n-1 Average Token Bypass Rate 7. The value of 𝑇𝐵𝑅 , decreases and the uncertainty in 𝑇𝐵𝑅 , decreases as
𝐺𝑇𝑅 𝐺𝑇𝑅 approaches 𝐺𝑇𝑅 . When 𝐺𝑇𝑅 𝐺𝑇𝑅 𝐺𝑇𝑅 , the uncertainty in 𝑇𝐵𝑅 , is zero and 𝑇𝐵𝑅 , 0.
The largest uncertainty in the average Transient Bypass rate at Rank 𝑛 1 is always where the greatest lower bound line intersects the horizontal axis, which is where 𝑇𝑅𝑅 , 𝐺𝑇𝑅
𝐺𝑇𝑅 𝐺𝑇𝑅 . As 𝐺𝑇𝑅 𝐺𝑇𝑅 varies from zero to 𝐺𝑇𝑅 , the peak of the uncertainty triangle in Figure A1-8 follows the dotted line shown in the figure. The overall maximum occurs when the average Token Request rate at Rank 𝑛 and the difference between the maximum token rate and the new token source rate at Rank 𝑛 1 are both equal to 𝐺𝑇𝑅 /2.
8. The maximum uncertainty in the average Transient Bypass rate at Rank 𝑛 1 over any value of the average Token Request rate at Rank 𝑛 and any value of the difference
MEF 41.0.1
© MEF Forum 2020. Any reproduction of this document, or any portion thereof, shall contain the following statement: "Reproduced with permission of MEF Forum." No user of this document is authorized to modify any of the information contained herein.
Page 32 between the the maximum token rate and the new token source rate at Rank 𝑛 1 occurs when 𝑇𝑅𝑅 , 𝐺𝑇𝑅 𝐺𝑇𝑅 𝐺𝑇𝑅 /2 . In this case the greatest lower bound of the average Transient Bypass rate is zero, and the least upper bound is equal to 𝐺𝑇𝑅 /4.
Looking back at the example in Table A1-2, the average Overflow rate from Rank 3 is 10 tokens per second, and the difference between the maximum token rate and the new token source rate at Rank 2 is 10 tokens per second, meeting the criteria for observation 5. One half of the new token source rate at Rank 3 is also 10 tokens per second, meeting the criteria for observation 8. Therefore this is an example where the overall uncertainty in the average Transient Bypass rate is at a maximum, with the greatest lower bound at zero and the least upper bound at one fourth the new token source rate at Rank 3, or 5 tokens per second.
A final observation can be made regarding the likelihood of observing an average Transient Bypass rate at Rank 𝑛 1 near the least upper bound, as opposed to near the greatest lower bound, when the GTBA is used for an ingress bandwidth profile at a UNI or ENNI. In this case Token Requests correspond to frames that arrive sequentially at the interface. The probability of having a token count update that exactly fills the Rank 𝑛 bucket increases as the number of frames (at any Rank) increases, and as the rate of tokens requested approaches the bandwidth of the interface. Therefore the likelihood of observing an average Transient Bypass rate at Rank 𝑛 1 near the least upper bound increases at heavily utilized interfaces.
MEF 41.0.1
© MEF Forum 2020. Any reproduction of this document, or any portion thereof, shall contain the following statement: "Reproduced with permission of MEF Forum." No user of this document is authorized to modify any of the information contained herein.
Page 33