R E S E A R C H
Open Access
Combined analysis of endometrial thickness and
pattern in predicting outcome of in vitro
fertilization and embryo transfer: a retrospective
cohort study
Shi-Ling Chen
*†, Fang-Rong Wu
†, Chen Luo, Xin Chen, Xiao-Yun Shi, Hai-Yan Zheng, Yun-Ping Ni
Abstract
Objective:To evaluate the combined effect of endometrial thickness and pattern on clinical outcome in patients undergoing in vitro fertilization/intracytoplasmic sperm injection and embryo transfer (IVF/ICSI-ET).
Methods:Cycles of IVF/ICSI-ET conducted between January 2003 and December 2008 at a university-based
reproductive center were reviewed retrospectively. Endometrial ultrasonographic characteristics were recorded on the day of hCG administration. In the combined analysis, endometrial thickness groups (group 1: equal or <7 mm; group 2: 7-14 mm; group 3: >14 mm) were subdivided into two endometrial patterns (pattern A: triple-line; pattern B: no-triple line). Clinical pregnancy rate (CPR) and early miscarriage rate in different groups were analyzed.
Results:A total of 2896 cycles were reviewed. Clinical pregnancy rate (CPR) was 24.4% in group1-A. There were no second trimester pregnancies in group 1-B. Miscarriage rate in group 2-A was significantly lower compared to group 2-B (P < 0.01), although CPR did not show any significant differences between the groups. A no-triple line endometrial pattern with moderate endometrial thickness (7-14 mm) had a detrimental effect on pregnancy outcome, but not the occurrence of pregnancy. In group 3, there was no difference in CPR and miscarriage rates between the two patterns; adequate endometrial thickness (>14 mm) seemed to mitigate the detrimental impact (high miscarriage rate) of pattern B.
Conclusion:Combined analysis of endometrial thickness and pattern on the day of hCG administration was a
better predictor of the outcome of IVF/ICSI-ET and may be more helpful for patient counseling than the separate analyses.
Background
It is generally accepted that endometrial receptivity is critical to successful pregnancy. Ultrasonographic exam-ination has been routinely performed in assisted repro-duction technology (ART) treatments because of the accurate evaluation and noninvasive detection. Indeed, both endometrial thickness and endometrial pattern have been regarded as prognostic parameters for suc-cessful pregnancy in in vitro fertilization/intracytoplas-mic sperm injection and embryo transfer (IVF/ICSI-ET).
Following the periodic stimulation of ovarian hor-mones, the changes in endometrial structure during the menstrual cycle can be identified easily by ultrasound examination [1]. In an IVF/ICSI procedure, hCG is used as a substitute for the natural luteinizing hormone (LH)-surge to trigger the final maturity of the oocyte. Evaluation of endomtrium on the day of hCG adminis-tration is of great clinical importance [2,3]. Several stu-dies have demonstrated the existence of a correlation between endometrial characteristics and pregnancy rate in IVF/ICSI patients [4-6]. However, the correlation pro-posed in these studies has not been universally accepted [7,8]. There also is no consensus on whether the endo-metrial ultrasound characteristics can predict the * Correspondence: [email protected]
†Contributed equally
Center for Reproductive Medicine, Department of Obstetrics and Gynecology, Nanfang Hospital, Southern Medical University, Guangzhou, People’s Republic of China
pregnancy outcome in IVF/ICSI treatment. Weissmanet al. reported an increase in miscarriage rate when an endometrial thickness of > 14 mm was found on the day of hCG injection [9]. However, data from more recent studies do not support this finding [10]. A no tri-ple-line endometrial pattern seems to be a prognostic sign of a less favourable outcome, while a triple-line pat-tern appear to be associated with conception [11-13].
Despite the abundance of studies that have evaluated the effect of endometrial characteristics on clinical out-come in IVF/ICSI patients, studies on the combined predictive role of endometrial thickness and pattern are lacking. In this study, we examined the correlation between endometrial thickness and pattern (individually and together) and IVF/ICSI outcome. Our objective was to investigate whether combined analysis of endometrial thickness and pattern would improve the prediction of clinical outcome compared to the analysis of thickness or pattern separately.
Methods Study population
Cycles of IVF/ICSI conducted between January 2003 and December 2008 at a university-based reproductive cen-ter were reviewed retrospectively. Since this study was retrospective and vaginal sonographic assessment on the day of hCG administration was done routinely in our center, Institutional Review Board approval for the study was not necessary. All fresh IVF or ICSI treatment cycles that used the long protocol (midluteal phase GnRH-agonist suppression) as the method of ovarian stimulation and reached oocyte pick up and embryo transfer within the study period were included, regard-less of diagnosis, reproductive history, or insemination method. Cycles using donor oocytes or cryopreserved embryos were excluded from this study. Other exclusion criteria included: age greater than 42 years, the presence of known endometrial anomalies, and ovarian stimula-tion method other than the long protocol.
IVF/ICSI-ET treatment protocol
For ovarian stimulation utilizing the long protocol pro-cedure, each patient received a single intramuscular (IM) injection of the gonadotrophin releasing hormone (GnRH) agonist (1.25 mg to 1.875 mg) in the midluteal phase of the cycle prior to the initiation of controlled ovarian hyperstimulation (COH). After spontaneous menstruation occurred, a vaginal ultrasound examina-tion and serum estradiol concentraexamina-tion (E2) measure-ment were performed. When the E2 levels were≤50 pg/ mL, and the longest follicle diameter was <10 mm with-out ovarian cysts, COH was performed. COH was achieved with administration of gonadotrophin, includ-ing the follicle stimulatinclud-ing hormones (FSH) and/or
human menopausal gonadotrophin (hMG). The initial dosage of gonadotrophin ranged from 150 to 450 IU, depending on the basal FSH level, antral follicular count (AFC), and maternal age. Once three or more follicles reached a diameter of≥17 mm, hCG was administered. Oocytes were retrieved within 34 to 36 hours and embryo transfer was performed 2 to 5 days afterwards. All patients were given IM P daily starting on the day of oocyte retrieval. Serumb-hCG levels were measured 11-14 days after embryos transfer. Subsequent ultrasound examinations were performed at a gestational age of 7 weeks. Clinical pregnancy was defined as identification of a gestational sac 2-3 weeks after embryo transfer. Early miscarriage was defined as pregnancy ending before 12 weeks of gestation.
Ultrasound examinations
Endometrial thickness was measured in the midsagittal plane of the uterine body on the day of hCG administra-tion. The largest thickness from one interface of the endometrial-myometrial junction to the other was mea-sured. All cycles were divided into three groups depend-ing on the thickness: group 1 ≤7 mm; group 2: >7 to ≤14 mm; group 3: >14 mm. Endometrial pattern is defined as the type of relative echogenicity of the endo-metrium compared with adjacent myoendo-metrium [2]. Sev-eral classifications of ultrasonographic endometrial patterns have been used in the previous studies. In our study, we classified all patterns into two types. Pattern A (triple-line) was described as hypoechoic endome-trium with well-defined hyperechoic outer walls and a central echogenic line; pattern B (no triple-line) was defined as a isoechoic or homogeneous hyperechoic endometrium with a non-prominent or absent central echogenic line (Figure 1).
Statistical analysis
Data were analyzed using SPSS version 13 software (SPSS Inc., Chicago, IL), all tests were two-tailed, and P < 0.05 was considered statistically significant. Continu-ous variables were presented as mean ± SD and were tested by student’s t-test. Categorical data were expressed as numbers and compared using the Chi-square test. Logistic regression was performed to deter-mine the independent effect of individual variables on clinical outcome.
Results
Baseline cycle characteristics
A total of 2896 IVF/ICSI cycles were investigated in this study. The overall clinical pregnancy rate was 48.4% and the early miscarriage rate was 8.4%. Patients ranged in age from 20 to 42 years, and endometrial thickness on the day of hCG administration ranged from 5.2 mm to
Chenet al.Reproductive Biology and Endocrinology2010,8:30 http://www.rbej.com/content/8/1/30
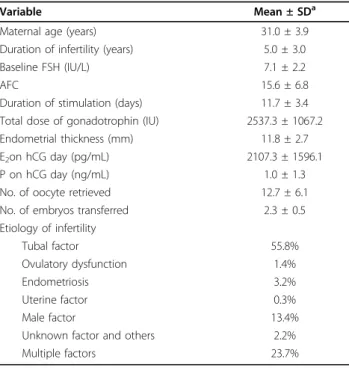
26.7 mm. Other demographic data, such as antral folli-cular count (AFC), duration of infertility, and number of embryos transferred are summarized in Table 1.
Binary logistic analysis of some variables on clinical pregnancy rate
Forward stepwise binary logistic regression analysis (model R2= .028, P < .001) was used to assess the effect of maternal age, AFC, endometrial thickness and pat-tern, length of infertility, P levels on the day of hCG administration, and basal FSH levels on clinical preg-nancy. The analysis indicated that maternal age (r = -.025, P = .037) was negatively correlated with clini-cal pregnancy, and that increasing endometrial thickness (r = .060, P = .001) and AFC (r = .027, P < .001) were
associated with improved clinical pregnancy rates. Other variables involved did not contribute significantly to clinical pregnancy (Table 2).
Endometrial pattern
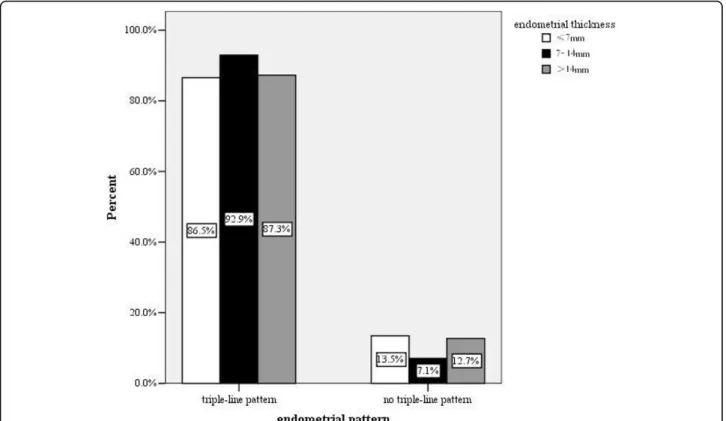
Most (91.9%) of our subjects had a triple-line pattern on the day of hCG administration. The distribution of endometrial patterns in the three endometrial thickness groups is shown in Figure 2. Pattern A was detected more frequently in group 2 than in groups 1 and 3(P < 0.01). Progesterone levels on the day of hCG administra-tion did not differ between the two patterns (0.95 ± 0.82 in pattern A vs 1.04 ± 1.07 in pattern B, P > 0.05). There was no difference in clinical pregnancy rates between the patterns (48.6% in pattern A, and 46.2% in
pattern B, P > 0.05). The incidence of miscarriage in pattern B was significant higher than that in pattern A (15.6% vs 7.9%, P < 0.05).
Endometrial thickness
To evaluate the role of endometrial thickness in preg-nancy outcome, clinical pregpreg-nancy rates were evaluated at each millimeter of endometrial thickness. Pregnancy rates ranged from 11.1% among patients with an endo-metrial thickness of ≤6 mm to 59.1% among patients with an endometrial thickness of 14-15 mm. Early mis-carriage rates varied with endometrial thickness, but showed no consistent increase with increasing
endometrial thickness (Table 3). An endometrial thick-ness threshold of 7 mm was observed below which preg-nancy rates decreased rapidly. Clinical pregpreg-nancy rates were 23.1% in group 1 (≤ 7 mm), 47.6% in group 2 (7.1-14 mm) and 55.2% in group 3 (>(7.1-14 mm), the differences between groups being statistically significant (P < 0.01). Miscarriage rates were not significantly different in the three groups (Table 4).
Assessing clinical outcome by combined analysis of endometrial thickness and pattern
To evaluate the relationship between endometrial thick-ness and pattern, the three endometrial thickthick-ness groups were subdivided into the respective endometrial patterns (Table 4). In group 1, pattern A was associated with a clinical pregnancy rate of 24.4%; in pattern B, only 1 cycle obtained clinical pregnancy but ended in miscar-riage. Compared with group 2-A, the pregnancy rate was lower in group 2-B, but no significant differences were noted. The early miscarriage rate in group 2-A was significantly lower compared to patterns B (8.3% in pat-tern A vs 16.9% in patpat-tern B, P < 0.05). In group 3, there was no difference in clinical pregnancy and mis-carriage rates between the patterns. Pregnancy rates increased significantly with increasing endometrial thick-ness in patterns A and B (Table 4).
Discussion
To our knowledge, this study is the largest in terms of sample size to assess the combined effect of endometrial thickness and pattern on clinical outcome. In our study, we used binary logistic regression to analyze the associa-tion between clinical pregnancy and maternal age, endo-metrial thickness, basal FSH levels, length of stimulation and AFC. We found an independent effect of endome-trial thickness on pregnancy rate. This finding is in agreement with previous studies [5,6,14,15]. Pregnancy rate decreased markedly as age increased, in agreement with the results of previous research by others [5,6,14-17].
There is a lack of agreement with regard to the mini-mum endometrial thickness required for successful pregnancy. In one study, no pregnancies occurred when the endometrial thickness was less than 7 mm [3], whereas other studies have found that a minimum thickness of 6 mm is acceptable as a prerequisite for implantation [18-21], and one study reported a success-ful pregnancy with an endometrial thickness as little as 4 mm [22]. In the present study, the thinnest endome-trial lining for successful ongoing pregnancy was 5.3 mm. From the evaluation of clinical pregnancy rates according to each millimeter of endometrial thickness, we found an endometrial thickness threshold of 7 mm, below which pregnancy rates decreased rapidly. The Table 1 Baseline cycle characteristics (N = 2896)
Variable Mean ± SDa
Maternal age (years) 31.0 ± 3.9
Duration of infertility (years) 5.0 ± 3.0
Baseline FSH (IU/L) 7.1 ± 2.2
AFC 15.6 ± 6.8
Duration of stimulation (days) 11.7 ± 3.4 Total dose of gonadotrophin (IU) 2537.3 ± 1067.2
Endometrial thickness (mm) 11.8 ± 2.7
E2on hCG day (pg/mL) 2107.3 ± 1596.1
P on hCG day (ng/mL) 1.0 ± 1.3
No. of oocyte retrieved 12.7 ± 6.1
No. of embryos transferred 2.3 ± 0.5
Etiology of infertility
Tubal factor 55.8%
Ovulatory dysfunction 1.4%
Endometriosis 3.2%
Uterine factor 0.3%
Male factor 13.4%
Unknown factor and others 2.2%
Multiple factors 23.7%
a
Mean ± SD, unless otherwise indicated AFC = antral follicular count
P = serum progesterone concentration E2= serum estradiol concentration
Table 2 Binary logistic regressiona(model R2= .028,
P< .001)
Independent variables Rb Pc
Maternal age -0.025 0.037
Endometrial thickness 0.060 0.001
AFC 0.027 0.000
Endometrial thickness 0.777 0.378
Baseline FSH level 0.087 0.768
P on hCG day 3.000 0.083
Duration of infertility 0.885 0.347
a
Clinical pregnancy served as dependent variable; Method = forward stepwise (likelihood ratio)
b
Partial coefficients
c
Pvalues. R values were considered statistically non-significant unlessP< 0.05 Chenet al.Reproductive Biology and Endocrinology2010,8:30 http://www.rbej.com/content/8/1/30
clinical pregnancy rate in group 1 (endometrial thick-ness ≤7 mm) was significantly lower than groups 2 and 3, being only 23.1%. The relatively lower pregnancy rate observed in this group suggests that more attention needs to be given to embryos transferred to such patients.
Recently, Richter et al. demonstrated a significant increase in the pregnancy rate as endometrial thickness
increased, independent of the number and quality of embryos transferred [5]. Their conclusion was con-firmed by Ai-Ghamdiet alin a 2464-cycle cohort study [6]. Our results were closely similar to these two studies. Although Weissman reported a high miscarriage rate with increased endometrial thickness (>14 mm) [9], in the present study, there was no trend toward an increase in miscarriage rates as endometrial thickness increased from 6 mm to17 mm (see Table 3). Thus, our findings support those of some previous studies in which increased endometrial thickness (>14 mm) did not have a detrimental effect on clinical outcome.
Consistent with several previous studies, we found that endometrial echo patterns have no prognostic value for pregnancy [8,23,24]. However, the miscarriage rate in the no triple-line endometrial pattern was signifi-cantly higher than in the triple-line pattern. Several stu-dies have suggested that a premature secretory endometrial pattern is introduced by the advanced P rise, and this premature conversion has an adverse effect on pregnancy rates. In our study, increased P concentra-tions were not found in no-triple line pattern. The rea-son that no-triple line endometrial pattern was observed prior to ovulation is not known and cannot be explained by higher P levels. The distribution of the triple-line endometrial pattern in the different endometrial
Figure 2Distribution of endometrial patterns in three endometrial thickness groups. The percentages of endometrial pattern are shown for individual endometrial thickness group.
Table 3 Clinical outcome by individual endometrial thickness
Endometrial thickness (mm)
Cycles (n)
Clinical pregnancy rate (cycles, %)
Miscarriage rate (n, %)
≤6 9 1 (11.1) 0
>6 to≤7 43 11 (25.6) 1 (9.1)
>7 to≤8 142 64 (45.1) 4 (6.3)
>8 to≤9 277 106 (38.3) 13 (12.3)
>9 to≤10 393 191 (48.6) 16 (8.4)
>10 to≤11 424 204 (48.1) 20 (9.8)
>11 to≤12 416 198 (47.6) 14 (7.1)
>12 to≤13 377 185 (49.1) 15 (8.1)
>13 to≤14 320 170 (53.1) 17 (10.0)
>14 to≤15 198 117 (59.1) 9 (7.7)
>15 to≤16 124 57 (46.0) 3 (5.3)
>16 to≤17 71 40 (56.3) 5 (12.5)
thickness subgroups differed significantly. The exact mechanism for this is not known, and a rational expla-nation for this phenomenon awaits further study.
In our study, the clinical pregnancy rate was 24.4% in group 1-A, whereas no second trimester pregnancies occurred in group 1-B (see Table 4). Perhaps the coexis-tence of a thinner endometrium in association with no-triple line pattern reflected a diminished endometrial responsiveness to ovarian hormones and poor receptiv-ity of the endometrium, leading to a low clinical preg-nancy rate and poor clinical outcome. Because of the small sample size in group 1-B, further research is needed. Clinical outcomes in pattern B in the other two groups (group 2 and 3) were inconsistent with that in group 1. There were no differences in clinical pregnancy rates between the two patterns in groups 2 and 3. This finding is not in agreement with that of Check et al, who found that no pregnancies occurred in those patients with homogeneous hyperechoic endometrium [12]. However, the miscarriage rates in groups 2-B was significantly higher than in group 2-A. These findings suggest that the adverse effect of pattern B together with a moderate endometrial thickness (7-14 mm) mainly affects the pregnancy outcome, but not the preg-nancy rate. An unexpected finding was a similar miscar-riage rate in the two patterns in group 3. Perhaps adequate endometrial thickness (>14 mm) mitigated the detrimental impact (high miscarriage rate) of pattern B endometrial texture.
One limitation of this study is that the number of thin endometrial thickness (≤7 mm) with no-triple line pat-tern subjects in the study population was too small to make a definitive statement. The small sample size of no-triple line pattern in each millimeter of endometrial thickness also prevented the use of endometrial thick-ness as a continuous variable in the combined analysis.
Conclusions
In conclusion, when a thinner endometrium (≤7 mm) and no triple-line endometrial pattern coexist in an IVF/
ICSI candidate, cryopreservation should be recom-mended. Because endometrial thickness ≤7 mm with no-triple line pattern was seen in only 0.3% of cycles in our study, further study is needed to make a definitive conclusion. If a thinner endometrium with a good texture (triple-line) is present, other prognostic factors, such as embryo quality, should be taken into consideration. Regardless of the endometrial pattern, a thicker endome-trium (>14 mm) did not have an adverse effect on the clinical outcome. Combined analysis of endometrial thickness and pattern on the day of hCG administration could be more valuable than the separate analyses.
Acknowledgements
The whole study was supported by National key basic research development plan of China. (2007CB948104). We would like to thank the Biostatistician in the Department of Biostatistics, Southern Medical University of China for their help in the statistical analysis. The authors wish to acknowledge the diligent technical assistance of the Embryology Lab staff: Zuo-Lin Qiu, Wei-Qin Zhang, Jie Yang.
Authors’contributions
SLC designed the study, performed the monitoring of endometrium and revised the manuscript. FRW drafted the manuscript and performed the statistical analysis. CL analyzed the data. XC participated in the ultrasound examinations of endometrium. XYS helped to draft the manuscript. HYZ participated in the design of the study. YPN helped to analyze the data. All authors read and approved the final manuscript.
Competing interests
The authors declare that they have no competing interests.
Received: 26 January 2010 Accepted: 24 March 2010 Published: 24 March 2010
References
1. Killick SR:Ultrasound and the receptivity of the endometrium.Reprod BioMed Online2007,15:63-67.
2. Friedler S, Schenker JG, Herman A, Lewin A:The role of ultrasonography in the evaluation of endometrial receptivity following assisted reproductive treatments: a critical review.Hum Reprod Update1996, 2:323-334.
3. Oliveira JBA, Baruffi RLR, Mauri AL, Petersen CG, Borges MC, Franco JG Jr: Endometrial ultrasonography as a predictor of pregnancy in an in-vitro fertilization programme after ovarian stimulation and gonadotrophin-releasing hormone and gonadotrophins.Hum Reprod1997,
12:2515-2518.
Table 4 Clinical outcome according to thickness grouping and combined grouping of thickness and pattern
Thickness grouping CPR Miscarriage rate CPR by pattern Aa CPR by pattern Ba Pb
Group1(n = 52) 23.1% 8.3% 11/45(24.4%) 1/7(14.3%) NS
Group2(n = 2349) 47.6% 8.9% 1047/2183(48%) 71/166(42.8%) NS
Group3(n = 495) 55.2% 6.6% 236/432(54.6%) 37/63(58.7%) NS
Pb < 0.01 NS < 0.01 < 0.05
-Endometrial thickness: Group 1:≤7 mm; Group 2: >7 to 14 mm; Group 3: >14 mm
Pattern A = triple-line pattern, hypoechoic endometrium with well-defined hyperechoic outer walls and central echogenic line
Pattern B = no-triple line pattern, isoechogenic or homogeneous hyperechoic endometrium with a poorly defined or absent central echogenic line CPR = clinical pregnancy rate
a
Pregnant cycles/total cycles and percentage of clinical pregnancies
b
P-values by chi-square text NS = not significant
Chenet al.Reproductive Biology and Endocrinology2010,8:30 http://www.rbej.com/content/8/1/30
4. Noyes N, Liu HC, Sultan K, Schattman G, Rosenwaks Z:Endometrial thickness appears to be a significant factor in embryo implantation in in-vitro fertilization.Hum Reprod1995,10:919-922.
5. Richter KS, Bugge KR, Bromer JG, Levy MJ:Relationship between endometrial thickness and embryo implantation, based on 1,294 cycles of in vitro fertilization with transfer of two blastocyst-stage embryos. Fertil Steril2007,87:53-59.
6. Al-Ghamdi A, Coskun S, Al-Hassan S, AL-Rejjal R, Awartani K:The correlation between endometrial thickness and outcome of in vitro fertilization and embryo transfer (IVF-ET) outcome.Reprod Biol Endocrinol2008,6:37. 7. Yuval Y, Lipitz S, Dor J, Achiron R:The relationships between endometrial
thickness, and blood flow and pregnancy rates in in-vitro fertilization. Hum Reprod1999,14:1067-1071.
8. Rashidi BH, Sadeghi M, Jafarabadi M, Nejad EST:Relationships between pregnancy rates following in vitro fertilization or intracytoplasmic sperm injection and endometrial thickness and pattern.Eur J Obstet Gynecol Reprod Biol2004,120:179-184.
9. Weissman A, Gotlieb L, Casper RF:The detrimental effect of increased endometrial thickness on implantation and pregnancy rates and outcome in an in vitro fertilization program.Fertil Steril1999,71:147-149. 10. Dietterich C, Check JH, Choe JK, Nazari A, Lurie D:Increased endometrial
thickness on the day of human chorionic gonadotropin injection does not adversely affect pregnancy or implantation rates following in vitro fertilization-embryo transfer.Fertil Steril2002,77:781-786.
11. Gonen Y, Calderon I, Dirnfeld M, Abramovici H:The impact of sonographic assessment of the endometrium and meticulous hormonal monitoring during natural cycles in patients with failed donor artificial insemination. Ultrasound Obstet Gynecol1991,1:122-126.
12. Check JH, Lurie D, Dietterich C, Callan C, Baker A:Adverse effect of a homogeneous hyperechogenic endometrial sonographic pattern, despite adequate endometrial thickness on pregnancy rates following in-vitro fertilization.Hum Reprod1993,8:1293-1296.
13. Järvelä IY, Sladkevicius P, Kelly S, Ojha K, Campbell S, Nargund G:Evaluation of endometrial receptivity during in-vitro fertilization using three-dimensional power Doppler ultrasound.Ultrasound Obstet Gynecol2005, 26:765-769.
14. Kovacs P, Matyas S, Boda K, Kaali SG:The effect of endometrial thickness on IVF/ICSI outcome.Hum Reprod2003,18:2337-2341.
15. Zhang XQ, Chen CH, Confino E, Barnes R, Milad M, Kazer RR:Increased endometrial thickness is associated with improved treatment outcome for selected patients undergoing in vitro fertilization-embryo transfer. Fertil Steril2005,83:336-340.
16. Chuang CC, Chen CD, Chao KH, Chen SU, Ho HN, Yang YS:Age is a better predictor of pregnancy potential than basal follicle-stimulating hormone levels in women undergoing in vitro fertilization.Fertil Steril2003, 79:63-68.
17. Yoeli R, Ashkenazi J, Orvieto R, Shelef M, Kaplan B, Bar-Hava I:Significance of increased endometrial thickness in assisted reproduction technology treatments.J Assist Reprod Genet2004,21:285-289.
18. Gonen Y, Capsper RF:Prediction of implantation by the sonographic appearance of the endometrium during controlled ovarian stimulation for in vitro fertilization (IVF).J In Vitro Fert Embryo Transfer1990,7:146-152. 19. Gonen Y, Casper RF, Jacobson W, Blankier J:Endometrial thickness and
growth during ovarian stimulation: a possible predictor of implantation in in vitro fertilization.Fertil Steril1989,52:446-450.
20. Shapiro H, Cowell C, Casper RF:The use of vaginal ultrasound for monitoring endometrial preparation in a donor oocyte program.Fertil Steril1993,59:1055-1058.
21. Coulam CB, Bustillo M, Soenksen DM, Britten S:Ultrasonographic predictors of implantation after assisted reproduction.Fertil Steril1994, 62:1004-1010.
22. Sundström P:Establishment of a successful pregnancy following in-vitro fertilization with an endometrial thickness of on more than 4 mm.Hum Reprod1998,13:1550-1552.
23. Noyes N, Hampton BS, Berkeley A, Licciardi F, Grifo J, Krey L:Factors useful in predicting the success of oocyte donation: a 3-year retrospective analysis.Fertil Steril2001,76:92-97.
24. Mercé LT, Barco MJ, Bau S, Troyano J:Are endometrial parameters by three-dimensional ultrasound and power Doppler angiography related to in vitro fertilization/embryo transfer outcome?Fertil Steril2008, 89:111-117.
doi:10.1186/1477-7827-8-30
Cite this article as:Chenet al.:Combined analysis of endometrial thickness and pattern in predicting outcome of in vitro fertilization and embryo transfer: a retrospective cohort study.Reproductive Biology and Endocrinology20108:30.
Submit your next manuscript to BioMed Central and take full advantage of:
• Convenient online submission
• Thorough peer review
• No space constraints or color figure charges
• Immediate publication on acceptance
• Inclusion in PubMed, CAS, Scopus and Google Scholar • Research which is freely available for redistribution