Table of Contents
pageThe Benefits of Automated Patch Management
. . . .2
Cost–Benefits Analysis
. . . .2
Summary
. . . .5
Automated Patch Management:
Business White Paper
Automated Patch Management: Impressive Return on Investment
The realities of today’s IT environment require that organi zations not only deploy more patches than ever before, but also that they do so with a greater degree of urgency .
Given these demands, it makes sense to implement an automated patch management solution . However, IT and security personnel inevitably need to justify such an investment . They need solid data that quantifies the cost savings and other benefits of automated patch management . This paper shows that, relative to a manual approach, an automated solution can reduce the annual cost of patching from US$222 to US$40 per computer, resulting in an expected savings of more than US$180,000 per year for an organization with 1000 computers .
Cost–Benefits Analysis
An analysis of the benefits of automated patch management includes many factors, not all of which are straightforward . The assumptions, choices and rationale provided in the following sections are based on the experience of the authors, the expertise of our developers and engineers, and on continuous feedback collected from our extensive customer base .
Overview of Benefits
Reduced administrator effort is the most significant quantifiable benefit of automated patch management . Organizations see this benefit after automating many steps of an intensive manual patching process . An automated solution offers greater effi ciency of operations by taking over many of the labor-intensive functions at each step in the process . Other benefits are more difficult to quantify, such as the ability to reme-diate vulnerabilities sooner through frequent cycles of the automated patch management solution . Doing so often saves organizations from successful attacks, but the actual number of such occurrences is ir-regular and unpredictable . Instead, the real value of such preventive measures is the risk reduction that yields a range of benefits: data and revenue security, protection of brand credibility and decreased risk of legal liability .
The potential magnitude of these benefits
is so great that objections to running more frequent patch manage-ment cycles (such as concerns about lost productivity) become relatively meaningless . Indeed, even a single successful attack could lead to the loss of millions of dollars, particularly if the incident receives any degree of public attention .
So, even though the benefits of automated patch management are sometimes difficult to measure, decision makers at every level can agree that such a solution saves time and money, increases enterprise security, protects the brand and frees valuable resour ces to pursue mission-crit-ical business goals . As helpful as large-magnitude qualitative benefits
The Benefits of
Automated Patch Management
It’s a simple truth: applying patches is the only definitive way to keep vulnerable systems from being exploited .
Accordingly, most organizations acknowledge the need for a formal patch management strategy and solution .
They clearly recognize the potential risk in the proliferation of new vulnerabilities and as sociated threats .
able to virtually any organization, it was built on the following scenario: There are 1,000 end-user computing stations split between two
sufficiently different builds (combinations of hardware, operating system and applications), and certain tasks must be performed independently for each group .
There is a moderate level of heterogeneity, with operating systems and applications from multiple vendors requiring a total number of patches approximately twice the annual average of patches encountered by a Microsoft-only shop (2×160=320) . However, risk analysis and shrewd planning result in the need to deploy only three-quarters of this number (240) .
The organization prefers to aggregate its patches and deploy them at regularly scheduled monthly intervals . However, they will conduct additional, off-cycle rollouts in critical situations (two per year) . When needed to supplement real-world data, estimates favored the man-ual approach . As a result, the actman-ual cost advantage that any given organi-zation derives from automated patch management is likely to be somewhat greater than what the model predicts .
The Findings
The model predicts that, due to a per-computer reduction in patch man-agement costs from US$222 to US$40 per year, an automated patch management solution will yield an annual savings of approximately US$182,000 . In other words, without even accounting for any of the additional benefits, automated patch management will provide a return on investment (ROI) of approximately 450 percent, essentially paying for itself in less than three months .
The largest contributions to these projected cost savings come from gains in the deploy ment step of the patch management process . Most of these gains are due to the ability of client-side agents to minimize distri-bution/installation errors and to facilitate any required troubleshooting . While deployment-related tasks are responsible for the greatest degree of savings, they are not the only ones that have an impact . Gains are
In addition to patch management, they can also facilitate inventory man-agement by identifying the software and hardware components residing on all managed systems .
Results Will Vary
The cost analysis model and savings pro jections of Table 1 are based on a wealth of experimental data . Nonetheless, a number of factors can affect the real-world outcome for any given organization . Some of the more significant factors include:
Size of organization
Degree of centralization and decentralization Level of administrator expertise
Diversity of operating systems Diversity of application portfolio Complexity of system configurationss Enterprise policies and procedures
In addition, the patch management product that is selected can be an-other potentially significant factor . By no means are they all created equal . For example, Micro Focus® ZENworks® Patch Management
fea-tures flexible system inventory capabilities, a streamlined patch deploy-ment wizard, and assessdeploy-ment and validation services that are based on patented Patch Fingerprinting Technology . Not all solutions share these capabilities . Nor will they all exhibit the advantages attributed to an agent-based architecture .
Even though the benefits of automated patch
management are sometimes difficult to measure,
decision makers at every level can agree that such a
solution saves time and money, increases enterprise
security, protects the brand and frees valuable resources
to pursue mission-critical business goals.
Business White Paper
Automated Patch Management: Impressive Return on Investment
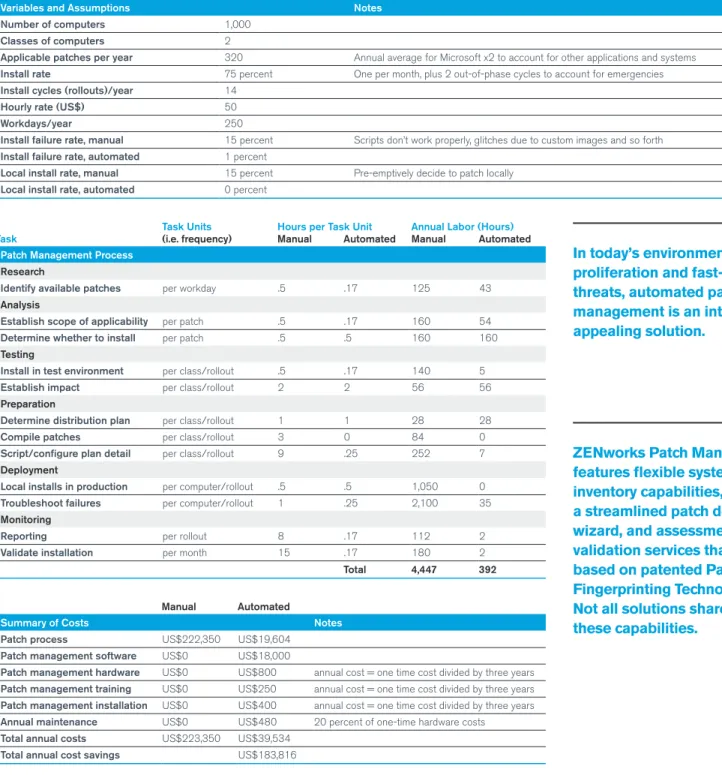
Table 1: Cost Comparison of Manual and Automated Patch Management
In today’s environment of risk
proliferation and fast-following
threats, automated patch
management is an intuitively
appealing solution.
ZENworks Patch Management
features flexible system
inventory capabilities,
a streamlined patch deployment
wizard, and assessment and
validation services that are
based on patented Patch
Fingerprinting Technology.
Not all solutions share
these capabilities.
Variables and Assumptions Notes
Number of computers 1,000
Classes of computers 2
Applicable patches per year 320 Annual average for Microsoft x2 to account for other applications and systems
Install rate 75 percent One per month, plus 2 out-of-phase cycles to account for emergencies
Install cycles (rollouts)/year 14
Hourly rate (US$) 50
Workdays/year 250
Install failure rate, manual 15 percent Scripts don’t work properly, glitches due to custom images and so forth
Install failure rate, automated 1 percent
Local install rate, manual 15 percent Pre-emptively decide to patch locally
Local install rate, automated 0 percent
Task Units Hours per Task Unit Annual Labor (Hours) Task (i.e. frequency) Manual Automated Manual Automated
Patch Management Process
Research
Identify available patches per workday .5 .17 125 43
Analysis
Establish scope of applicability per patch .5 .17 160 54
Determine whether to install per patch .5 .5 160 160
Testing
Install in test environment per class/rollout .5 .17 140 5
Establish impact per class/rollout 2 2 56 56
Preparation
Determine distribution plan per class/rollout 1 1 28 28
Compile patches per class/rollout 3 0 84 0
Script/configure plan detail per class/rollout 9 .25 252 7
Deployment
Local installs in production per computer/rollout .5 .5 1,050 0
Troubleshoot failures per computer/rollout 1 .25 2,100 35
Monitoring
Reporting per rollout 8 .17 112 2
Validate installation per month 15 .17 180 2
Total 4,447 392
Manual Automated
Summary of Costs Notes
Patch process US$222,350 US$19,604
Patch management software US$0 US$18,000
Patch management hardware US$0 US$800 annual cost = one time cost divided by three years
automation will reduce the annual cost to patch a single computer from US$222 to US$40 . This represents an annual savings of more than US$180,000 for an organization with 1,000 workstations .
About the Author
Mark Bouchard, CISSP, is the founder of Missing Link Security Services, LLC, a consulting firm specializing in information security and risk man-agement strategies . A former META Group analyst, Mark has assessed and projected the business and technology trends pertaining to a wide
About Micro Focus
Since 1976, Micro Focus has helped more than 20,000 custom-ers unlock the value of their business logic by creating enabling solutions that bridge the gap from well-established technologies to modern functionality . The two portfolios work to a single, clear vision—to deliver innovative products supported by exceptional cus-tomer service . www.microfocus.com
Micro Focus UK Headquarters United Kingdom +44 (0) 1635 565200 U.S. Headquarters Provo, Utah 801 861 4272 888 321 4272
Additional contact information and office locations: