Measuring Perceived Performance with Navigation Timing
Vivekanand BolajwarCompuware
Introduction
Fast and responsive web applications play highly important role in the ecosystem of commerce and consumer oriented industry. The world’s top web applications put huge amount of efforts in research and improvements to their web applications in order to be highly responsive.
This involves an in-depth analysis of multi-tier applications, which includes a performance-oriented analysis of each application in the technology stack, its sub-systems, and communication among these technology stacks.
Why is it important?
We have advanced tools and technologies available in order to analyze the performance of a web application from the server-side perspective. We also have wide range of tools available to measure the overall performance of the web application in a lab environment.
We mainly focus on the data we collect from our dedicated performance measurement teams who measure the performance of the web application in their lab environment and produce the performance metric based on certain assumptions.
But the actual reality could be different. For an end user, there could be a DNS response time increase, a client side code that’s blocking, or it could be the slower performance of the CDN that could impact the overall perceived performance of the web application. This user perceived performance was very difficult to measure, as the web application would be served across the globe on wide range of browser and operating system combinations.
As we do not have control over the browsers, browsers never report the good or bad performance of our web application back to us. We just hope that everything is synchronous at the end user, as we have assumed in our performance labs.
User Perceived Performance Metric
As the term explains itself, the User Perceived Performance metric is the data that provides the measurement of performance of a web application from the user’s perspective. It means these are the metrics coming from the ‘actual’ user using our web application in real life, from different geographical locations across the globe, and with varying other parameters like DNS servers, network infrastructure, CDN servers, nearest data centers, local ISP etc.
In order to measure such performance, there has to be something sitting right next to the user when the user is accessing our web application. And the best candidate for this work would be only the browser through which the web application is served. The browser needs to have a build-in performance measurement system that could listen to all the events from the point user puts in the URL of our web application in its address bar to the point where the web application is ready and loaded.
To solve this problem, the World Wide Web Consortium (also well known as W3C – an organization that develops standards for the web) has assigned a dedicated group ‘Web Performance Working Group’ to come up with new Navigation Timing standards.
The group has developed a new Navigation Timing proposition, which was drafted and reached CR (Candidate Recommendation) status during March 2011. It earned W3C Recommendation status in December 2012.
W3C Navigation Timing
According to Specification document [http://www.w3.org/TR/navigation-timing/], W3C Navigation Timing defines an interface for web applications to access timing information related to navigation and elements.
It talks about the current approach on how the user perceived latancy could be measured using JavaScript. It also explains why it is not the complete information that the web application needs. It introduces new interface, as shown below, which is not implemented by most of the latest browsers (including Google Chrome and Mozilla Firefox).
interface PerformanceTiming {
readonly attribute unsigned long long navigationStart; readonly attribute unsigned long long unloadEventStart; readonly attribute unsigned long long unloadEventEnd; readonly attribute unsigned long long redirectStart; readonly attribute unsigned long long redirectEnd; readonly attribute unsigned long long fetchStart;
readonly attribute unsigned long long domainLookupStart; readonly attribute unsigned long long domainLookupEnd; readonly attribute unsigned long long connectStart; readonly attribute unsigned long long connectEnd;
readonly attribute unsigned long long secureConnectionStart; readonly attribute unsigned long long requestStart;
readonly attribute unsigned long long responseStart; readonly attribute unsigned long long responseEnd; readonly attribute unsigned long long domLoading; readonly attribute unsigned long long domInteractive;
readonly attribute unsigned long long domContentLoadedEventStart; readonly attribute unsigned long long domContentLoadedEventEnd; readonly attribute unsigned long long domComplete;
readonly attribute unsigned long long loadEventStart; readonly attribute unsigned long long loadEventEnd; };
Source: http://www.w3.org/TR/navigation-timing/#sec-navigation-timing-interface
As the interface explains, the browser will privide an API to access the timings of a web application with wide range of parameters. Web applications can gather this data and send it back to the server for further analysis, and could be used for generating useful reports of user perceived performance.
NavigationStart: The time stamp when the navigation process starts. In simplified language, this is the time when user enters a web application URL in the address bar and asks the browser to load the application.
UnloadEventStart/End: The time required to unload the existing web application in order to load the new one. If user has started with blank page, this time would be zero.
RedirectStart/End: The time required to redirect the URL.
FetchStart: The time stamp when the web application starts loading.
DomainLookupStart/End: The time required to convert the domain name into an IP address of the web application.
ConnectStart/End: The time required to initiate the HTTP connection with the web application. SecureConnectionStart: The time required to initiate the HTTP connection over SSL.
RequestStart: The time stamp when request to web application was made.
ResponseStart/End: The time required to receive raw HTTP response from the web application. DOM* Events: The time required to parse the response, creating DOM elements, loading DOM contents and artifacts.
LoadEventStart/End: The time required to put web application in ‘ready’ state after which, user can now start interacting with the application.
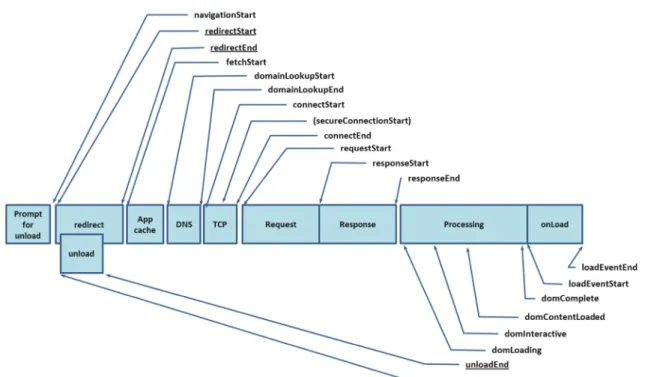
Figure 1: Timeline representation of W3C Navigation Timing. Source: http://www.w3.org/TR/navigation-timing/#processing-model
As shown in Figure 1, the timeline and sequence of occurrence of events are measured by the browser internally and then made available through window.performance.timing object in JavaScript.
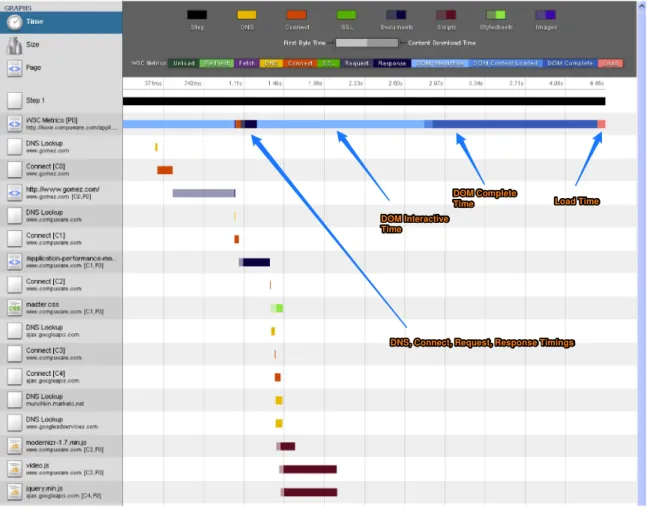
I have modified Webkit’s open source Web Developer Tools to show W3C timing data in the waterfall. I have decided to measure how much is user perceived time for www.gomez.com. As I visit the web application, it will be redirected to www.compuware.com helping us in getting redirect timings as well.
I am using Google Chrome to measure the performance data and feeding it to Web Developer Tools Waterfall tabs. The results turn out as shown in Figure 2.
Figure 2: Sample W3C Navigation Timing. Visited www.gomez.com DNS, Connect, Request, Response Timings DOM Interactive
Time
DOM Complete
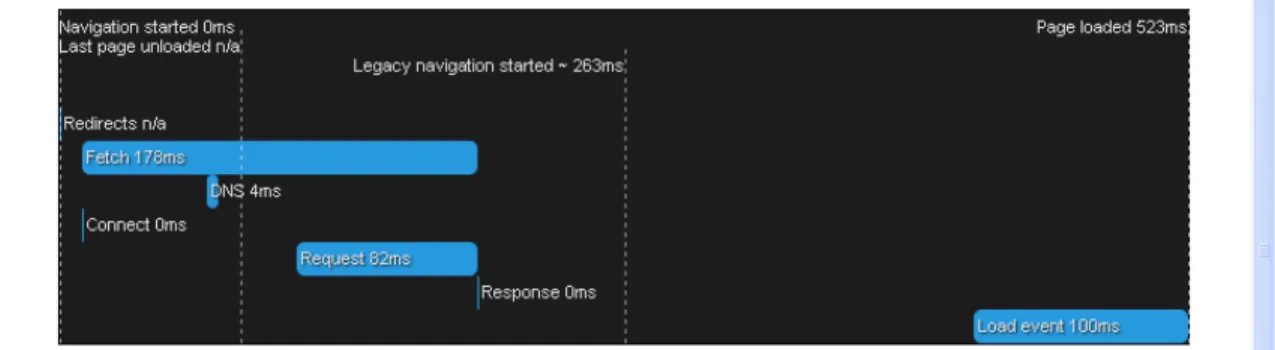
There is also an online testing web application, which could be used to gather the W3C Navigation Timing on any browser. I have used Mozilla Firefox this time to gather measurements. The results are shown in Figure 3.
Figure 3: Difference between legacy navigation timing and new W3C navigation timing capabilities
Here is the detailed data returned by Mozilla Firefox through W3C timings. As you can see in Figure 4, the legacy navigation timing was started much later and does not cover important events such as DNS lookup, redirection, unloading of existing web application, etc.
The data we have received above is phenomenal because this was never possible before! This gives us the real user perceived timing as if the user himself is giving the performance data back to us about the application. Using the navigation timing data, we could easily analyze client side performance bottlenecks and concentrate on solving, not just server side performance issues, but what happens at the client side as well.
The W3C Navigation Timing is still work in progress, as the Performance Group is working on other aspects of client side parameters as well. Good thing is, most of the browsers are implementing these APIs and making measurement of user perceived performance possible.
Summary
Measuring user perceived metric is entirely new paradigm in performance measurement technologies. This new paradigm will help in analyzing end-to-end performance of any system in a true sense. Propositions like W3C navigation timing is just a part of it and we have a long way to go from here. W3C timing APIs are here to stay and there is already a second version of the specification being worked upon by the performance group.
References
http://www.w3.org/TR/navigation-timing
http://blog.chromium.org/2010/07/do-you-know-how-slow-your-web-page-is.html https://developer.mozilla.org/en-US/docs/Navigation_timing