America’s High Tech Bust
A Report to the Washington Alliance of Technology Workers,
Communications Workers of America, Local 37083, AFL-CIO
Snigdha Srivastava Nik Theodore
Center for Urban Economic Development University of Illinois at Chicago
September 2004
Table of Contents
America’s High Tech Bust 1
Employment Data 2
Unemployment Data 4
Methodology 6
Appendix 1: List of Consolidated and Primary Metropolitan Statistical Areas 9
Appendix 2: The Metropolitan Boston Region 10
Appendix 3: The Metropolitan Chicago Region 12
Appendix 4: The Dallas Metropolitan Region 14
Appendix 5: The San Jose Metropolitan Region 16
Appendix 6: The San Francisco Metropolitan Region 18
Appendix 7: The Seattle Metropolitan Region 20
Acknowledgements
We would like to thank Marcus Courtney and Rich Feldman for their guidance and assistance with this research.
We would also like to acknowledge the Ford Foundation for its financial support of this study.
The UIC Center for Urban Economic Development
The mission of the Center for Urban Economic Development at the University of Illinois at Chicago (UIC-CUED) is to analyze disparities in the urban economy and their
implications for low-income and minority communities. UIC-CUED works in partnership with low-income and minority urban communities to devise strategies for job-centered development. Through specially constructed models of technical assistance, and engaged research with community organizations, labor unions, employers and government, UIC-CUED enters into long-term partnerships to conduct implementation research, to evaluate community development programs and strategies, and to translate lessons from practice into public policy.
Contact Information: Snigdha Srivastava UIC-CUED 322. S. Green St., #108 M/C 345 Chicago, IL 60607 Ph: 312-996-6336 Fax: 312-997-5766 Email: [email protected]
America’s High Tech Bust
This report examines the state of IT industry employment in the United States. Using data from the Current Employment Statistics (CES) survey and the Current Population Survey (CPS), we produce a comparative analysis of IT labor markets in six key metropolitan areas. This paper summarizes the results and describes the methodology.
Gross domestic product, the broadest indicator of economic activity, is up significantly since the third quarter of 2003 (Figure 1), productivity gains have been phenomenal, and the Dow Jones has been trading around 10,000.
And yet, regardless of the exuberance on Wall Street, not everything is rosy on Main Street. Unlike previous recovery cycles, this recovery is different: Payroll employment growth has been much weaker and the national unemployment rate still hovers just below 6%,
significantly higher than the 4% unemployment rate in 2001 (Figure 2).
Source: Bureau of Economic Analysis & Bureau of Labor Statistics
The gap between the “two economies”1– the rapidly growing economic sector (GDP,
productivity, and capital investment) and the sluggish labor market is especially pronounced in the information technology industry, where job dislocations due to ‘offshoring’ have contributed to an already hard-hit IT industry.
1 This term was used by Lawrence Mishel in an article entitled ‘A Tale of Two Economies,’ published by the
Economic Policy Institute (January, 2004).
Figure 1. Quarterly Percent Change in Real GDP (Seasonally Adjusted) -2.0 -1.0 0.0 1.0 2.0 3.0 4.0 5.0 6.0 7.0 8.0 2001 2002 2003 2004
Figure 2. National Unemployment Rate
4.0 4.5 5.0 5.5 6.0 6.5
The Business Cycle Dating Committee of the National Bureau of Economic Research (NBER), the organization that puts official dates on U.S. business cycles, announced that the 2001 recession officially ended in November of 2001. An analysis of IT industry
employment reveals that job losses have continued well after the end of the recession. While there is a lack of current and reliable information on the extent of job losses due to offshore outsourcing, there is little doubt that it has contributed to soaring unemployment rates in the industry. For instance, UIC-CUED analysis of the Current Population Survey reveals that national unemployment rates for computer programmers was 6.7% in 2003, two years after the end of the recession, compared to 2.5% in 2001. Incidentally, computer programming is also one of the top occupations sent offshore (ITAA, 2003).2
EMPLOYMENT DATA
Summary Findings – Despite recent aggregate monthly job growth numbers, there is little evidence of significant job expansion in the IT industry. IT industry employment changes reveal that nationally, between March 2001 (beginning of the recession) and April 2004 (the latest month for which revised data are available), the industry lost a whopping 403,300 jobs, of which 200,300 jobs were lost after the recession was officially declared over (Tables 1). Table 1. IT Industry Employment in Key Metropolitan Areas (Not Seasonally Adjusted)
Source: Current Employment Statistics survey, Bureau of Labor Statistics.
2 Information Technology Association of America – 2003 Workforce Survey. Presented at the National IT
Workforce Convocation (May, 2003).
3 Employment data for NAICS 5180 (ISPs, Web Search Portals and Data Processing) is not available for the
Boston PMSA and therefore undercounts total IT employment in the region.
4 Employment data for this series for the Chicago PMSA includes employment in NAICS 5180 (ISPs, Web
Search Portals, and Data Processing) and NAICS 5415 (Computer Systems Design and Related Services). It does not include NAICS 5112 (Software Publishing), for which employment data is unavailable.
5 Employment data for NAICS 5112 (Software Publishers) is not available for the Dallas PMSA.
6 Employment data for this series for the San Francisco PMSA includes employment in NAICS 5180 (ISPs,
Web Search Portals, and Data Processing) and NAICS 5415 (Computer Systems Design and Related Services). It does not include NAICS 5112 (Software Publishing), for which employment data is unavailable.
7 Employment data for NAICS 5180 is unavailable for the Seattle PMSA.
March
2001 November 2001 March 2002 March 2003 March 2004 April 2004
Nation 2,146,800 1,949,800 1,876,700 1,763,700 1,744,000 1,743,500
Boston, MA-NH PMSA3 71,200 59,100 55,500 48,700 46,700 46,900
Chicago, IL PMSA4 63,400 57,200 54,200 49,100 47,300 47,000
Dallas, TX PMSA5 56,300 50,000 47,000 42,800 39,100 39,300
San Jose, CA PMSA 92,500 75,900 70,200 64,500 61,500 61,900
San Francisco, CA PMSA6 54,900 37,300 33,100 29,500 27,900 28,000
Seattle-Bellevue-Everett, WA
PMSA7 59,200 54,500 52,800 50,400 52,700 52,800
Washington, DC-MD-VA-WV PMSA
It is worth noting that these numbers may well be an undercount of the actual impact of IT job losses as employment numbers for discrete sub-sectors of the IT industry are not available for several regions in the dataset. For example, employment data for the software publishing industry are not available for the Chicago, Dallas, and San Francisco PMSAs. Similarly, employment numbers are unavailable for the ISPs, web search portals and data processing industry for the Boston and Seattle PMSAs.
The employment situation is particularly bleak in the San Francisco PMSA, which witnessed a 49% job loss between March 2001 and April 2004 and a 25% job loss post-November 2001 (Table 2).
Table 2. Month-over-Month Change in IT Industry Employment (Percentage Decline)
Source: Current Employment Statistics survey, Bureau of Labor Statistics
Significant post-recession job losses also occurred in other regions with a large IT industry presence. San Jose and Boston lost 14,000 and 12,200 jobs, respectively between the official end of the recession in November 2001 and April 2004. Chicago and Dallas each lost about 10,000 jobs during this period, and Seattle has lost 6,300 IT industry jobs since the beginning of the recession and 1,700 jobs post-recession. Washington, D.C. is the only metropolitan area in the dataset, which despite losing 8,300 jobs during the recession, added 4,100 new jobs after the end of the recession.
8 Employment data for NAICS 5180 (ISPs, Web Search Portals and Data Processing) is not available for the
Boston PMSA and results in an undercount of the total IT employment in the region.
9 Employment data for NAICS 5112 (Software Publishing) is not available for the Chicago PMSA. 10 Employment data for NAICS 5112 (Software Publishers) is not available for the Dallas PMSA.
11 Employment data for this series for NAICS 5112 (Software Publishing) is not available for the San Francisco
PMSA.
12 Employment data for NAICS 5180 (ISPs, Web Search Portals and Data Processing) is unavailable for the
Seattle PMSA. March 2001 – April 2004 March 2001 – November 2001 (Recession) November 2001 – April 2004 (Post Recession) Nation -403,400 (-18.8%) -197,000 (-9.2%) -206,300 (-10.6%)
Boston, MA-NH PMSA8 -24,300 (-34.1%) -12,100 (-17.0%) -12,200 (-20.6%)
Chicago, IL PMSA9 -16,400 (-25.9%) -6,200 (-9.8%) -10,200 (-17.8%)
Dallas, TX PMSA10 -17,000 (-30.2%) -6,300 (-11.2%) -10,700 (-21.4%)
San Jose, CA PMSA -30,600 (-33.1%) -16,600 (-18.0%) -14,000 (-18.5%)
San Francisco, CA PMSA11 -26,900 (-49.0%) -17,600 (-32.1%) -9,300 (-24.9%)
Seattle-Bellevue-Everett, WA
PMSA12 -6,400 (-10.8%) -4,700 (-7.9%) -1,700 (-3.1%)
Washington,
UNEMPLOYMENT DATA
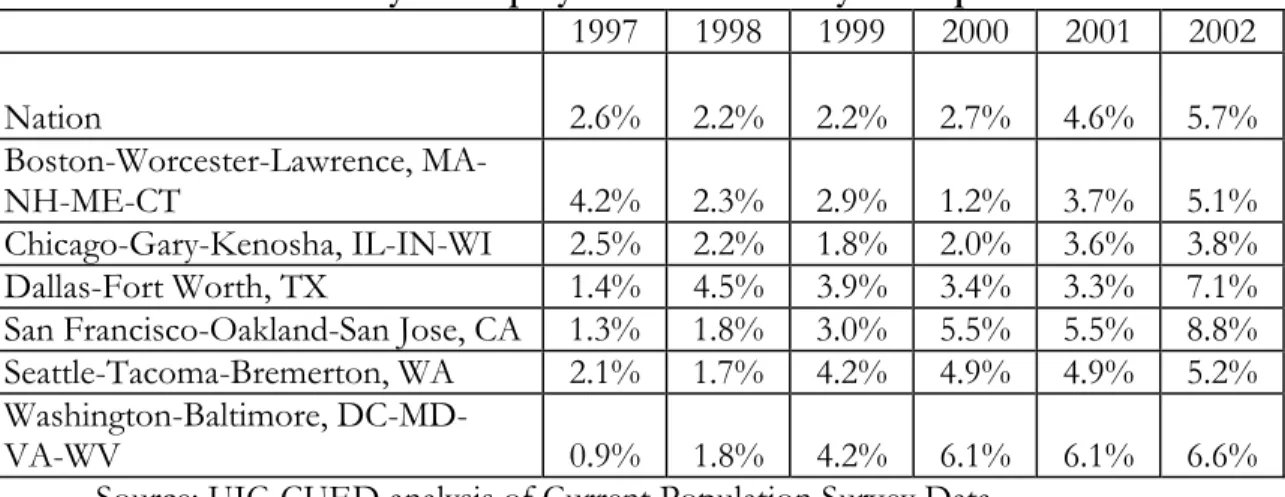
Summary Findings - Nationally, IT unemployment rates have been steadily increasing since 1998, peaking at 5.7% in 2002 (Figure 3). There also was a sharp escalation in unemployment rates between 2000 and 2001, which most likely can be explained by
sluggishness leading up to the onset of the 2001 recession as well as layoffs of workers who had been employed on Y2K conversion projects. However, unemployment rates continued to rise in 2002, well after the recession had been declared over.
Figure 3. National IT Industry Unemployment Rate (Three-Year Moving Average) 0.0 1.0 2.0 3.0 4.0 5.0 6.0 1997 1998 1999 2000 2001 2002 Unemployment Rate
Source: UIC-CUED analysis of Current Population Survey data
Regionally, there has been a sharp increase in IT industry unemployment rates in the San Francisco-Oakland-San Jose CMSA, where rates jumped from 1.8% in 1998 to 8.8% in 2002. Similar trends are seen in Seattle where rates increased from a low of 1.7% in 1998 to 5.2% in 2002.
Table 3. IT Industry Unemployment Rates in Key Metropolitan Areas 1997 1998 1999 2000 2001 2002 Nation 2.6% 2.2% 2.2% 2.7% 4.6% 5.7% Boston-Worcester-Lawrence, MA-NH-ME-CT 4.2% 2.3% 2.9% 1.2% 3.7% 5.1% Chicago-Gary-Kenosha, IL-IN-WI 2.5% 2.2% 1.8% 2.0% 3.6% 3.8% Dallas-Fort Worth, TX 1.4% 4.5% 3.9% 3.4% 3.3% 7.1%
San Francisco-Oakland-San Jose, CA 1.3% 1.8% 3.0% 5.5% 5.5% 8.8%
Seattle-Tacoma-Bremerton, WA 2.1% 1.7% 4.2% 4.9% 4.9% 5.2%
Washington-Baltimore,
DC-MD-VA-WV 0.9% 1.8% 4.2% 6.1% 6.1% 6.6%
Source: UIC-CUED analysis of Current Population Survey Data
Note: The unemployment rate is defined as the number of unemployed persons
(unemployed, on layoff + unemployed, looking for work) as a percentage of number of workers in the labor force (Total Persons – Persons Not in Labor Force). Unemployment rates do not include discouraged workers who are unemployed but are not actively seeking employment. They are, instead, counted as “not in the labor force” and as a result,
METHODOLOGY
Data on IT employment and unemployment were retrieved from the Current Employment Statistics (CES) survey and the Current Population Survey (CPS).
Employment - Employment data were retrieved from the 2001-2004 Current Employment Statistics (CES) survey for the following primary metropolitan statistical areas (PMSAs): Boston, MA-NH PMSA
Chicago, IL PMSA Dallas, TX PMSA
San Francisco, CA PMSA San Jose, CA PMSA
Seattle-Bellevue-Everett, WA PMSA Washington, DC-MD-VA-WV PMSA
The IT industry was defined to include the following North American Industry Classification System (NAICS) codes:
NAICS 5112 – Software Publishers
NAICS 5180 – ISPs, Web search Portals, and Data Processing NAICS 5415 – Computer Systems Design and Related Services
Unemployment - Unemployment data were retrieved from the 1996-2003 CPS Annual March Supplement to produce three-year moving average unemployment rates for 1997-200213 for the following six Consolidated Metropolitan Statistical Areas (CMSAs):14
Boston-Worcester-Lawrence, MA-NH-ME-CT Chicago-Gary-Kenosha, IL-IN-WI
Dallas-Fort Worth, TX
San Francisco-Oakland-San Jose, CA Seattle-Tacoma-Bremerton, WA
Washington-Baltimore, DC-MD-VA-WV
The summary statistics presented in this report reflect three-year moving averages and not single year estimates. Three-year averages have been chosen as the preferred method to reduce year-to-year volatility caused by small sample sizes at the sub-national level. The three-year moving average for a particular year has been calculated by taking the average of the value of the variable over the three-year period surrounding the year of interest. For instance, three-year moving average employment for 2001 is an average of employment in years 2000, 2001, and 2002.
13 The 2003 Annual Demographic Survey is the latest annual survey available from the CPS thus restricting the
availability of three-year moving average data beyond 2002.
14 Although the present CPS sample is a state-based design, the sample sizes are not sufficiently large to
produce reliable monthly statistical estimates for sub-national geographies. In an effort to improve the reliability of such estimates, the consolidated metropolitan statistical area (CMSA) was chosen as the
geographical unit for all CPS data retrievals, instead of the smaller PMSA, the unit at which the CES reports its sub-national data.
Note:Three-year moving averages for 2002 have been calculated by taking an average of the summary variables in years 2001, 2002, and 2003. The 2003 March Supplement industry classification is based on the 2002 NAICS,15 unlike the previous March Supplements, which
relied on the earlier SIC to classify industries. As a result, the 2002 three-year moving averages are not directly comparable with summary statistics from earlier years.
The information technology sector has been significantly revised under NAICS and is not directly comparable with the earlier Standard Industrial Classification (SIC)737 – Computer and Data Processing Services, which encompassed the core of information technology firms. This report relies on a crosswalk program created by the U.S. Census Bureau to identify the following industries that correspond with SIC 737:
NAICS 5112 – Software Publishers
(Corresponds with SIC 7372 – Software Publishers) NAICS 5415 – Computer Systems Design and Related Services
(Corresponds with SIC 7371 – Computer Programming Services
SIC 7373 (partially) – Computer Integrated Systems Design SIC 7376 – Computer Facilities Management Services SIC 7379 (partially) – Computer Related Services, NEC NAICS 5181 – Internet Service Providers
(Corresponds with SIC 7375 – Internet Service Providers and Internet Access Providers)
NAICS 5182 – Data Processing, Hosting & Related Services
(Corresponds with SIC 7374 – Computer Processing and Data Preparation and Processing Services)
Two small component sub-sectors of SIC 737 (SIC 7377 – Computer Rental and leasing and SIC 7378 – Computer Maintenance and Repair) have been excluded from this report due to lack of direct correspondence between these 4-digit SIC codes and 4-digit NAICS.16
Reliability of Summary Statistics: In any sample survey, variations in the data can occur by chance because a sample, rather than the whole of the population, is surveyed. The standard error is a measure of such potential variation. The chances are about 68 out of 100 that an
15 Beginning in 1997, the Standard Industrial Classification (SIC) was replaced by the North American Industry
Classification System(NAICS). This revision provides for newer industries, particularly in the service sector, and also reorganizes the categories on a production/process-oriented basis. This new, uniform, industry-wide classification system has been designed as the index for statistical reportng of all economic activities of the U.S., Canada, and Mexico. The two systems are not directly comparable. For instance, of the 1,170 NAICS
industries, 36% have direct SIC counterparts, 33% are significantly revised, and 31% are newly-created industries. Of these new NAICS industries, almost two-thirds have no comparable classification under SIC -
Minnesota Employment Review, September 2001. (http://www.mnwfc.org/lmi/review/0901supp.htm)
16 For instance, SIC 7377 corresponds partially with NAICS 5342, which includes not only computer rental and
leasing, but also heavy construction equipment rental and leasing, rental of railroad cars etc., which are outside the domain of information technology.
estimate from the survey differs from a figure that would be obtained from a complete census by less than one standard error. The chances are about 90 out of 100 that such a difference would be less than 1.6 standard errors. All population estimates in this report are significant at 1.6 or more standard errors.
Although the present CPS sample is a state-based design, the sample size of the CPS is sufficient to produce reliable monthly estimates at the national level only. The sample does not permit the production of reliable monthly estimates for the sub-national geographies. However, demographic, social, and economic detail is published annually for the census regions and divisions, all states and the District of Columbia, 50 large metropolitan areas, and selected central cities.
Appendix 1 – List of Consolidated and Primary Metropolitan Statistical Areas
CMSA PMSA CODE CODE
07 Boston-Worcester-Lawrence, MA-NH-ME-CT CMSA
1120 Boston, MA-NH17 (PMSA included in the current report)
1200 Brockton, MA 2600 Fitchburg-Leominster, MA 4160 Lawrence, MA-NH21 4560 Lowell, MA-NH21 4760 Manchester, NH 5350 Nashua, NH 5400 New Bedford, MA
6450 Portsmouth-Rochester, NH-ME (Maine portion notidentified) 9240 Worcester, MA-CT (Connecticut portion suppressed)
14 Chicago-Gary-Kenosha, IL-IN-WI CMSA (The Kankakee, IL and
Kenosha, WI PMSA's are not in sample)
1600 Chicago, IL (DeKalb County not in sample) (PMSA included in the current report)
2960 Gary-Hammond, IN
31 Dallas-Fort Worth, TX CMSA
1920 Dallas, TX (PMSA included in the current report) 2800 Fort Worth-Arlington, TX
84 San Francisco-Oakland-San Jose, CA CMSA (Santa Cruz-Watsonville,
CA PMSA not in sample)
5775 Oakland, CA
7360 San Francisco, CA (PMSA included in the current report) 7400 San Jose, CA (PMSA included in the current report) 7500 Santa Rosa, CA
8720 Vallejo-Fairfield-Napa, CA
91 Seattle-Tacoma-Bremerton, WA CMSA (Bremerton, WA PMSA not in
sample)
5910 Olympia, WA
7600 Seattle-Bellevue-Everett, WA (PMSA included in the current report) 8200 Tacoma, WA
97 Washington-Baltimore, DC-MD-VA-WV CMSA
0720 Baltimore, MD 3180 Hagerstown, MD
8840 Washington, DC-MD-VA-WV (West Virginia portion not identified
(PMSA included in the current report)
17 The New Hampshire portions of these PMSA’s are not individually identified; but they are collectively
Appendix 2 - THE METROPOLITAN BOSTON REGION
The IT industry employment18 in the Boston region plummeted from 71,200 to 46,900
between March 2001 (the beginning of the recession) and April 2004 (the latest month for which revised employment numbers are available). This decline of 24,300 jobs includes 12,200 jobs that were lost after the recession officially ended in November 2001 (Figure 1). Figure 1. IT Industry Employment (Seasonally Not Adjusted) in the Boston Region
Latest Data Available Beginning of Recession End of Recession 20,000 30,000 40,000 50,000 60,000 70,000 80,000
Mar-01 Mar-02 Mar-03 Mar-04
Figure 2. Percentage Decline in IT Industry Employment in the Boston Region
-35% -30% -25% -20% -15% -10% -5% 0% March'01-April'04 March'01-November'01 (Recession) November'01-April'04 (Post Recession) Nation Boston PMSA
18 For purposes of this study, the information technology industry was defined to include NAICS 5112
(Software Publishing), NAICS 5180 (ISPs, Web search Portals, and Data Processing) and NAICS 5415 (Computer Systems Design and Related Services). However, employment data for NAICS 5180 (ISPs, Web Search Portals and Data Processing) is not available for the Boston PMSA and results in an undercount of the total IT employment in the region.
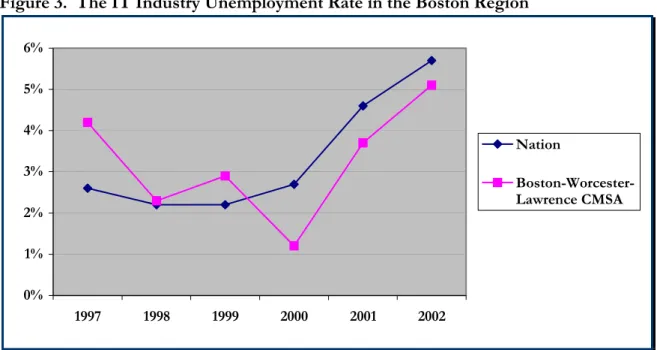
After the onset of the 2001 recession, the Boston region experienced steeper job losses compared to the nation (Figure 2). For instance, the region witnessed a 17% decline in employment during the recession, compared to a 9% decline for the nation. The region continued to lose jobs at a faster rate than the nation even after the official end of the recession. For instance, between November 2001 and April 2004, the Boston region witnessed a 21% decline in employment, compared to an 11% decline for the nation. TRENDS IN UNEMPLOYMENT RATE - The Boston region experienced a sharp upsurge in the IT industry unemployment rate, when the rate rose from 1.2% in 2000 to 5.1% in 2002. The region experienced sharper increases in the unemployment rate, compared to national unemployment trends, between 2000 and 2002 (Figure 3). Figure 3. The IT Industry Unemployment Rate in the Boston Region
0% 1% 2% 3% 4% 5% 6% 1997 1998 1999 2000 2001 2002 Nation Boston-Worcester-Lawrence CMSA
METHODOLOGY - To investigate the state of the information technology industry labor markets, UIC-CUED analyzed economic data from the Current Employment Statistics (CES) survey and the Current Population Survey (CPS) to produce a comparative analysis of key IT labor markets in the U.S. Employment data were retrieved from the 2001-2004 Current Employment Statistics (CES) survey and the unemployment data were retrieved from the 1996-2003 CPS Annual March Supplement to produce three-year moving average unemployment rates for 1997-2002.
For purposes of estimating the IT industry employment, the IT labor market was defined as the primary metropolitan statistical area (PMSA) in order to maintain consistency with the CES survey methodology that reports its numbers at the PMSA level. For the calculation of the IT industry unemployment rate, the IT labor market was defined as the larger consolidated
Appendix 3. THE CHICAGO METROPOLITAN REGION
The Chicago region lost 16,400 IT industry jobs since the onset of the recession in March 2001, including 10,200 jobs that were lost after the official end of the recession (Figure 1).19 Figure 1. IT Industry Employment (Seasonally Not Adjusted) in the Chicago Region
Latest Data Available Beginning of Recession End of Recession 20,000 25,000 30,000 35,000 40,000 45,000 50,000 55,000 60,000 65,000 70,000
Mar-01 Mar-02 Mar-03 Mar-04
Figure 2. Percentage Decline in IT Industry Employment in the Chicago Region
-30% -25% -20% -15% -10% -5% 0% March'01-April'04 March'01-November'01 (Recession) November'01-April'04 (Post Recession) Nation Chicago PMSA
19 For purposes of this study , the information technology industry was defined to include NAICS 5112
(Software Publishing), NAICS 5180 (ISPs, Web search Portals, and Data Processing) and NAICS 5415 (Computer Systems Design and Related Services). However, employment data for NAICS 5112 (Software Publishing) is not available for the Chicago PMSA and results in an undercount of the total IT employment in the region.
In terms of percentage job loss, the Chicago region fared slightly worse than the nation (Figure 2). For instance, between March 2001 and April 2004, the region witnessed a 26% job loss in the IT industry, compared to a 19% decline for the nation and job losses continued at a faster rate in the region even after the end of the recession.
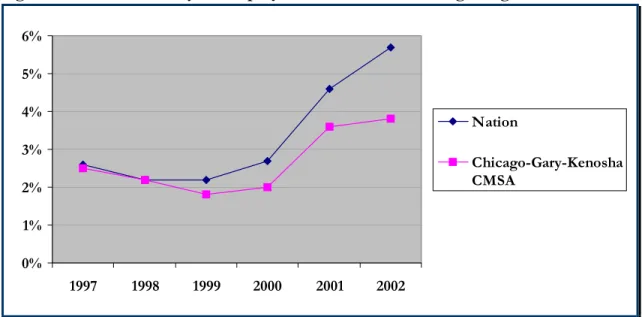
TRENDS IN UNEMPLOYMENT RATE - The IT industry unemployment rate in the Chicago region started edging up in 1999, peaking at 3.6% in 2002 (Figure 3). The 2002 unemployment rate, although lower than the national rate of 5.7%, was significantly higher than the 1.8% unemployment rate in 1999.
Figure 3. The IT Industry Unemployment Rate in the Chicago Region
0% 1% 2% 3% 4% 5% 6% 1997 1998 1999 2000 2001 2002 Nation Chicago-Gary-Kenosha CMSA
METHODOLOGY - To investigate the state of the information technology industry labor markets, UIC-CUED analyzed economic data from the Current Employment Statistics (CES) survey and the Current Population Survey (CPS) to produce a comparative analysis of key IT labor markets in the U.S. Employment data were retrieved from the 2001-2004 Current Employment Statistics (CES) survey and the unemployment data were retrieved from the 1996-2003 CPS Annual March Supplement to produce three-year moving average unemployment rates for 1997-2002.
For purposes of estimating the IT industry employment, the IT labor market was defined as the primary metropolitan statistical area (PMSA) in order to maintain consistency with the CES survey methodology that reports its numbers at the PMSA level. For the calculation of the IT industry unemployment rate, the IT labor market was defined as the larger consolidated
Appendix 4. THE DALLAS METROPOLITAN REGION
The IT industry20 in the Dallas region lost 17,000 jobs between March 2001 and April 2004.
Out of the total 17,000 jobs lost, 10,200 were lost after the official end of the recession (Figure 1).
Figure 1. IT Industry Employment (Seasonally Not Adjusted) in the Dallas Region
End of Recession Beginning of Recession
Latest Data Available
20,000 25,000 30,000 35,000 40,000 45,000 50,000 55,000 60,000
Mar-01 Mar-02 Mar-03 Mar-04
Figure 2. Percentage Decline in IT Industry Employment in the Dallas Region
-35% -30% -25% -20% -15% -10% -5% 0% March'01-April'04 March'01-November'01 (Recession) November'01-April'04 (Post Recession) Nation Dallas PMSA
20 For purposes of this study, the information technology industry was defined to include NAICS 5112
(Software Publishing), NAICS 5180 (ISPs, Web search Portals, and Data Processing) and NAICS 5415 (Computer Systems Design and Related Services). However, employment data for NAICS 5112 (Software Publishing) is not available for the Dallas PMSA and results in an undercount of the total IT employment in the region.
The Dallas region witnessed steeper job losses, compared to the nation, after the onset of the recession in March 2001 (Figure 2). For instance, the region saw a 30% job decline between March 2001 and April 2004 and a 21% decline between November 2001 and April 2004, compared to national declines of 19% and 11%, respectively.
TRENDS IN UNEMPLOYMENT RATE - The Dallas-Ft. Worth CMSA experienced a sharp escalation in the IT industry unemployment rate in 1997 when the rate increased from 1.4% to 4.5% in 1998 (Figure 3). Thereafter, the unemployment rate continued to decline gradually until 2001, when there was another sharp upswing and the rate more than doubled, reaching 7.1% in 2002.
Figure 3. The IT Industry Unemployment Rate in the Dallas Region
0% 1% 2% 3% 4% 5% 6% 7% 8% 1997 1998 1999 2000 2001 2002 Nation
Dallas-Ft. Worth CMSA
METHODOLOGY - To investigate the state of the information technology industry labor markets, UIC-CUED analyzed economic data from the Current Employment Statistics (CES) survey and the Current Population Survey (CPS) to produce a comparative analysis of key IT labor markets in the U.S. Employment data were retrieved from the 2001-2004 Current Employment Statistics (CES) survey and the unemployment data were retrieved from the 1996-2003 CPS Annual March Supplement to produce three-year moving average unemployment rates for 1997-2002.
For purposes of estimating the IT industry employment, the IT labor market was defined as the primary metropolitan statistical area (PMSA) in order to maintain consistency with the CES survey methodology that reports its numbers at the PMSA level. For the calculation of the IT industry unemployment rate, the IT labor market was defined as the larger consolidated
Appendix 5. THE SAN JOSE METROPOLITAN REGION
The San Jose metropolitan region saw some of the sharpest declines in the number of IT industry21 jobs in the nation. The IT industry employment fell from its peak of 92,500 in
March 2001 to 61,900 in April 2004, a loss of 30,600 jobs (Figure 1). The loss of jobs did not stem with the end of the recession – the region lost 14,000 jobs after the official end of the recession in November 2001.
Figure 1. IT Industry Employment (Seasonally Not Adjusted) in the San Jose Region
End of Recession Beginning of Recession
Latest Data Available
20,000 30,000 40,000 50,000 60,000 70,000 80,000 90,000 100,000
Mar-01 Mar-02 Mar-03 Mar-04
Figure 2. Percentage Decline in IT Industry Employment in the San Jose Region
-35% -30% -25% -20% -15% -10% -5% 0% March'01-April'04 March'01-November'01 (Recession) November'01-April'04 (Post Recession) Nation
San Jose PMSA
21 For purposes of this study, the information technology industry was defined to include NAICS 5112
(Software Publishing), NAICS 5180 (ISPs, Web search Portals, and Data Processing) and NAICS 5415 (Computer Systems Design and Related Services).
The San Jose region experienced much steeper job losses in the IT industry compared to the nation. For instance, the region lost 33% of the IT industry jobs between March 2001 and April 2004, and 19% of jobs between November 2001 and April 2004 (Figure 2). Even during the recession, the San Jose region witnessed an 18% job drop; almost double the rate of decline for the nation.
TRENDS IN UNEMPLOYMENT RATE - Although the Bay area IT industry
unemployment rate started rising in 1997, it experienced a sharp upswing in 1999 and again in 2001 when the rate rose from 5.5% to 8.8% in 2002 (Figure 3). The region’s
unemployment rate rose much faster compared to national trends, and the 2002
unemployment rate was much higher than the 5.7% national IT industry unemployment rate. Figure 3. The IT Industry Unemployment Rate in the San Francisco - San Jose Region 0% 1% 2% 3% 4% 5% 6% 7% 8% 9% 10% 1997 1998 1999 2000 2001 2002 Nation
San Francisco-San Jose-Oakland CMSA
METHODOLOGY - To investigate the state of the information technology industry labor markets, UIC-CUED analyzed economic data from the Current Employment Statistics (CES) survey and the Current Population Survey (CPS) to produce a comparative analysis of key IT labor markets in the U.S. Employment data were retrieved from the 2001-2004 Current Employment Statistics (CES) survey and the unemployment data were retrieved from the 1996-2003 CPS Annual March Supplement to produce three-year moving average unemployment rates for 1997-2002.
For purposes of estimating the IT industry employment, the IT labor market was defined as the primary metropolitan statistical area (PMSA) in order to maintain consistency with the CES survey methodology that reports its numbers at the PMSA level. For the calculation of the IT industry unemployment rate, the IT labor market was defined as the larger consolidated
Appendix 6. THE SAN FRANCISCO METROPOLITAN REGION
The IT industry22 in the San Francisco metropolitan region lost a whopping 49% jobs
between March 2001 and April 2004, with the employment slipping from 54,900 to 27,900 (Figure 1). The total jobs lost included 9,300 jobs (a 25% decline) that were lost after the recession ended in November 2001.
Figure 1. IT Industry Employment (Seasonally Not Adjusted) in the San Francisco Region
End of Recession Beginning of Recession
Latest Data Available
20,000 25,000 30,000 35,000 40,000 45,000 50,000 55,000 60,000
Mar-01 Mar-02 Mar-03 Mar-04
Figure 2. Percentage Decline in IT Industry Employment in the San Francisco Region -50% -45% -40% -35% -30% -25% -20% -15% -10% -5% 0% March'01-April'04 March'01-November'01 (Recession) November'01-April'04 (Post Recession) Nation
San Francisco PMSA
22 For purposes of this study, the information technology industry was defined to include NAICS 5112
(Software Publishing), NAICS 5180 (ISPs, Web search Portals, and Data Processing) and NAICS 5415 (Computer Systems Design and Related Services). However, employment data for NAICS 5112 (Software Publishing) is not available for the San Francisco PMSA.
San Francisco fared much worse than the nation in terms of average job losses. The region lost 49% of its IT industry workforce since the recession began in March 2001, which includes a 24% job loss since the end of the recession (Figure 2).
TRENDS IN UNEMPLOYMENT RATE - Although the Bay area IT industry
unemployment rate started rising in 1997, it experienced a sharp upswing in 1999 and again in 2001 when the rate rose from 5.5% to 8.8% in 2002 (Figure 3). The region’s
unemployment rate rose much faster compared to national trends, and the 2002
unemployment rate was much higher than the 5.7% national IT industry unemployment rate and significantly higher than the 1.8% unemployment rate the region experienced in 1997. Figure 3. The IT Industry Unemployment Rate in San Francisco – San Jose Region
0% 1% 2% 3% 4% 5% 6% 7% 8% 9% 10% 1997 1998 1999 2000 2001 2002 Nation
San Francisco-San Jose-Oakland CMSA
METHODOLOGY - To investigate the state of the information technology industry labor markets, UIC-CUED analyzed economic data from the Current Employment Statistics (CES) survey and the Current Population Survey (CPS) to produce a comparative analysis of key IT labor markets in the U.S. Employment data were retrieved from the 2001-2004 Current Employment Statistics (CES) survey and the unemployment data were retrieved from the 1996-2003 CPS Annual March Supplement to produce three-year moving average unemployment rates for 1997-2002.23
For purposes of estimating the IT industry employment, the IT labor market was defined as the primary metropolitan statistical area (PMSA) in order to maintain consistency with the CES survey methodology that reports its numbers at the PMSA level. For the calculation of the IT industry unemployment rate, the IT labor market was defined as the larger consolidated
metropolitan statistical areas (CMSA) in order to improve the reliability of the estimates.
23 2003 Annual Demographic Survey is the latest annual survey available from the CPS and this restricted the
Appendix 7. THE SEATTLE METROPOLITAN REGION
The Seattle region lost a total of 6,400 jobs since March 2001; this includes 1,700 jobs lost after the end of the recession. Although the region created 2,400 jobs since March 2003, it is still 1,700 jobs short of the 59,200 jobs in March 2001 (Figure 1).24
Figure 1. IT Industry Employment (Seasonally Not Adjusted) in the Seattle Region
End of Recession Beginning of Recession
Latest Data Available
20,000 25,000 30,000 35,000 40,000 45,000 50,000 55,000 60,000 65,000
Mar-01 Mar-02 Mar-03 Mar-04
Figure 2. Percentage Decline in IT Industry Employment in the Seattle Region
-20% -18% -16% -14% -12% -10% -8% -6% -4% -2% 0% March'01-April'04 March'01-November'01 (Recession) November'01-April'04 (Post Recession) Nation Seattle PMSA
24 For purposes of this study, the information technology industry was defined to include NAICS 5112
(Software Publishing), NAICS 5180 (ISPs, Web search Portals, and Data Processing) and NAICS 5415 (Computer Systems Design and Related Services). However, employment data for NAICS 5180 (ISPs, Web search Portals, and Data Processing) is not available for the Seattle PMSA and results in an undercount of the IT industry employment in the region.
The IT industry job losses in the Seattle region have been less severe than the rest of the nation. Overall, the region lost 11% of its IT workforce since March 2001, compared to a 19% loss for the nation (Figure 2). Similarly, both during the recession and post-recession, Seattle saw slower job declines than the nation. However, Seattle still has not made up for the jobs it lost after March 2001.
TRENDS IN UNEMPLOYMENT RATE - The IT industry unemployment rate in the Seattle region started edging upward in 1998, much before the national IT industry
unemployment rate. In fact, the biggest surge took place in 1998 when the unemployment rate more than doubled from 1.7% to 4.2% between 1998 and 1999. The unemployment rate continued to edge upward, peaking at 5.2% in 2002, just below the national IT industry unemployment rate of 5.7%.
Figure 3. The IT Industry Unemployment Rate in the Seattle Region
0% 1% 2% 3% 4% 5% 6% 1997 1998 1999 2000 2001 2002 Nation Seattle-Tacoma-Bremerton CMSA
METHODOLOGY - To investigate the state of the information technology industry labor markets, UIC-CUED analyzed economic data from the Current Employment Statistics (CES) survey and the Current Population Survey (CPS) to produce a comparative analysis of key IT labor markets in the U.S. Employment data were retrieved from the 2001-2004 Current Employment Statistics (CES) survey and the unemployment data were retrieved from the 1996-2003 CPS Annual March Supplement to produce three-year moving average unemployment rates for 1997-2002.
For purposes of estimating the IT industry employment, the IT labor market was defined as the primary metropolitan statistical area (PMSA) in order to maintain consistency with the CES survey methodology that reports its numbers at the PMSA level. For the calculation of the IT industry unemployment rate, the IT labor market was defined as the larger consolidated
Appendix 8. THE WASHINGTON, D.C. METROPOLITAN REGION
The Washington, D.C. metropolitan region lost 8,300 IT industry25 jobs during the 2001
recession. However, it gained 4,100 new jobs after the end of the recession in November 2001, resulting in a net loss of 4,200 jobs since March 2001 (Figure 1).
Figure 1. IT Industry Employment (Seasonally Not Adjusted) in the Washington D.C. Region
End of Recession Beginning of
Recession
Latest Data Available
100,000 120,000 140,000 160,000 180,000
Mar-01 Mar-02 Mar-03 Mar-04
Figure 2. Percentage Decline in IT Industry Employment in the Washington D.C. Region -20% -15% -10% -5% 0% 5% March'01-April'04 March'01-November'01 (Recession) November'01-April'04 (Post Recession) Nation Washington D.C. PMSA
25 For purposes of this study, the information technology industry was defined to include NAICS 5112
(Software Publishing), NAICS 5180 (ISPs, Web search Portals, and Data Processing) and NAICS 5415 (Computer Systems Design and Related Services).
The Washington, D.C. region is the only metropolitan region in the study that created net new jobs after the end of the recession, resulting in a 2.5% IT industry job gain since
November 2001. This is in sharp contrast with national and other metropolitan trends where job losses continued at a rapid rate even after the recession officially ended in November 2001.
TRENDS IN UNEMPLOYMENT RATE - Since 1999, the IT industry unemployment rate in the Washington, D.C. region has hovered above the national rate. The region
experienced the biggest jump in the unemployment rate between 1997 and 2000, when the rate increased six-fold from 0.9% to 6.1%. The unemployment rate continued to edge slowly upward even after 2000, peaking at 6.6% in 2002.
Figure 3. The IT Industry Unemployment Rate in the Washington D.C. Region
0% 1% 2% 3% 4% 5% 6% 7% 1997 1998 1999 2000 2001 2002 Nation Washington D.C.-Baltimore CMSA
METHODOLOGY - To investigate the state of the information technology industry labor markets, UIC-CUED analyzed economic data from the Current Employment Statistics (CES) survey and the Current Population Survey (CPS) to produce a comparative analysis of key IT labor markets in the U.S. Employment data were retrieved from the 2001-2004 Current Employment Statistics (CES) survey and the unemployment data were retrieved from the 1996-2003 CPS Annual March Supplement to produce three-year moving average unemployment rates for 1997-2002.
For purposes of estimating the IT industry employment, the IT labor market was defined as the primary metropolitan statistical area (PMSA) in order to maintain consistency with the CES survey methodology that reports its numbers at the PMSA level. For the calculation of the IT industry unemployment rate, the IT labor market was defined as the larger consolidated