English, Lyn D., Hudson, Peter B., & Dawes, Les A. (2012) Engineering design processes in seventh-grade classrooms: bridging the engineering education gap. European Journal of Engineering Education, 37(5), pp. 436-447.
This file was downloaded from: http://eprints.qut.edu.au/55618/
c
Copyright Taylor & Francis 2012
Notice: Changes introduced as a result of publishing processes such as copy-editing and formatting may not be reflected in this document. For a definitive version of this work, please refer to the published source:
Engineering design processes in seventh-grade classrooms: Bridging the engineering education gap
Lyn D. English, Peter B. Hudson, and Les Dawes
Lyn D. English* ([email protected]) and Peter B. Hudson ([email protected]) School of Mathematics, Science, and Technology Education, Faculty of Education, S Block, Victoria Park Rd., Kelvin Grove, Brisbane, Queensland, Australia, 4059. Ph 617 31383329
(English); 617 31383345 (fax 617 31383985)
Les Dawes ([email protected])
School of Urban Development, Faculty of Built Environment and Engineering, GPO Box 2434, Brisbane, Ph 617 31382776; fax 617 31381170
Abstract
This paper reports on some findings from the first year of a three-year longitudinal study in which seventh- through ninth-graders were introduced to engineering education. Specifically, we address students’ responses to an initial design activity involving bridge construction, which was implemented at the end of seventh grade. We address how students created their bridge designs and applied these in their bridge constructions; their reflections on their designs; their reflections on why the bridge failed to support increased weights during the testing process; and their suggestions on ways in which they would improve their bridge designs. Our findings include identification of six, increasingly sophisticated levels of illustrated bridge designs, with designs improving between the classroom and homework activities of two focus groups of students. Students’ responses to the classroom activity revealed a number of iterative design processes, where the problem goals, including constraints, served as monitoring factors for students’ generation of ideas, design thinking, and construction of an effective bridge.
1. Introduction
Many nations are expressing concerns over the current state of science, technology,
engineering, and mathematics (STEM) education, especially given the increased demand for, and declining supply of, skilled workers in these fields. Of particular concern is the skills shortage across engineering fields. The number of graduating engineers from U.S.
institutions, for example, has declined in recent years, (OECD, 2006), while in Australia, the number of engineering graduates per million lags behind many other OECD countries (Taylor, 2008). To complicate matters, engineering does not have a high public profile in many nations. For example, in a recent report, Engineering our Future
(www.nationalgrid.com), it was revealed that while there is a cursory acceptance of engineers and engineering among young people, parents, and teachers in the UK, there are negative perceptions underlying this acceptance, such as a lack of knowledge and appreciation of the role of engineering in society.
One response to the above concerns is the inclusion of engineering education during the K-12 school years, which has important implications for the future of STEM education more broadly (Katehi, Pearson, & Feder, 2009). As the National Research Council (2009)
highlighted, it takes years or decades to build the capabilities required by societies: “You need to generate the scientists and engineers, starting in elementary school and middle school” (p. 9).
In our efforts to improve STEM education in the middle school, we implemented a three-year longitudinal study across grade levels 7-9 in three schools. In this paper, we report on findings from an engineering design activity involving bridge construction, which was implemented towards the end of the first year of the project. Specifically, we were interested in:
How students created their bridge designs and applied these in their bridge construction;
Their reflections on their designs, including why they considered these would work;
Their reflections on the point at which their bridge failed and reasons for this; and
Their suggestions on ways in which they would improve their bridge design. 2. Engineering design processes in K-12 education
Engineering education is an emerging and promising approach to preparing students for the world of tomorrow (Cunninghman & Hester, 2007; Dawes & Rasmussen, 2007; English & Mousoulides, 2011; Zawojewski, Hjalmarson, Bowman, & Lesh, 2008). In addition to fostering an appreciation and understanding of engineering in society, engineering education contextualises mathematics and science principles, and promotes design processes.
It has been noted frequently that an understanding of engineering design processes is at the centre of engineering (e.g., Cunningham & Hester, 2007), together with the creation, application, and adaptation of mathematical/scientific models that that can be used to interpret, explain, and predict the behaviour of complex systems (English & Mousoulides, 2011; Zawojewski et al., 2008). The cyclic processes of modelling and design are very similar: a problem situation is interpreted; initial ideas (initial models, designs) for solving the problem are called on; a promising direction is selected and expressed in an experimental form; the idea is tested and resultant information analysed and used to revise (or reject) the idea; the revised (or a new) idea is expressed in an experimental form; and the cyclic process is repeated until the idea (model or design) meets the constraints specified by the problem (Zawojewski et al., 2008).
Addressing engineering design processes as part of the middle school mathematics and science curriculum can significantly enhance students’ problem-solving abilities (Borgford-Parnell, Deibel, & Atman, 2010). Borgford-Parnell et al. (2010) note that design often involves working on complex and ill-structured problems that feature ambiguity, multiple solutions, and few, if any, defined rules. The importance of middle school students working on challenging and motivating learning experiences with high cognitive demand is stressed in the literature (e.g., Silver, Mesa, Morris, Star & Benken, 2009).
Design-based approaches to identify and solve engineering problems can enrich the broader school curriculum in that they: (1) are highly iterative, (2) are open to the idea that a problem may have more than one possible solution, (3) provide meaningful contexts for learning mathematical, scientific, and technological concepts, and (4) provide a stimulus for appreciating and dealing with complex systems, including engaging in mathematical
modelling and analysis (Borgford-Parnell et al., 2010; Katehi et al., 2009). There can be different approaches to implementing engineering design processes within schools.
A well-established program, Engineering is Elementary, (Hester & Cunningam, 2007; www.mos.org/eie) comprises activities addressing engineering disciplines, science topics, and design challenges. Each of the activities focuses on a basic engineering design process of ask, imagine, plan, create, and improve. In emphasising this design process, the program aims to help students apply mathematics and science in solving engineering problems, understand the fundamental role of materials and their properties in solving these problems, and foster creativity and in-depth thinking as students address obstacles and constraints.
Another related approach to engineering education in schools is project-based learning (PBL), where students engage in the totality of a problem-solving process (e.g., Borgford-Parnell et al., 2010; Kolmos, Fink, & Krough, 2004). A PBL approach provides students with authentic engineering design experiences, capitalising on collaboration for solving real-world
problems and opportunities to reflect on the design processes. The approach to implementing engineering design processes in the present study can be considered one form of PBL. 3. Methodology
3.1 Participants
Five middle school classes and their teachers from three Australian schools (one all boys school, one all girls, and one co-educational) participated in a three-year longitudinal study, from the seventh- through to ninth-grade (2009-2011). For the first year of the study, the entire cohort of students (grades 7-9) participated in two of the schools, while only one small class participated in the all girls school. For practical reasons, we could only gather in-depth data from two classes at the co-educational school (n=58 during the first year), two classes at the all boys school, and the one class at the all girls’ school. For the activity we report on here, we have chosen to restrict our paper to the two classes of seventh-grade students (11-12 years) at the co-educational school, primarily because in one of these classes, the teacher gave her students an additional homework task to consolidate and extend their learning. In each of these two classes, two focus groups (n=4 per group) of mixed achievement levels were selected by the teachers for our in-depth analysis of student learning.
3.2 Procedures and learning experiences
The aims of the three-year study included designing and implementing engineering-based problem-solving activities in the middle school, which drew upon the school’s existing mathematics and science curricula (based on state guidelines), and introducing students and their teachers to foundational engineering ideas, principles, and design processes. At the commencement of the project, the students were informed on the nature of the engineering experiences they would be undertaking and how these would enable them to apply their mathematics and science learning for solving real-world engineering problems.
The project team worked with the classroom teachers in developing a range of engineering problem-solving booklets, which the students completed in small groups. We also developed comprehensive teaching notes, which supplemented the teachers’ existing knowledge of bridge design and construction. Each student in each group was given his/her own booklet in which to record their responses. In the first year of the study, the teachers introduced their students to the world of engineering and explored the different roles and societal responsibilities of engineers (two lessons of approx. 45 minutes duration). This activity was followed by 5–7 lessons that investigated bridge designs and their construction. These activities, including engineering websites and an engineering DVD, entailed:
Learning about the work of civil engineers.
Exploring bridge structure with a focus on the main types of bridges in the students’ home city.
Recognizing features/constraints of the main bridge types.
Investigating tension and compression, load distribution, reinforcement, strength, and their importance in bridge designs. Here, students explored load distribution and strength where they identified that a truss bridge has beams supported by simple triangular units, which was further related to Pythagoras’s Theorem, and how right-angled triangles can strengthen this support. Students tested triangles and squares using straws to determine the strongest shapes and discovered that triangles were better at distributing loads. Students also observed pictures and videos of bridges containing triangular shapes (e.g., Sydney Harbour Bridge). The students were asked to think about how they could apply these findings to their bridge design.
Describing, designing, and constructing a truss bridge with given constraints and materials.
Documenting and reflecting on the engineering design processes they used in constructing their bridge; and finally, reporting back to their class peers explaining the steps to designing and building their model bridge, including what they could have done to improve their bridge.
In presenting the bridge activity, we used the scenario of two graduate engineers requiring assistance in designing a bus bridge across the city’s river. Students were reminded of the importance of design objectives and constraints. These included a span distance of 150 metres, the need to support the most weight for the vehicles that will pass over the bridge, the importance of not disturbing the river’s fish and not obstructing normal watercraft, and the requirement that the bridge must be at least 12 metres above water level. Each group of students was given the following resources: 20 plastic drinking straws, sticky tape, scissors, ruler, small container, and metal washers. A cardboard road bed was later added. The students were instructed to meet the following design constraints:
(a) To test for the load of the vehicles, your bridge must have a place to securely hold a small cup loaded with steel washers in the centre of the span;
(b) To take into account the environmental limitations on the design, no part of the bridge may touch the “water” (or bottom of the wooden support structure);
(c) Books will be used to support your bridge at either end and the bridge cannot metal be taped to them.
The students were advised to spend time planning and creating their model bridges,
generating ideas, drawing sketches, making plans, and taking measurements before the actual construction. The students were encouraged to create their own designs in planning their bridge construction.
Before testing the strength of their bridges (using metal washers), the students were to predict the number of washers it would take for the bridge to collapse. The students used estimation to make a prediction, beginning with sets of 10 loose washers.
In one of the two, seventh-grade classrooms in the co-educational school addressed here, the teacher chose to extend the classroom bridge construction activity by presenting the students with a homework assignment displayed in the Appendix. The homework was designed as an assessment piece and for students to consolidate engineering concepts learnt from the classroom activities. It also allowed students to advance their understandings with possibilities of further research and interactivity with others. Indeed, various students had indicated previously that they had a relative (e.g., parent, uncle) who worked as an engineer, which lead to the prospect of further engagement outside school for developing their
conceptual understandings. 3.3 Data collection and analysis
The two focus groups (four students per group) in each of the two classes were video and audio recorded. The remaining non-focus groups were only video and audio recorded when they reported back to the whole class. All whole class discussions were recorded. Written artefacts of all student groups in each class were collected and scanned, and digital photographs were taken of all the students’ bridge constructions. The video and audio
recordings were subsequently transcribed verbatim, with any relevant non-verbal expressions noted from the video component, such as frustration or enjoyment in the challenge.
Data were drawn from all of the above, with ethno-methodological interpretive practices (Erikson, 1998) employed for the analysis of the data. Using iterative refinement cycles for analyses of students’ learning (Lesh & Lehrer, 2000), the transcripts of the focus groups were reviewed many times by the first author in conjunction with their artefacts and class presentations. The two focus groups’ responses to the additional homework activity of
one of the classes were analysed in conjunction with their in-class group discussions. The second and third authors were consulted during these analyses phases as the data were coded and examined for patterns and trends using constant comparative strategies (Strauss & Corbin, 1990). The iterative nature of the data analysis, with input from the other authors, enabled data interpretations to be validated (i.e., repeatedly tested, refined, and extended; Lesh & Lehrer, 2000).
The analysis of the students’ bridge illustrations yielded a number of key features that suggested increasingly sophisticated levels of design, as discussed in the next section. These features included: (a) drawings of actual resources used, such as a pile of books; (b) absence of mathematical shapes (e.g., triangle or rectangle) or patterns; (c) evidence of structural features, such as trusses drawn; (d) use of labelling (e.g., “top view;” “side view”); (e) written additional information, such as measurements, identification of the bridge’s structural
components (e.g., “trusses”); and (f) the number of bridge perspectives displayed.
A number of key design processes emerged from the iterative analysis of the transcripts of the students’ actual bridge construction. These included: creating the design, interpreting the design, being aware of constraints, and creating, testing, and refining products. As indicated in the findings, these design processes were found to be interactive.
Of interest in the data reported here are:
1. The nature of the focus groups’ illustrated designs in the classroom activity and how the illustrated designs of the focus groups in one class changed between their classroom and their homework activities;
2. The design processes evident as the focus groups in both classes worked on the activity; and
3. Case studies of two focus groups on their homework activity. 4. Findings
4.1 Illustrated bridge designs
Students’ illustrated bridge designs were recorded as part of both the classroom activity and the homework activity. The key features that emerged from the analysis of these designs suggested six levels of increasing sophistication, as identified by the first author and refined by the remaining authors. The levels were as follows:
Level 1
Designs at this level were simplistic illustrations, comprised of basic drawings that presented potential resources, such as books at either end of the bridge design; there was no attention to relevant mathematical shapes (e.g., triangle or rectangle).
Level 2
Level 2 designs comprised basic structural illustrations of trusses or other recognisable mathematical shapes or patterns; there was no labelling at this level.
Level 3
This level incorporated a level 2 design, but presented labels such as “top view,” “design,” and “actual bridge”.
Level 4
These designs comprised structural diagrams displaying additional information, such as measurements, instructions, material labels, procedural information, and bridge structure labels (e.g., “trusses”, “road”, “side of bridge”).
Level 5
This was a level 4 design but included two or more views of the bridge. Level 6
This level extended level 5 by including structural labels accompanied by material labels, such as “truss (straws)”, “road (cardboard)”. Figure 1 displays an example of this level.
INSERT FIGURE 1 ABOUT HERE
For the classroom activity, of the 15 (out of 16) focus group students in both classes who created an illustrated bridge design, three were at level 1, eight at level 2, three at level 3, and one at level 4. Although the students were instructed to draw sketches, make plans, and take measurements prior to constructing their bridge, their classroom designs were mostly at a low level of sophistication. This might have been primarily due to the students’ focus on their actual bridge construction at the expense of developing a more detailed illustrated design. Furthermore, this was the students’ first engineering construction and the teachers’ first experience in implementing engineering education, so perhaps sufficient instruction was not provided to the students on how to develop their illustrated engineering designs. On the other hand, as previously noted, we devised the tasks such that the teachers’ input was minimal as wanted to encourage creative and independent work by the students.
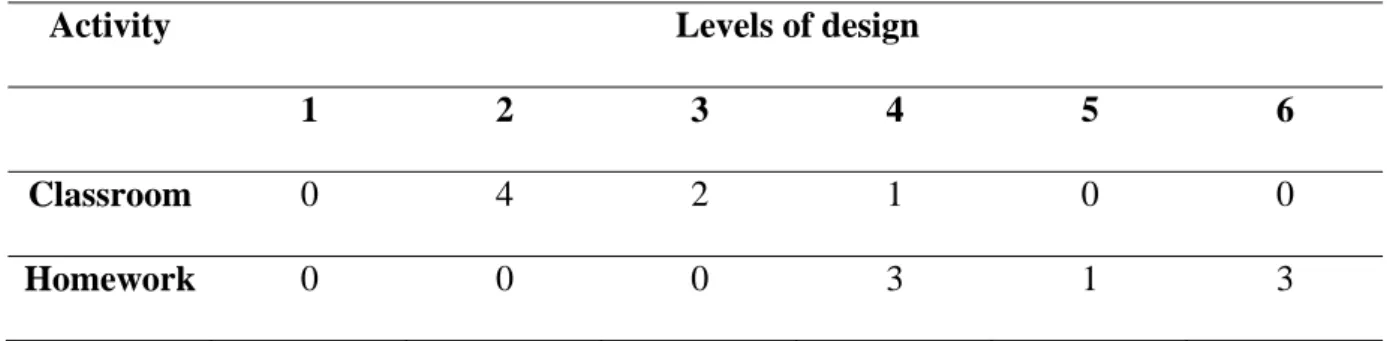
Interestingly, when one of the classes completed the homework assignment, there was a substantial increase in sophistication of their illustrated bridge designs. As displayed in Table 1, seven of the eight students in the two focus groups produced designs of at least level 4 (the eighth student was excluded as he omitted his design in the classroom activity).
INSERT TABLE 1 ABOUT HERE
There are several possible reasons for this improvement. First, although the classroom activity instructed the students to generate ideas, draw (labelled) sketches, make plans, and take measurements before constructing their bridge, the homework assignment highlighted the need to do a labelled diagram of the bridge and the materials used. It was possible that the latter instruction with its focus on labelling and including materials prompted the students to pay greater attention to their illustrated design. Second, the homework assignment engaged the students in reflecting on their design and model bridge construction, which might have prompted more attention to detail. Third, given that the activity was a homework assignment,
the students might have allocated more time to their bridge designs. Other factors, such as adult involvement (e.g., Hoover-Dempsey et al., 2001), cannot be dismissed here, warranting further research to identify the degree of input from outside sources for advancing aspirations for engineering.
4.2 Design processes
From the analysis of the focus groups’ responses to the classroom activity in the two classes, it was apparent that the students progressed through a number of iterative design processes. The complex, iterative nature of these processes encompassed more than is typically displayed in the common “one main loop” engineering design process diagrams (e.g., Massachusetts Science and Technology/Engineering Curriculum Framework, 2006). As displayed in Figure 2, the constraints placed on bridge construction served as monitoring factors in students’ planning and construction of their bridge. Students devoted considerable time in creating, interpreting and critiquing their design, testing it, and modifying it where necessary. In addition, their iterative design processes were evident in their construction, testing, and refining of their bridge model.
INSERT FIGURE 2 ABOUT HERE
To illustrate these design processes, we analysed one focus group’s interactions. This group (Nina, Jodie, Matt, and John) commenced the activity by trying to estimate how far apart the testing blocks should be placed (after measuring with a ruler), for which Jodie stated, “So 7 cm each side, that will be good so just make it roughly three (straws)”. Nina intervened, reminding the group for the need of a design:
Nina: So what exactly is our design?
Jodie: I haven’t figured it out yet... we need to design it first.
Matt: We could go like this (shows two straws joined at apex) along there (indicating across the span) and then we could put triangles....
Jodie: No, let’s draw it first so we can actually understand it ‘cause you playing with the straws aren’t helping me.
Students need to be aware of other’s learning needs. In this case, Matt presented
himself as a tactile kinaesthetic learner where manipulating materials aided his articulation of ideas. However, Jodie noted Matt’s handling of straws as playing and not concentrating on the task of designing. Jodie was more concerned with getting the ideas on paper while Matt seemed to be testing the practicalities of the potential design through manipulation of
resources. Considerable debate followed as the group refined their design, taking into account the problem constraints:
Matt: Use two, use two, and then cut the straws in half and place them in between.... Jodie: Yeah, but that’s not triangles (showing triangles with straws for the truss above the beam).
Nina: Need triangles.
Matt did not elaborate on his explanation of how the sets of two straws would be used and no clarification was required by Jodie. However, Nina reinforced Jodie’s suggestion of needing triangles. After further refining and testing their design, the group placed their triple-length straws on the testing blocks in various positions and distances apart. They then
returned to their illustrated design, with Jodie disagreeing with the group’s decision: “No, no, no, should we put like on top, below, on top, below, on top, below, in triangles?” Nina proceeded to refine her illustrated design by adding trusses. Further disagreements followed as the group considered several alternative designs:
Matt: What’s wrong with this? (returning to his idea of a triangular prism along the length of the bridge).
Jodie seemed to draw upon her existing concepts about how bridges look and,
consequently, Matt’s suggestion did not fulfil her existing conceptual understandings about bridges. There were no reasons provided by Jodie on why the triangular prism would not work. After several refinements of their design and subsequent testing of their construction, Jodie came up with a new idea to refine their product:
Jodie: I have an idea but I am not sure it will work. You can stick a straw inside a straw.
Nina: Oh! That’s such a smart idea.
Jodie: Yeah, cause then two straws is more strong (sic), ‘cause these straws are like really, really weak, so we need lots of them.
Matt: So we have to focus; we need three of these... Nina: How exactly will that work?
Nina continued to support Jodie’s ideas and provided positive reinforcement with the comment: “That’s such a smart idea”, which inspired Jodie to continue with an explanation of why it was a “smart idea”. After illustrating how the bridge would “work,” another group member, John, who had contributed little to date, commented, “I’m figuring what’s going to happen to your bridge when the weight goes on”. Jodie responded that, “You should be helping us not just sitting there working out how it’s going to collapse”. John focused on the end objective of testing the bridge structure when weights are placed on the bridge. No clarification was asked by Jodie or other members on why John was cogitating over the effects of weights on the bridge. After further discussion among the group members, they decided to redesign their bridge yet again. As Nina commented, “I still don’t see how much support, standing those things (trusses) on the end will do... How about we just lay them across the middle?” Further testing and refinement again followed, with the group still dissatisfied with their bridge structure (“It’s a bit confuddled!”):
Nina: So what are we doing?
Matt: We don’t have to put it diagonally... Cut these into three bits, put some at the top and the rest at the bottom.
Nina asked a question as she had done previously to have members articulate their ideas. Matt used a mathematical term (diagonally) to communicate his thoughts. Further discussion followed with more “I’ve got an even better idea” coming from the group members. Further refinements to their bridge structure led the group back to the triangular prism that Matt originally suggested.
4.3 Case studies
We now give consideration to how two focus group students (Jodie and Nina) responded to their homework activity. We chose these two case studies as they demonstrated the greatest improvements in levels of design from their classroom to homework activities. In her homework assignment, Jodie’s illustrated design improved from a level 2 for the classroom activity to level 6, with the latter comprising two detailed designs. In response to how she created her initial design and her ideas about why it would work, Jodie wrote that the design was chosen:
Because it has more support in the trusses. The design of the bridge had two trusses on either side of the road bed which had supports across the top of them to keep them up. The bridge was designed with supports that come off the top of the trusses and connect with the end of the bridge. The bridge had road supports across the bottom of the bridge to help the road bed stay up.
In commenting on the point at which his group’s bridge failed and why, Jodie stated that it “was designed to hold at least 100...but failed after 53 washers”. In displaying her understanding of basic principles, Jodie explained the reasons for the failure:
The bridge failed because the tension on the road bed side was not strong enough to keep the rest of the bridge upright. It also failed because the compression in the trusses was too much for the bridge to keep up. The bridge failed because the washers were too heavy for the bridge to keep up and so it failed in the middle where the washers were placed.
In her recommendations for improving the bridge, Jodie presented clear reasons why the bridge had support with the use of trusses in key positions and how the road provided a bridge support: “Place more trusses on the side and more support in the middle”. She also recommended having “more road bed supports across the bottom so that the road doesn’t bend and fall off... the design of an arch bridge would have been chosen if it was legal”.
Nina’s homework assignment design also improved from level 2 (classroom activity) to level 6, as indicated in Figure 1, where she included three perspectives, namely, a “road view,” a “side on view,” and a “bird’s eye view.” Nina likewise displayed an understanding of the bridge design principles she had learned, noting that the trusses gave the bridge the needed support and “would decrease the probability of the bridge falling by giving the bridge more depth. This would stop the bridge from bowing in the middle without using lots of material”. She also reported that the trusses would “help with the distance the bridge had to hold. Beam bridges by itself can only span to 80m while a Truss Beam Bridge can span to 180m. The bridge had lots of trusses underneath”.
In explaining the failure of the bridge, Nina cited the imbalance of the two sides of the bridge but also commented that even “if the bridge got the balances right it would have fallen over very quickly anyway”. She further noted that “the trusses were only in the middle of the bridge meaning it didn’t supply the bridge with enough support. The metal washers that were put in the middle of the bridge would have made lots of compression causing the place where
the trusses stopped to collapse”. Her preference for another bridge design was a suspension bridge:
because it spreads an equal amount of compression and tension to the whole bridge. This means it would stop the bridge from falling from too much or too little tension or compression in one spot. If the original bridge was to be improved, trusses would be put right to the end of the bridge. Also the bridges trusses would be facing up instead of down because the weight from the trusses were (sic) weighing it down.
5. Discussion and concluding points
This paper has reported on students’ learning processes during a seventh-grade engineering education activity involving bridge design and construction. Data analysis of responses from 15 focus group students indicated six increasingly sophisticated levels of bridge designs, ranging from simplistic illustrations with a sole focus on the resources provided (level 1) through to structural diagrams displaying both engineering and resource identifiers (e.g., “truss [(straws]; level 6)”. Students’ classroom designs ranged mostly from levels 1 to 3 (see Table 1), suggesting that insufficient attention was devoted to developing illustrated
engineering designs, but bearing in mind that the activity was the students’ (and teachers’) initial experience with engineering activities. In contrast, the two focus groups from the class that completed the homework assignment produced designs of at least level 4. Further
research is needed to determine why this was the case, including the impact of outside sources on students’ engineering education.
INSERT TABLE 2 ABOUT HERE
Analysis of the focus groups’ responses in both classes revealed a number of iterative design processes, where the problem goals, including the constraints placed on bridge construction, played a major role in students’ planning and construction of their bridge. Considerable effort was devoted to creating, interpreting and critiquing a design, followed by
testing it, and subsequently modifying it where necessary. These iterative processes were also evident as the students constructed, tested, and refined their final model bridge.
The six levels of bridge design presented a way to gauge the students’ levels of complexities and sophistication and could thus make a valuable contribution to the development of engineering education materials for this age group. Refining these levels could aid teachers in advancing students’ learning and could be used as an assessment rubric, with a focus on developing their skills towards more sophisticated engineering designs.
It is apparent that, in future engineering activities implemented in classrooms, teachers need to present clearer roles for students, as suggested in the student conversations during the bridge design and construction processes. It was also apparent that teachers need to scaffold students’ understandings of how to present and amend labelled designs that take into
consideration the six levels proposed in this study. There were three considerations where the teacher’s role might have helped establish expectations for students to: (1) consider the learning needs of each group member, that is, some are kinaesthetic learners, some visual learners and so forth, which could assist students to recognise each other’s learning needs and adjust accordingly; (2) request clarification of an idea presented to allow group members opportunities to explain their concepts in full; and (3) provide and seek reasons for any decision. Identifying and adjusting to each member’s learning needs, gaining clarification of ideas, and providing reasons for decisions may assist the group towards achieving their end goal in a collaborative and more informative way.
Two limitations of this study are the small sample size and hence the generalisability of the findings, especially given the qualitative approach to data analysis. Furthermore, the levels of design that were identified could undergo further research with larger sample sizes to strengthen their reliability. Nevertheless, the findings present an indication of the support, resources, and pedagogical approaches students require for early engineering education. As
the field is new, substantial research is needed in developing and designing teaching tools that will enhance STEM education.
6. Acknowledgement
The project reported here is supported by a three-year Australian Research Council (ARC) Linkage Grant LP0989152 (2009-2011). Any opinions, findings, and conclusions or recommendations expressed in this paper are those of the authors and do not necessarily reflect the views of the ARC. We wish to acknowledge the keen participation of the students and their teachers, as well as the excellent support provided by our research assistants, Jo Macri and Lyn Nock.
MISSING REF
Erickson, F. (1998). Qualitative research methods for science education. In B.J. Fraser & K.G. Tobin (Eds.), International handbook of science education (Part 2). (pp.1155-1173). Dordrecht: Kluwer Academic Publishing.
www.engineersaustralia.org.au/.../fixing-australia-s-engineering-skills- shortage-urgent-and-shared-responsibility [Accessed January, 2012]
7. Appendix (Homework Assessment)
Your company has been asked to design and build a bridge over the Brisbane River, spanning 150m with no piers. There are to be no piers as they disturb the aquatic life and river traffic in the waterway.
A scale model will be designed and tested at Brisbane City Council Chambers on the 27th August. The Council representatives will be testing for strength and stability of the bridge as Brisbane residents will be using it every day.
Your company is also asked to file a report about the bridge that you designed, built, and tested. Below are the areas that you are asked to report on for the Brisbane City Council. Part A: Bridge Design
(a) The initial design and ideas behind why it would work (Beam Bridge). (b) A labelled diagram of the bridge and materials used.
Part B: Test and Analysis
(a) At what point did your bridge fail and describe why it failed.
(b) How you could improve your bridge design (for example, would you choose another bridge type and why, or how would you make your bridge stronger?)
8. References
Borgford-Parnell, J., Deibel, K., & Atman, C. J. (2010). From engineering design research to engineering pedagogy: Bringing research results directly to the students. International Journal of Engineering Education, 26 (4), 748-759.
Cunningham, C. M., & Hester, K. (2007). Engineering is elementary: An engineering and technology curriculum for children. In Proceedings of the 2007 American Society for Engineering Education Annual Conference & Exposition. Honolulu, Hawaii:
American Society for Engineering Education.
Dawes, L., & Rasmussen, G. (2007). Activity and engagement—keys in connecting engineering with secondary school students. Australasian Journal of Engineering Education, 13(1), 13-20.
English, L. D. & Mousoulides, N. (2011). Engineering-based modelling experiences in the elementary and middle classroom. In M. S. Khine, & I. M. Saleh (Eds.), Models and modeling: Cognitive tools for scientific enquiry (pp. 173-194). Dordrecht: Springer (Under series, Models and Modeling in Science Education).
Hester, K., & Cunningham, C. (2007). Engineering is Elementary: An engineering and technology curriculum for children. American Society for Engineering Education Conference & Exposition. Honolu: HI.
Hoover-Dempsey, K. V., Battiato, A. C., Walker, J. M. T., Reed, R. P., DeJong, J. M., & Jones, K. P. (2001). Parental involvement in homework. Educational Psychologist, 36(3), 195-209.
Katehi, L., Pearson, G., & Feder, M. (2009). Engineering in K-12 education: Understanding the status and improving the prospects. Washington, DC: The National Academies Press.
Kolmos, A., Fink, F. K., & Krough, L. (Eds.). (2004). The Aalborg PBL model. Aalborg Denmark: Aalborg University Press.
Lesh, R., & Lehrer, R. (2000). Iterative refinement cycles for videotape analyses of conceptual change. In R. Lesh & A. Kelly (Eds.), Research design in mathematics and science education (pp. 665-708). Hillsdale, NJ: Lawrence Erlbaum Associates. Massachusetts Science and Technology/Engineering Curriculum Framework, October, 2006.
http://www.doe.mass.edu/frameworks/current.html.
National Research Council. (2009). Rising above the gathering storm two years later: Accelerating progress towards a brighter economic future. Washington, DC: The National Academies Press. Retrieved from http://www.nap.educ/catalog/12537, Sept., 2011.
Organisation for Economic Co-operation and Development, OECD Science, technology, and industry outlook 2006 (highlights), 2006, Retrieved from
www.oecd.org/dataoecd/39/19/37685541.pdf, Sept., 2011
Silver, E. A., Mesa, V. M., Morris, K. A., Star, J. R., & Benken, B. M. (2009). Teaching Mathematics for understanding: An analysis of lessons submitted by teachers seeking NBPTS certification. American Educational Research Journal, 46(2), 501-531. Strauss, A. & Corbin, J. (1990). Basics of qualitative research: Ground theory procedures
and techniques, CA: Sage.
Taylor, P. (2008). Engineers Australia Media Release 29/01/2008. Fixing Australia’s engineering skills shortage.
Zawojewski, J. S., Hjalmarson, J. S., Bowman, K., & Lesh, R. (2008). A modeling
perspective on learning and teaching in engineering education. In J. Zawojewski, H. Diefes-Dux, & K. Bowman (Eds.), Models and modeling in engineering education: Designing experiences for all students. Rotterdam: Sense Publications.
Table 1 Changes in levels of the focus groups’ bridge designs
Activity Levels of design
1 2 3 4 5 6 Classroom 0 4 2 1 0 0 Homework 0 0 0 3 1 3 n = 7 students
Figure captions
Figure 1 Example of a level 6 illustrated bridge design Figure 2 Iterative design processes
Figure 2
Create design
Test design
Create & test model
Refine design Identify problem including constraints Interpret design Refine model Final model