Lauren W. Turpin. Vertical Search Behavior and Preference of Users with Different Visual Memory and Perceptual Speed Abilities. A Master’s Paper for the M.S. in I.S. degree. November 2015. 43 pages. Advisors: Diane Kelly and Jaime Arguello
Vertical search in Information Retrieval (IR) represents display opportunities for searcher interaction in the form of blended and non-blended results. Search behavior and
preference in interacting with these results can be influenced by both design and personal, cognitive abilities. This study evaluates the relationship between cognitive ability and vertical search behavior and preference.
In this lab study cognitive tests measuring perceptual speed and visual memory were administered to sixteen participants who subsequently performed four search tasks on two search engines, one with a blended display and one with a non-blended display. Cognitive tests, search logs and participant questionnaires were used to evaluate vertical search behavior and preference in cognitively high and low performers. The findings suggest that cognitive ability influences vertical search engagement and preference. The value in this research is its ability to contribute to issues of result merging, display, and interaction at a personal level in vertical search.
Headings:
Federated Searching Information Retrieval
VERTICAL SEARCH BEHAVIOR AND PREFERENCE OF USERS WITH DIFFERENT VISUAL MEMORY AND PERCPETUAL SPEED ABILITIES.
by
Lauren W. Turpin
A Master’s paper submitted to the faculty of the School of Information and Library Science of the University of North Carolina at Chapel Hill
in partial fulfillment of the requirements for the degree of Master of Science in
Information Science.
Chapel Hill, North Carolina November 2015
Approved by
Contents
1 INTRODUCTION ...2
2 LITERATURE REVIEW ...6
2.1 BLENDED AND NON-BLENDED DISPLAYS ...6
2.2 COGNITIVE ABILITIES ... 10
2.2.1 VISUAL MEMORY ... 12
2.2.2 PERCEPTUAL SPEED ... 13
2.3 RESEARCH QUESTIONS ... 17
3 METHODS ... 18
4 RESULTS ... 24
4.1 COGNITIVE GROUPING ... 24
4.2 SEARCH BEHAVIOR ... 25
4.3 USER PREFERENCE ... 28
5 DISCUSSION ... 32
6 CONCLUSION ... 35
7 REFERENCES ... 37
1
Introduction
In order for information to have value it has to be retrievable and thus, inherently,
the presence of information creates a need for information retrieval (IR). Over time, the discipline of IR has grown as technology has become more complex and searchers’
expectations have increased. At the core, the primary goal of IR is to match the searcher’s needs to information that fulfills this need. This seems simple enough given our current population’s proclivity towards Web search and our current environment is based on an
extensive body of research about relevance, retrieval models, precision, recall, efficiency, effectiveness, cost, and all the underlying aspects of these concepts. In recent years,
studies have extended beyond the qualitative and explored individual differences that influence search experience, including cognitive ability. This paper describes a study
aimed at researching the relationship between cognitive ability and vertical search. The paper is outlined as follows. In the first chapter, I introduce the topic of study. In the second chapter, I present a review of relevant literature. The third chapter is devoted to
the study methods. In the fourth chapter, I present the results. The fifth chapter provides a discussion and chapter six concludes the paper.
A large proportion of resources in IR is devoted to search result presentation and interaction. Commercial search engines constantly work towards meeting searcher needs, which encompass a broad range of services. Search can be compartmentalized by
Challenges in consolidating results in vertical search extend to display and navigation. Increasingly, searchers want flexibility in how they interact with the results.
As image and video have become more prevalent, those file types are increasingly queried. Searchers may also want to narrow their results by category. Since widespread
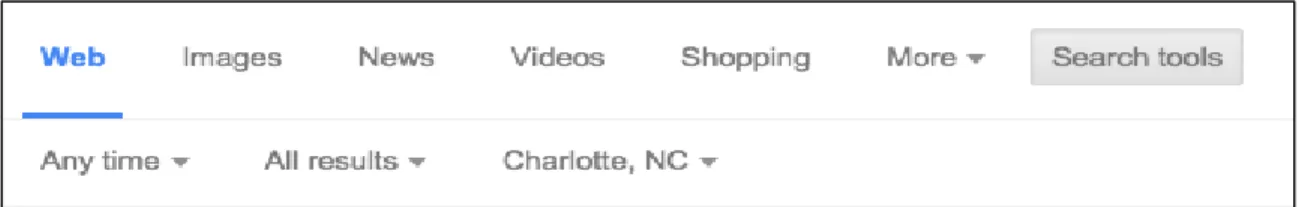
adoption of commercial web engines, categorization has beem part of search. In 2000, Google® offered a number of categories to narrow the search. Today, search results continue to be categorized but Web search services offer predefined verticals. Figure 1
shows the verticals Google® presented in a recent 2015 search session. Verticals presented are Web, Images, News, Videos, Shopping and additional options, enabling
searchers to narrow their results to specific types of resources.
Figure 1. Google Search Screenshot, 2015
In addition to offering vertical search, the vertical results can be displayed as
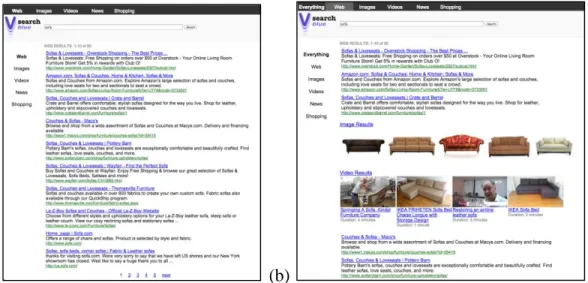
either blended or non-blended. Blended vertical results display all vertical search result types on the same page. Non-blended results require the searcher to select a vertical if they want to see other vertical results. Figure 2 shows non-blended and blended results in
a vertical search interface. Blending results has its advantages, particularly in providing a variety of options on a single page. However, all searchers might not want to interact
(a) (b)
Figure 2. (a) Non-blended display; (b) Blended display
Search studies, therefore, have begun to look at how to account for individual differences, including individual computer experience, domain expertise and personality
traits. These factors have proven to have an effect on search performance (Borgman, 1989). What is less known is how to account for individual cognitive abilities. These are abilities that relate to our individual mental processes. Carroll defines cognitive ability, “I
define a cognitive task, therefore, as any task in which correct or appropriate processing of mental information is critical to successful performance. A cognitive ability is any ability that concerns some class of cognitive tasks, so defined” (1993, p. 10).
Broad cognitive abilities are categorized as a fluid intelligence, crystallized
intelligence, general memory and learning, broad visual perception, broad auditory perception, broad retrieval ability, broad cognitive speediness and processing speed (Carroll, 1993). These categories are further defined as narrow cognitive abilities and can
be determined using the Ekstrom Kit of Factor-Referenced Cognitive Tests (1976). To date, studies using these tests have focused on IR using performance and behavior
search as a variable (REFS). This study will seek to determine if and how specific cognitive abilities relate to use of, and preference for, blended and non-blended vertical
search result displays.
Given the number of cognitive factors, this study focuses on the impact of two
specific cognitive abilities, visual memory and perceptual speed. Visual memory is part of the general memory and learning construct. Perceptual speed is part of broad visual perception and broad cognitive speediness. These tests were chosen as they have shown
in prior studies to be a contributing factor in search behavior (Velez, Silver and
Tremaine, 2005; Chen, 2000; Conati and Maclaren, 2008; Gwizdka, 2004; Al-Maskari
and Sanderson, 2011; Peters, Yastrop and Boehm-Davis, 1988). This study extends previous findings by investigating their relationship to blended or non-blended vertical search interfaces. Specifically, the study will address the following research questions:
1. What is the relationship between visual memory and search behaviors and interface preferences in vertical search?
2. What is the relationship between perceptual speed and search behaviors and interface preferences in vertical search?
The research questions attempt to delve into the cognitive ability of a user and how their
predisposition of a specific ability influences their use of verticals in a search interface. Learning more about cognitive abilities and their impact on vertical search
preference can assist search engine designers with combining results and display order and can influence interface designers with creating and providing appropriate visual displays. In addition to designing for variability in large groups, individual cognitive
2
Literature Review
The study presented here considers topics in vertical search and cognitive ability,
two areas that overlap in meaningful ways for IR. Broad concepts in both are brought to a more narrow focus to identify specific relationships and theories in the following
literature review. First is a discussion of blended and non-blended displays. Second, cognitive abilities are defined and an analysis of cognitive abilities to be considered in
this study is presented. Finally, there is an assertion of research questions that bring the two together for analysis.
2.1
Blended and Non-Blended Displays
In the context of Web search, searcher preference in interacting with blended and
non-blended result sets is important for IR. Arguello, Wu, Kelly and Edwards (2012) studied search behavior in blended and non-blended interfaces. Based on task
complexity, they were able to examine search behavior in terms of queries, clicks on search engine results page (SERP), time and URLs visited. They found that the interaction measures time and clicks on SERP, were statistically significant for task
complexity. Queries and URLs visited also increased with task complexity. Essentially, “this analysis supports our hypothesis (H1) that more complex tasks are associated with
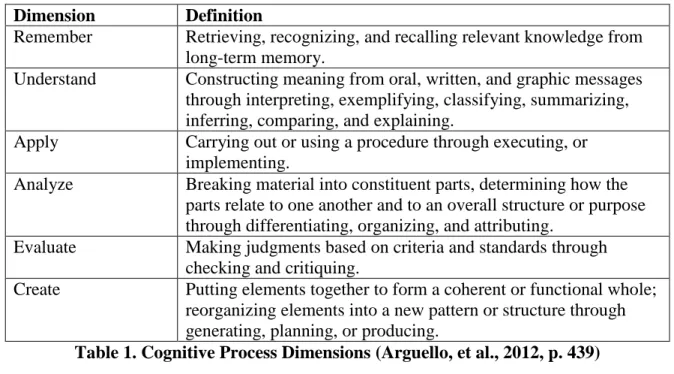
Task complexity in search tasks was based on Anderson and Krathwohl’s (2001) cognitive process dimensions. These dimensions are designed to attribute cognitive
complexity to a series of mental processes. Table 1 outlines the dimensions and
definitions. In IR they are useful for designing search tasks within subject domains that
can be assigned a level of task complexity. This helps to level the playing field when assessing task complexity in terms of search behavior.
Dimension Definition
Remember Retrieving, recognizing, and recalling relevant knowledge from long-term memory.
Understand Constructing meaning from oral, written, and graphic messages through interpreting, exemplifying, classifying, summarizing, inferring, comparing, and explaining.
Apply Carrying out or using a procedure through executing, or implementing.
Analyze Breaking material into constituent parts, determining how the parts relate to one another and to an overall structure or purpose through differentiating, organizing, and attributing.
Evaluate Making judgments based on criteria and standards through checking and critiquing.
Create Putting elements together to form a coherent or functional whole; reorganizing elements into a new pattern or structure through generating, planning, or producing.
Table 1. Cognitive Process Dimensions (Arguello, et al., 2012, p. 439)
In addition to task complexity, Arguello, et al. (2012) researched preferences in blended and non-blended interfaces. Using the User Engagement Questionnaire to
measure focused attention, feeling involvement, perceived usability, and endurability, they did not find any significant differences between interfaces. They do note, however,
that:
Their work further validated that task complexity is a factor for search interaction and that blended and non-blended interfaces could play a role in search behavior.
Bron, Grop, Nack, Baltussen and deRijke (2013) also studied blended and non-blended results. They studied the preference of vertical search results for searchers
conducting multi-session tasks. The first five weeks of a post-graduate course requiring a multi-stage project was the backdrop for their study. As students worked on their project, the blended and non-blended displays captured log data. Students also participated in
focus groups and completed questionnaires for additional data analysis. After the first week, students noted that the system was too specific for that stage of the project while
they were still exploring topics. As time went on, students used the system more and the data suggests that as a searcher becomes more familiar with a topic or sources available for a topic, they switch displays for easier navigation.
Bron, et al. (2013) found that most searchers moved between the blended and non-blended during the study. Some started with the blended results when beginning a
task or their information need changed. The blended allowed them to explore a variety of sources and material on the same page. They then switched to the non-blended as their understanding of the task increased and they wanted to focus on particular sources, citing, “The main motivation to use the tabbed [non-blended] display is to zoom in on a single source as other sources are not considered relevant at that stage of the project, e.g., . . .”
(Bron, et al., 2013, p. 131). Others started with the non-blended and then moved to the blended. The patterns that emerged did not seem to have a particular motivation other than individual difference. Their work highlights that a searcher’s preference changes as
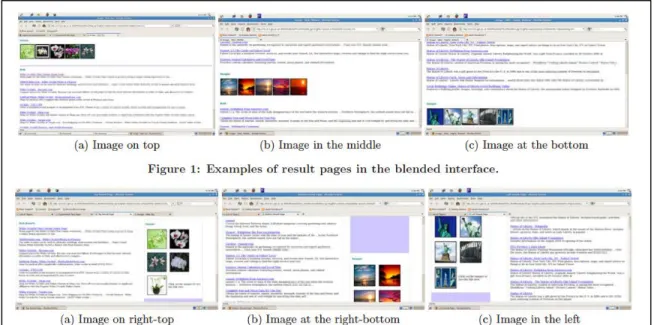
Search behavior in blended and non-blended results was additionally studied by Sushmita, Lalmas, Joho and Villa (2010). They did not compare the result sets but
identified some observations about each, specifically focusing on position,
source-orientation and augmented element type as an impact on click-through behavior. Position
was at the top, middle or bottom of the blended results or the left, top-right or bottom-right of the non-blended results. Figure 3 is a screenshot of each. Source orientation was high, medium or low and the augmented element was image, news or video.
Figure 3. Sushmita, et al., (2010), p. 522.
They found that position has a significant effect on click-through behavior in blended results but not in non-blended (Sushmita, et al., 2010). When the augmented element
appears at the top or is more strongly associated with the information need of the blended results it is more likely to be clicked. Position was not significant in non-blended results. While these results cannot be compared for significance, there does appear to be searcher
As Sushmita, et al. (2010) demonstrated, source types other than web results may impact search interaction, either as a stand-alone click-through effect or as a contributing
factor. Arguello and Capra (2012) studied how an image presented in vertical search results may influence interaction. Their work looked more closely at query ambiguity and
how the presentation of on- and off-target results paired with images may be perceived. The presentation of images, whether they were on- or off-target of the information need did increase a searcher’s interaction with the web results.
The incorporation of multiple media types into vertical search may be assuming that searchers prefer to have all results on a single page, when their particular ability may
suggest that they prefer to use vertical results as individual resources.
2.2
Cognitive Abilities
Cognitive abilities are our mental processes. In addition to many other factors, such as personality, our cognitive abilities separate us from each other. In testing, we may find that some people perform better in some areas of cognition but there are no right or
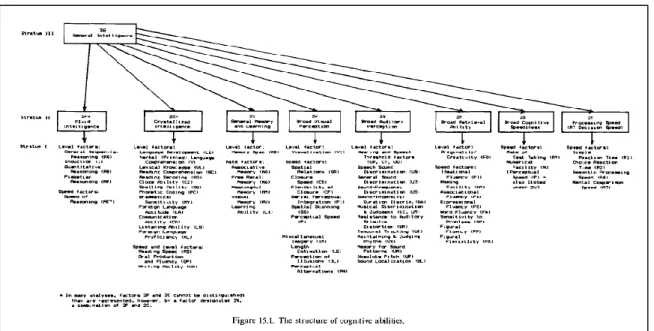
wrong answers. Carroll (1993) describes a hierarchy where basic intelligence is the general idea of cognition encompassing a broad set of abilities that can then be defined
by narrow abilities. Figure 4 depicts the structure of cognitive abilities that provides an outline for how we look at broad abilities and can adapt testing to measure narrow abilities. The broad, or second stratum, abilities, “ . . .appear to represent basic
determine how these broad abilities impact search behavior and interaction. Narrow cognitive abilities provide an opportunity to measure high and low performers of any
given ability and to determine which abilities have a significant effect on performance and behavior and which ones are less impactful.
Figure 4. The structure of cognitive abilities (Carroll, 1993, p. 632)
In relation to IR, three broad spectrums emerge as an opportunity for research – General Memory & Learning, Broad Visual Perception and Broad Cognitive Speediness.
Their definitions are:
“General Memory Ability (General Memory & Learning), probably involved in any task that calls for learning and memory of new content or responses.
Broad Visual Perception, involved in any task that requires the perception of visual forms as such.
Broad Cognitive Speediness, involved in any task or performance that requires rapid cognitive process of information.”
(Carroll, 1993, p. 624-625)
abilities to identify specific elements that can be measured and studied as an impact on search behavior. These innate abilities influence a search session and may help interface
designers understand search behavior (Borgman, 1989; Al-Maskari and Sanderson, 2011). In addition, cognition may become a design factor for the IR system itself (Chen
and Dhar, 1991). For purposes of this paper, the focus will be on Visual Memory within General Memory & Learning and Perceptual Speed within both Broad Visual Perception and Broad Cognitive Speediness.
2.2.1 Visual Memory
Visual memory is “the ability to remember the configuration, location, and orientation of figural material” (Ekstrom, et al., 1976, p. 109). This ability may prove to
be influential as searchers explore blended and non-blended results. In particular, it may
show a tendency towards preference or search behavior. For this narrow stratum there are three cognitive tests offered by Ekstrom, et al. (1976). The “Shape Memory” test is where “the subject is asked to identify those irregular forms which were previously seen in the same orientation on a study page”; the “Building Memory” test is where “the subject is
asked to indicate the location of a number of buildings seen on a previously studied map”; and the “Map Memory” test where “the subject is asked to identify those maps which previously presented on a study page” (Ekstrom, et al., 1976, p. 110). The “Shape
Memory” test has been used multiple times to evaluate this ability in IR.
Velez, Silver and Tremaine (2005) conducted a study exploring the cognitive affects of spatial ability in visualization. Participants took five cognitive tests, including the “Shape Memory” test, and then performed visualization tests where they were asked
performance was not significantly correlated to visual memory but that accuracy in visualization was slightly correlated with visual memory. A similar study previously
executed by Chen (2000) looked at visual memory in a spatial environment. After a series of cognitive tests, including the “Shape Memory” test, participants conducted searches on
an interface where a visual representation of related articles was presented next to a textual representation. Chen (2000) found that visual memory did not have a significant correlation to search performance in a spatial environment. Gwidka (2011) considered a third environment, email. Also using the “Shape Memory” test, those with higher visual
memory scrolled more in a more visual interface (Gwizdka, 2011). However, the study
found that visual memory did not significantly impact performance time.
These studies seem to indicate that visual memory does not have a significant impact on search behavior; however, none have considered it as a factor for preference. A
cognitive ability may not only relate to performance but also to personal preference for interface style. In the case of visual memory, blended or non-blended interface displays may be more preferential based on an individual’s ability even if it does not impact
performance metrics.
2.2.2 Perceptual Speed
Perceptual speed is:
“ . . . speed in comparing figures or symbols, scanning to find figures or symbols, or carrying out other very simple tasks involving visual perception. It may be the centroid of several subfactors (including form discrimination and symbol
discrimination) which can be separated but are more usefully treated as a single concept for research purposes.” (Ekstrom, et al., 1976, p. 123)
preference as those with a higher or lower perceptual speed ability may want to interact differently. There are three narrow stratum tests – the “Finding A’s” test where a participant is asked to locate five words with the letter ‘a’ in each of 20 columns; the “Number Comparison” test where “the subject inspects pairs of multi-digit numbers and
indicates whether the two numbers in each pair are the same or different”; and the “Identical Pictures” test where “for each item the subject is to check which one of 5
numbered geometrical figures or pictures in a row is identical to the given figure at the left end of the row” (Ekstrom, et al., 1976, p. 124).
Several studies in IR have used the “Finding As” test to assess perceptual speed as
a factor in search behavior. Peters, Yastrop and Boehm-Davis (1988) used this test as a factor when evaluating performance in a database that was presented in either a tabular or graphic form and questions posed were either tabular or graphic. Perceptual speed was
assessed against the four conditions, graphic/graphic, graphic/tabular, tabular/graphic, and tabular/tabular. In all instances, perceptual speed was a significant factor in
predicting response latency (Peters, et.al, 1988). This study may seem outdated but represents important factors in studying cognitive abilities and IR presentation for searchers, specifically:
“When more than one type of information is expected to be retrieved from the database, users should either be presented with redundant information in more than one format, . . ., or be given the option of how they wish to see the information formatted” (Peters, et al., 1988, p. 305).
A study by Al-Maskari and Sanderson (2011) used all three perceptual speed tests to assess a user’s ability by compiling a composite measure for analysis, overall
perceptual speed (OPS). Participants executed searches within a TREC collection, a static
participant executed eight searches and was given seven minutes for each search.
Executing this experiment in a controlled environment enabled the researchers to analyze
metrics that cannot be normally captured, such as relevancy. Through this study, they identified that “users with lower perceptual speed took longer to obtain the first relevant
document than those with higher perceptual speed” (Al-Maskari and Sanderson, 2011, p.
724-725). They also noted, however, that perceptual speed ability did not appear to influence user satisfaction.
Allan (1994) used the “Number Comparison” and “Identical Pictures” tests to also look at perceptual speed as an indicator of search performance. Using two test systems,
one that presented resources alphabetically and one by subject heading with predefined relevant results, participants were asked to conduct a search. Those with higher
perceptual speed achieved greater precision and recall. He found that “when people use
an information system designed to enable fast scanning of important subject descriptors, those who have higher levels of perceptual speed are able to take advantage of the design features of that information system” (Allan, 1994, p. 79). He attributes this to the
relationship between learning and perceptual speed. Searchers are able to alter their search based on what they see in previous results, effectively learning real time to enhance their search. This is relevant in today’s environment since many users scan
integrated results looking for the most relevant to their query or looking for ways to
amend their search to improve the results.
Brennan, Kelly and Arguello (2014) also used perceptual speed in their evaluation of search behavior and workload. They included additional cognitive abilities,
speed are both narrow stratums of the broader stratum Broad Visual Perception. Associative memory is part of General Memory & Learning. Their study used the “Number Comparison” test to evaluate perceptual speed, the “Paper Folding” test for visualization, and the “Picture-Number” test for associate memory. To evaluate these
cognitive abilities in search, participants executed six search tasks in the Remember, Analyze and Create dimensions. Their interaction was recorded using log metrics.
They found that perceptual speed not only had an effect on search behavior, but
also on workload. In addition, they noted that users with high perceptual speed were more active. They particularly noted “ . . . people with low perceptual speed might benefit from
additional tools to help them navigate documents, and keep track of, and integrate, their findings. Such people might also benefit from alternative layouts of search results . . .” (Brennan, et al., 2014, p. 173). They also found that Visualization had a significant effect
on search behavior. This suggests that narrow stratums under Broad Visual Perception may influence search behavior and can be singled out to determine which ability and
which cognitive test may give IR researchers the best indicator of behavior and perhaps preference.
Conati and Maclaren (2008) also studied visualization and particular cognitive
impacts. They assessed users on cognitive abilities, including visual memory and perceptual speed, as they relate to interpreting geographical data in both graph and
colored box formats. Only perceptual speed was found to be significant. Of note, they comment, “this finding suggests the idea of having a system that can display both
visualizations but that adaptively selects which one to recommend based on the user
that individual cognitive abilities influence behavior and can potentially be used as a predictor of success or need.
2.3
Research Questions
Given the current research, there is an opportunity to examine further the
relationship between specific cognitive abilities and vertical use behavior and preferences. This study will focus on specific cognitive abilities, visual memory and
perceptual speed, and their relationship to searcher vertical search preference. These abilities are important in assessing search behavior and effectiveness. This study extends analysis into personal preference with the following research questions:
What is the relationship between visual memory and search behaviors and interface preferences in vertical search?
What is the relationship between perceptual speed and search behaviors and interface preferences in vertical search?
These questions explore how vertical results may influence searchers and may lead to additional research questions that explore personal search and how to adapt to cognitive
3
Methods
This study is based on Arguello, et al.’s study (2012) where they used two
interfaces to study user preference for blended and non-blended results and Brennan, et al. (2014) where specific cognitive abilities were researched in relation to search
behavior.
Participants were recruited using the University of North Carolina – Chapel Hill
staff list. The study was completed the week of September 21 – 25, 2015, in the School of Information and Library Science Interactive Information Systems lab. All participants used the ThinkStation PC with Dell monitor, keyboard and mouse. Each participant was
paid $15. Each session lasted approximately 60-75 minutes. Sixteen participants were enrolled. Participants ranged in age from 23 to 55, with an average age of 36 (SD=11.81).
Three participants were male and 13 female. Eleven of the 16 participants had a bachelor’s degree, three had a master’s and two had a doctorate. All participants
responded they had access to a computer and used both a computer and the Internet daily.
All had more than 10 years of computer experience. All participants indicated they used Google®, 56.3% have used Yahoo!®, 43.8% have used Bing®, and 18.8% have used
AOL®.
The entry questionnaire also evaluated search experience to register participant confidence with search. Participants ranked their level of confidence on a scale of 1
accomplish their task in the given time. The mean rating was 8.25 (SD=1.73), indicating a high level of confidence from all participants.
Each participant was assigned a random subject number to be used during the experiment. Each participant completed two cognitive tests from the Ekstrom Kit of
Factor-Referenced Cognitive Test to assess perceptual speed and visual memory (Ekstrom, French, Harman and Dermen, 1976). To examine perceptual speed, the
“Finding A’s” test was used. In this test, participants had two minutes to identify the five words with a letter “a” in each of the twenty columns on four pages. This test was run
twice and scored separately from the participant session. The second cognitive test, used
to assess visual memory, was the “Shape Memory” test. Participants had four minutes to study a set of black and white shapes and their orientation in relation to each other. They then had four minutes to identify the previously seen shapes in 16 subsets. This test was
performed twice and scored separately from the session.
After completing the paper-based cognitive tests, participants turned to the
desktop to complete four search tasks on two different interfaces (systems), one blended and one non-blended (Figure 1). Results were returned for Web, News, Images and Video using the Bing® API and results for Shopping used the eBay® API. The non-blended
results were displayed as each individual vertical only. The blended results were blocked in set positions for each vertical, if any were returned. They were blocked in the same
order: web, image, video, web, shopping. Participants had up to 10 minutes to complete each task. Not all participants took the full time to complete each task. In one particular instance, a participant was encouraged to take the task further after first suggesting that
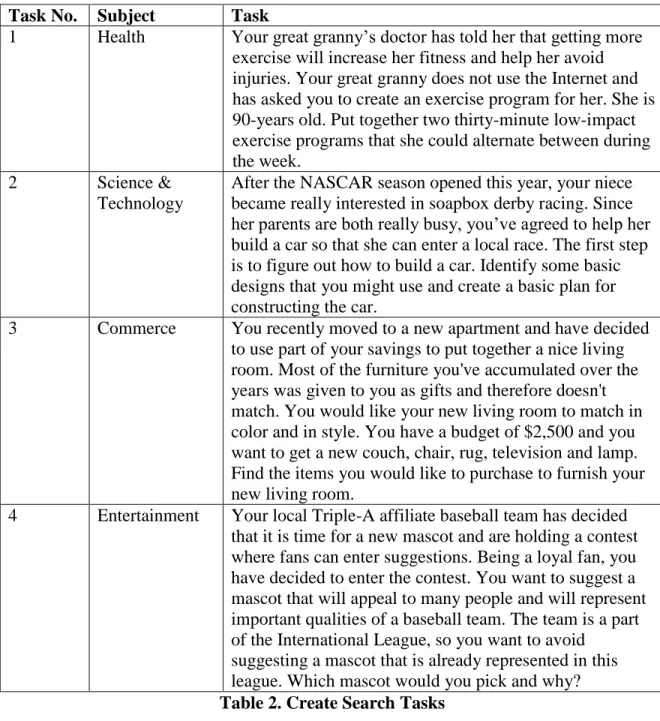
memory and perceptual speed, four search tasks were chosen based on the ‘create’ dimension of Anderson and Krathwohl’s Taxonomy of Learning (2001).
Task No. Subject Task
1 Health Your great granny’s doctor has told her that getting more exercise will increase her fitness and help her avoid injuries. Your great granny does not use the Internet and has asked you to create an exercise program for her. She is 90-years old. Put together two thirty-minute low-impact exercise programs that she could alternate between during the week.
2 Science & Technology
After the NASCAR season opened this year, your niece became really interested in soapbox derby racing. Since her parents are both really busy, you’ve agreed to help her build a car so that she can enter a local race. The first step is to figure out how to build a car. Identify some basic designs that you might use and create a basic plan for constructing the car.
3 Commerce You recently moved to a new apartment and have decided to use part of your savings to put together a nice living room. Most of the furniture you've accumulated over the years was given to you as gifts and therefore doesn't match. You would like your new living room to match in color and in style. You have a budget of $2,500 and you want to get a new couch, chair, rug, television and lamp. Find the items you would like to purchase to furnish your new living room.
4 Entertainment Your local Triple-A affiliate baseball team has decided that it is time for a new mascot and are holding a contest where fans can enter suggestions. Being a loyal fan, you have decided to enter the contest. You want to suggest a mascot that will appeal to many people and will represent important qualities of a baseball team. The team is a part of the International League, so you want to avoid
suggesting a mascot that is already represented in this league. Which mascot would you pick and why?
Table 2. Create Search Tasks
Selecting a single task complexity removed it as a factor, allowing the study to focus on high and low visual memory and perceptual speed abilities and their effect on interface
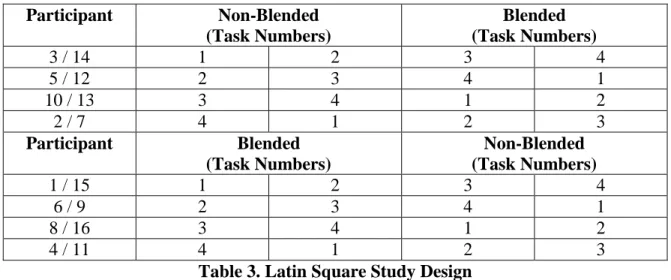
The study was designed as a Latin Square model where every eight participants had a unique experience. Table 3 shows the search task experience for each participant.
Participants were unaware of other participant experiences as each session was conducted alone with the researcher.
Participant Non-Blended
(Task Numbers)
Blended (Task Numbers)
3 / 14 1 2 3 4
5 / 12 2 3 4 1
10 / 13 3 4 1 2
2 / 7 4 1 2 3
Participant Blended
(Task Numbers)
Non-Blended (Task Numbers)
1 / 15 1 2 3 4
6 / 9 2 3 4 1
8 / 16 3 4 1 2
4 / 11 4 1 2 3
Table 3. Latin Square Study Design
Participants completed questionnaires after each task and after each interface. Each task questionnaire contained five questions with a five point Likert scale designed to assess the searcher’s perception of the system and their ability to find relevant results.
Table 4 shows the post task questions.
Question Scale
How difficult was it to find relevant documents?
Very Easy . . . Very Difficult
How would you rate your skill and ability at finding relevant documents?
Not Good . . . Very Good
How would you rate the system’s ability at retrieving relevant documents?
Not Good . . . Very Good
How successful was your search? Unsuccessful . . .Successful How many of the relevant documents do
you think you found?
A few of them . . .All of them
Table 4. Post Task Questionnaire
Effectiveness Scale (Arguello, et al., 2012). The Engagement Scale comprised of 18 questions representing the following sub-scales (see Appendix) and the Search
Effectiveness scale consisted of five items:
Focused Attention (4)
Felt Involvement (3)
Perceived Usability (7)
Endurability (4)
Search Effectiveness (5)
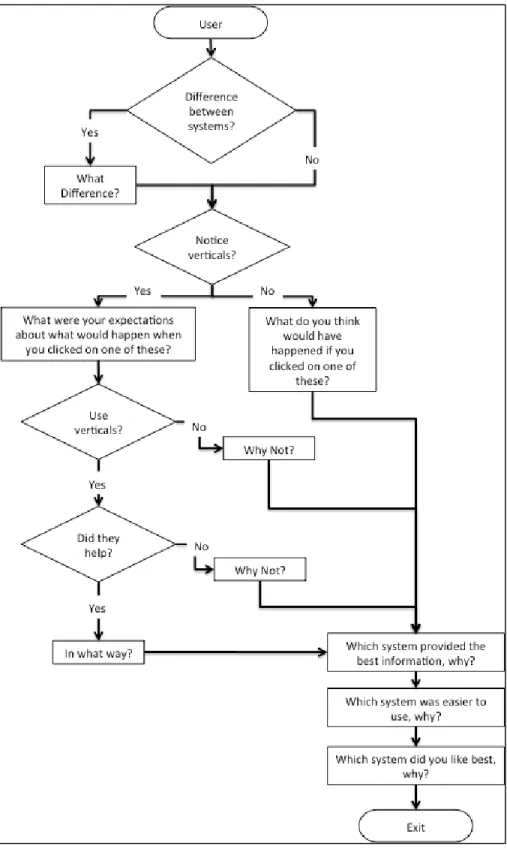
Participants also completed an Exit Questionnaire which was replicated from Arguello, et al. (2012) and asked participants a series of questions regarding the verticals present in
the systems and overall interface preference. Figure 5 presents the exit questionnaire. The questionnaire first asks users if they noticed a difference between the interfaces. If so, they were asked to describe the differences. If not, they were moved to the next question.
They were then asked if they noticed the verticals that were at the top and left side of the system. If yes, they were taken through a series of questions about use of those verticals,
why or why not they were used, and if they were helpful. If they did not notice the verticals, users were asked about their expectations of use of the verticals. Finally, users were asked which system provided the best information, which was easier to use, and
4
Results
The results provided summarize the cognitive, questionnaire and log data
collected. The cognitive results were scored manually and recorded in Microsoft® Excel. The questionnaire data was recorded in Qualtrics. The search log data was recorded in a
secure database and exported to Excel for analysis.
4.1
Cognitive Grouping
Table 5 presents the descriptive statistics of the cognitive tests conducted for Perceptual Speed (P) and Visual Memory (MV). The means of the study are compared to
the means provided by Ekstrom, et al. (1976) and are within one standard deviation. The mean for Visual Memory is slightly lower as is the mean for Perceptual Speed when compared to females. When compared to males, however, the mean is slightly higher.
Given that the study sample was heavily skewed with 81% female participants, this mean would appear to be best considered slightly lower. Using the median to split the
Perceptual Speed (P-1) Visual Memory (MV-1)
Possible Range 0 – 200 (-32) – 32
Mean (SD) 51.94 (10.41) 18 (8.69)
Median 51 20.5
Min, Max 34, 74 -2, 30
EKM Mean (SD) Males* 47 (14.9) Females* 54.3 (14.9) 21.4 (4.3)
*Based on 1963 Version of test. The 1976 version used was shortened. Table 5. Descriptive Statistics of Cognitive Groupings
4.2
Search Behavior
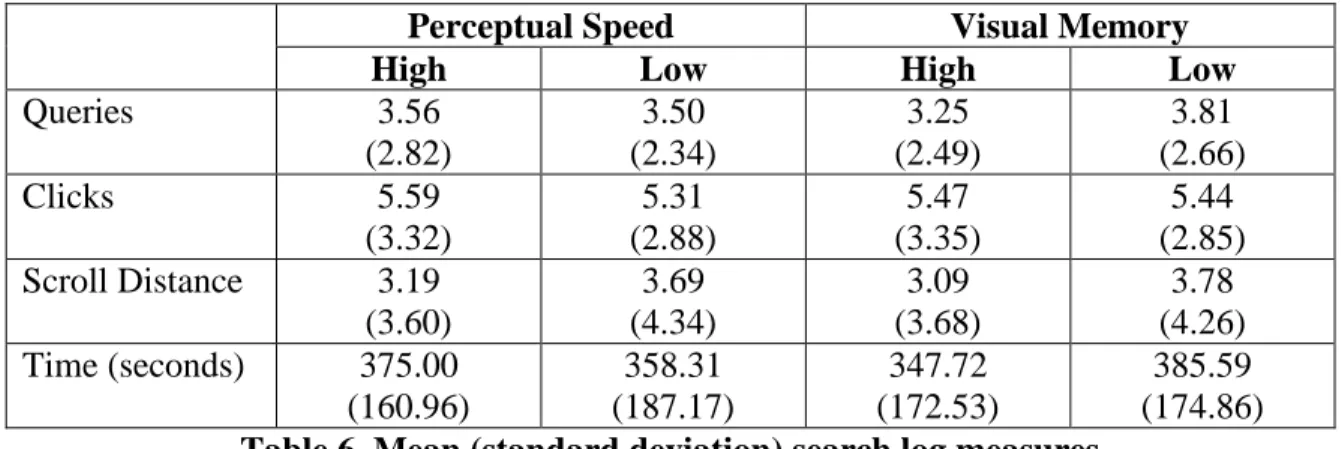
Table 6 provides the mean and standard deviation for HPS/LPS and HVM/LVM
search behavior metrics.
Perceptual Speed Visual Memory
High Low High Low
Queries 3.56
(2.82) 3.50 (2.34) 3.25 (2.49) 3.81 (2.66)
Clicks 5.59
(3.32) 5.31 (2.88) 5.47 (3.35) 5.44 (2.85) Scroll Distance 3.19
(3.60) 3.69 (4.34) 3.09 (3.68) 3.78 (4.26) Time (seconds) 375.00
(160.96) 358.31 (187.17) 347.72 (172.53) 385.59 (174.86)
Table 6. Mean (standard deviation) search log measures
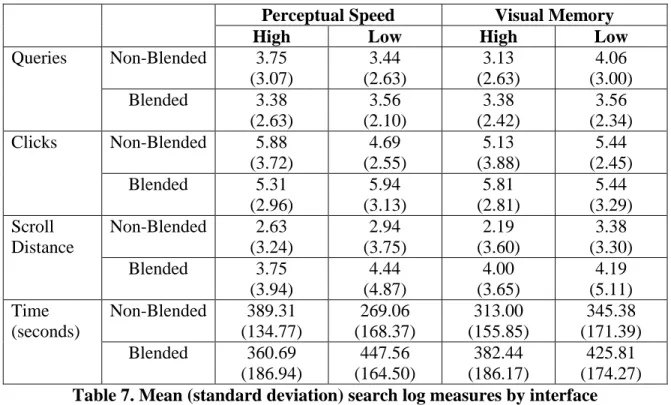
Table 7 provides the mean and standard deviation for HPS/LPS and HVM/LVM by interface for search behavior metrics. Perceptual Speed did not have a significant
Scroll Distance standard deviation reveals that these metrics vary widely and cannot be used to determine if a relationship exists among scroll distance, blended and
non-blended interface and cognitive ability. The time metric suggests that participants did not use the full time allotted but this is misleading as time represents time spent within
the interface. If a participant selected a specific web result and left the interface to visit that site, their time spent on that site was not recorded. There was not a significant relationship for Perceptual Speed on time [F(1,63)=.164, p=0.68] but the combination of
perceptual speed and interface was significant [F(1,63)=6.325, p=0.02]. There was not a significant relationship for Visual Memory [F(1,63)=.774, p=0.38].
Perceptual Speed Visual Memory
High Low High Low
Queries Non-Blended 3.75 (3.07) 3.44 (2.63) 3.13 (2.63) 4.06 (3.00) Blended 3.38
(2.63) 3.56 (2.10) 3.38 (2.42) 3.56 (2.34) Clicks Non-Blended 5.88
(3.72) 4.69 (2.55) 5.13 (3.88) 5.44 (2.45) Blended 5.31
(2.96) 5.94 (3.13) 5.81 (2.81) 5.44 (3.29) Scroll Distance
Non-Blended 2.63 (3.24) 2.94 (3.75) 2.19 (3.60) 3.38 (3.30) Blended 3.75
(3.94) 4.44 (4.87) 4.00 (3.65) 4.19 (5.11) Time (seconds)
Non-Blended 389.31 (134.77) 269.06 (168.37) 313.00 (155.85) 345.38 (171.39) Blended 360.69
(186.94) 447.56 (164.50) 382.44 (186.17) 425.81 (174.27)
Table 7. Mean (standard deviation) search log measures by interface
Table 8 provides the mean and standard deviation for SERP clicks in blended and non-blended interfaces by cognitive ability (n=32). In the non-blended interface, clicks
p=0.25). This was also the case for higher visual memory participants (t=-.147, p=0.89). In the blended interface, clicks were conducted almost exclusively on Everything SERPs,
indicating a general lack of use of the integrated verticals. However, neither higher perceptual speed participants (t=.368, p=0.72) or higher visual memory participants
(t=1.462, p=0.16) clicked significantly more on the Everything SERPs.
Not unexpectedly, News was inactive. Somewhat surprising, however, is that Shopping SERPs were not more actively used, particularly since task #3 is directly
related to shopping (outfit a new living room). Also surprising is that Image and Video SERPs were not more actively used, as task #2 (design a soapbox derby car) would seem
to generate clicks in these areas.
Perceptual Speed Visual Memory
High Low High Low
SERP Web Non-Blended 5.88 (3.72) 4.56 (2.48) 5.13 (3.88) 5.31 (2.41) Blended 0.00
(0.00) 0.63 (2.25) 0.00 (0.00) 0.63 (2.25) SERP Image Non-Blended 0.00 (0.00) 0.00 (0.00) 0.00 (0.00) 0.00 (0.00) Blended 0.00
(0.00) 0.25 (0.77) 0.00 (0.00) 0.25 (0.77) SERP News
Non-Blended 0.00 (0.00) 0.00 (0.00) 0.00 (0.00) 0.00 (0.00) Blended 0.00
(0.00) 0.00 (0.00) 0.00 (0.00) 0.00 (0.00) SERP Shopping Non-Blended 0.00 (0.00) 0.13 (0.50) 0.13 (0.50) 0.00 (0.00) Blended 0.00
(0.00) 0.00 (0.00) 0.00 (0.00) 0.00 (0.00) SERP Video Non-Blended 0.00 (0.00) 0.00 (0.00) 0.00 (0.00) 0.00 (0.00) Blended 0.00
(0.00) 0.06 (0.25) 0.06 (0.25) 0.00 (0.00) SERP Everything
Blended 5.31 (2.96) 5.00 (2.73) 5.75 (2.74) 4.56 (2.83)
4.3
User Preference
After each system, participants completed a questionnaire that consisted of the System Usability Scale and the Engagement Scale (see Appendix). Table 9 presents the System Usability Scale scores by interface (n=224). The non-blended interface was found
to be significantly more usable (t=6.279, p<0.01).
Blended Non-Blended
System Usability Scale 3.47 (1.09)
3.96 (0.82)
Table 9. Mean (standard deviation) of the System Usability Scale by Interface
Table 10 presents the mean and standard deviation of the System Usability Scale
scores. The SUS scores are significant in terms of perceptual speed ability
[F(1,447)=23.837, p<0.01]. Higher perceptual speed participants found the systems more usable than lower perceptual speed participants. There was an opposite significant effect
for visual memory [F(1,447)=9.128, p<0.01]. Lower visual memory participants found the systems more usable then high visual memory participants.
Perceptual Speed Visual Memory
High Low High Low
Non-Blended
4.15 (0.67)
3.77 (0.90)
3.80 (0.89)
4.12 (0.71)
Blended 3.71
(0.92)
3.23 (1.19)
3.36 (1.11)
3.59 (1.05)
Table 10. Mean (standard deviation) of the SUS by Cognitive Ability
Participation engagement with each system was recorded as part of the system questionnaire. Table 11 provides the mean and standard deviation of the Engagement
Scale sub-scales and Search Effectiveness by blended and non-blended interface. Paired sample t-tests reveal that three of the measures were not significant at the 95%
confidence interval. Two measures, search effectiveness and perceived usability were
Measure Blended Non-Blended t Value
Endurability 3.47
(1.15)
3.75 (0.73)
1.727
Focused Attention 2.94 (1.16)
2.95 (1.05)
-.219
Felt Involvement 3.63
(0.94)
3.65 (0.81)
.148
Perceived Usability 3.53 (1.16)
4.05 (0.87)
4.403*
Search Effectiveness 3.41 (1.13)
3.79 (0.87)
2.268*
*Significant at 0.05
Table 11. Mean (standard deviation) of Engagement Sub-Scale by Interface
Each individual sub-scale was also evaluated with regard to cognitive ability and interface. Table 12 presents the mean and standard deviation of each Engagement
Sub-Scale by cognitive ability and interface (blended or non-blended). The t-values are also identified and significance noted. Four of the five engagement measures were significant in the blended interface for higher perceptual speed participants. In the non-blended
interface, only one measure was significant for higher perceptual speed participants. None were significant on either interface for visual memory.
Within the Endurability sub-scale, participants were specifically asked if they felt their search was successful. Between the two interfaces (n=16), there was not a
significant difference (t=.972, p=0.35). Table 13 presents the mean and standard
deviation of successful search. Higher perceptual speed participants, however, responded with significantly greater frequency than lower perceptual speed participants that they
System Measure Perceptual Speed Visual Memory
High Low t-value High Low t-value
Blended Endurability 3.84 (0.92)
3.09 (1.25)
3.157* 3.41 (1.24) 3.53 (1.08) -.560 Focused Attention 2.91 (1.23) 3.06 (1.11)
-.596 3.13 (1.18) 2.84 (1.14) 1.605 Felt Involvement 3.92 (0.83) 3.33 (0.96)
2.933* 3.67 (0.92) 3.58 (0.97) .385 Perceived Usability 3.95 (1.07) 3.11 (1.11)
4.225* 3.45 (1.16) 3.61 (1.17) -.844 Search Effectiveness 3.73 (0.99) 3.10 (1.19)
2.737* 3.35 (1.12) 3.48 (1.15) -.558 Non-Blended Endurability 3.91 (0.59) 3.59 (0.84)
1.667 3.75 (0.88) 3.75 (0.57) 0.000 Focused Attention 2.78 (1.04) 3.13 (1.04)
-1.686 2.94 (1.05) 2.97 (1.06) -.117 Felt Involvement 3.79 (0.66) 3.50 (0.93)
1.273 3.50 (0.88) 3.79 (0.72) -1.273 Perceived Usability 4.36 (0.67) 3.75 (0.94)
4.168* 3.96 (1.04) 4.14 (0.64) -1.121 Search Effectiveness 3.85 (0.80) 3.73 (0.93)
.658 3.90 (0.93)
3.68 (0.80)
1.102
*Significant at 0.05
Table 12. Mean (standard deviation) of Engagement Sub-Scales by Cognitive Ability
Perceptual Speed Visual Memory
High Low High Low
Blended 4.13
(0.99) 2.88 (1.36) 3.38 (1.51) 3.63 (1.19) Non-Blended 4.00 (0.00) 3.75 (0.71) 4.00 (0.53) 3.75 (0.46)
Table 13. Mean (standard deviation) of Successful Search by Cognitive Ability
This is contrary to other studies where cognitive abilities have shown to not be an impact on perceived success of search experience (Al-Maskari and Sanderson, 2011).
Participants completed an exit questionnaire asking them if they used the top and side verticals. Higher perceptual speed participants primarily indicated they did not use the verticals. Table 14 presents the response count by cognitive ability. This was
was not, however, a significant relationship between self-identified vertical use and visual memory (x2=0.627, p=0.43).
Perceptual Speed Visual Memory
High Low High Low
Yes 0 5 2 3
No 7 1 5 3
Table 14. Count of Self-Identified Vertical Use by Cognitive Ability
The exit questionnaire also asked them to compare the two interfaces (blended, non-blended) and to select a best interface. Table 15 presents the response count for
interface preference questions. Ten of the participants selected the non-blended interface as the best overall, three selected the blended interface and three thought they were the same overall. Two participants noted that the blended was too cluttered and they did not
want to scroll to find the results they wanted.
The preference for the non-blended interface, regardless of cognitive ability,
stands out. The preference based on BEST information or BEST OVERALL using Perceptual Speed, however, is not significant (x2=3.733, p=0.15). It is also not significant for EASIEST to use (x2=5.167, p=0.08). Preference based on Visual Memory is also not
significant for BEST information or BEST OVERALL (x2=0.667, p=0.72). It is also not significant for EASIEST to use (x2=1.167, p=0.56).
Perceptual Speed Visual Memory
High Low High Low
BEST information?
Blended 1 2 1 2
Non-Blended 4 6 5 5
No Difference 3 - 2 1
EASIEST to use? Blended - 2 1 1
Non-Blended 3 5 5 3
No Difference 5 1 2 4
BEST OVERALL
Blended 1 2 1 2
Non-Blended 4 6 5 5
No Difference 3 - 2 1
5
Discussion
Results from the study indicate that perceptual speed and visual memory are not
significant factors for search behavior in vertical search. Perceptual speed has previously shown to impact search behavior but may not be a significant factor in vertical search
(Brennan, et al., 2014; Peters, et.al, 1988; Al-Maskari and Anderson, 2011). This could be an anomaly due to the data collected. The study used clicks and queries captured
inside the interface program. Any clicks or queries executed outside of the interface would not have been captured and could be skewing the data. Future studies should consider capturing queries and clicks throughout the session in addition to other behavior
metrics, such as URLs visited. Visual memory also did not significantly impact search behavior, which is consistent with other studies (Velez, et al., 2005; Chen, 2000;
Gwizdka, 2011). The scrolls data was too inconsistent to measure significance but may show to be a factor in future studies that consider scrolling and can be compared to results from Gwizdka (2011).
While behavior metrics may not have shown to be significant it is worth noting that higher perceptual speed participants indicated that they did not use the verticals. In
the exit questionnaire, participants were asked if they saw the verticals at the top and side of the screen. Higher perceptual speed participants indicated that they did not use these even if they noticed them. This could indicate that perceptual speed may influence how
al. (2014). Those that said they saw the verticals at the top and side of the screen but did not use them paused when asked why. It seemed an after thought that they could or
should have used them in some situations. Participants noted that if they clicked on a vertical they expected it would narrow their search by type vs. by function. For example, nearly all participants used ‘image’ as an example of what they would expect if they
clicked on a vertical. More research could be done to see if vertical use increases if they are more interactive. For example, a searcher may want to choose which verticals they
see and in what order.
Separately, higher visual memory searchers were found to prefer the non-blended
interface. They noted that if they wanted images or videos, they would have searched for them specifically. This is similar to findings in vertical search preference during multi-session tasks done by Bron, et al. (2013) where they noted that blended results were
preferred when participants started a task or when they incurred an information need. Once a task was understood, participants preferred using the non-blended (tabbed) to
narrow the results. This may also explain why the non-blended display was reported to be significantly more effective and usable. This does not indicate that the blended display was not effective or useful but perhaps other factors influenced the participant, but ,
cognitive ability aside, participants felt more engaged with the non-blended display. The results also indicate that perceptual speed and visual memory do not
significantly impact preference in blended or non-blended display, yet perceptual speed is a factor in engagement with a blended display. This may be due to previous experience with the search task domain, particular task, or relating their experience to a general
more motivation for one task over another, which may have influenced their behavior. It may also be due to the blended display providing results in static blocks. If vertical
results were dynamically blended to match the information need, perhaps the non-blended would not have been preferred. Another factor could be the study itself. It was
6
Conclusion
How result merging works and how it is presented to users are critical issues to
vertical search and there have yet to be answers that solve for all scenarios. Future research will continue to refine these methods and attempt better solutions but must be
validated and will likely need to include more work to account for user behavior and design. Using the system to identify relevancy has proven to work in certain
environments, but interesting research questions will seek to apply the work being done on personal search to vertical search, whereby a user may indicate which sources are relevant rather than the system.
This study set out to research relationships between cognitive ability and vertical search in regards to behavior and preference. A literature review revealed that cognitive
abilities have been researched in IR and shown to be a factor in single collections and general Web search (Navarro-Prieto, Scaife, and Rogers, 1999; Kim and Allen, 2002; Downing, Moore, and Brown, 2005; Al-Maskari and Sanderson, 2011; Brennan, Kelly,
and Arguello, 2014). There is also evidence that vertical search display influences use and may be preferential on an individual basis (Arguello, et al., 2012).
This study found that the cognitive abilities of perceptual speed and visual memory could play a role in vertical search behavior and preference. Differences in clicks and queries were not significant but that could have been a limitation of the study.
cognitive ability and could be investigated further. This study provides additional evidence for cognitive ability and vertical interface preference and could be used to
support larger studies.
Future research may seek to expand a cognitive ability test in vertical search
interfaces to a larger population, adding metrics of total URLs visited, more comprehensive metrics on time, and performance metrics, such as relevancy. Also, flexibility with verticals and cognitive ability can be explored in ways that enable
verticals to be promoted or demoted based on search query. Future questions may seek to understand how cognitive ability assessment can be accounted for in result merging and
7
References
Al-Maskari, A. and Sanderson, M. (2011). The effect of user characteristics on search effectiveness in information retrieval. Information Processing and Management, 47, 719-729.
Allen, B. (1994). Perceptual speed, learning and information retrieval performance.
Proceedings of the 17th annual international ACM SIGIR conference on Research and development in information retrieval, 71-80.
Anderson, L.W. and Krathwohl, D.A. (2001). A taxonomy for learning, teaching and assessing: A revision of Bloom’s taxonomy of education objectives. New York: Longman.
Arguello, J. and Capra, R. (2012) The effect of aggregated search coherence on search behavior. Proceeding of the 21st ACM International Conference on Information and Knowledge Management, 1293-1302.
Arguello, J., Diaz, F. and Callan, J. (2011). Learning to aggregate vertical results into web search results. Proceeding of the 24th ACM International Conference on Information and Knowledge Management, 201-210.
Arguello, J., Wu, W.-C., Kelly, D., and Edwards, A. (2012). Task complexity, vertical display and user interaction in aggregated search. Proceedings of SIGIR, 435-444. Borgman, C.L. (1989). All users of information retrieval systems are not created equal:
An exploration into individual differences. Information Processing & Management, 25(3), 237-251.
Borland, P. (2003). The IIR evaluation model: A framework for the evaluation of
interactive information retrieval systems. Information Research, 8(3), paper 152. Brennan, K., Kelly, D. and Arguello, J. (2014). The Effect of Cognitive Abilities on
Information Search for Tasks of Varying Levels of Complexity. Proceedings of the 5th Information Interaction in Context Symposium, 165-174.
Carroll, J. B. (1993). Human Cognitive Abilities: A Survey of Factor-analytic studies. NY, Cambridge University Press.
Chen, C. (2000). Individual differences in a spatial-semantic virtual environment. Journal of the American Society for Information Science, 51(6), 529-542.
Conati, C. and Maclaren, H. (2008). Exploring the role of individual differences in information visualization. Proceedings of the Working Conference on Advanced Visual Interfaces, Napoli, Italy.
Debowski, S., Wood, R.E. and Bandura, A. (2001). Impact of guided exploration & enactive exploration on self-regulatory mechanisms & information acquisition through electronic search. Journal of Applied Psychology, 86 (6), 1129-1141.
Downing, R.E., Moore, J.L. and Brown, S.W. (2005). The effects of interaction of spatial visualization and domain expertise on information seeking. Computers in Human Behavior, 21, 195-209.
Ekstrom, R.B., French, J.W., Harman, H.H. and Dermen, D. (1976). Kit of Factor-Referenced Cognitive Tests. Educational Testing Service, Princeton, NJ.
Gwizdka, J. (2004). Cognitive abilities, interfaces and tasks: Effects on prospective information handling in email. (NQ94431 Ph.D.), University of Toronto (Canada), Ann Arbor. ProQuest Dissertations & Theses Full Text database.
Hess, B., (1999). Graduate student cognition during information retrieval using the World Wide Web: a pilot study. Computers & Education, 33, 1-13.
Kelly, D., Arguello, J., Edwards, A. and Wu, W.-C. (2015). Development and evaluation of search tasks for IIR experiments using a cognitive complexity framework. In
Proceedings of the International Conference on the Theory of Information Retrieval (ICTIR ’15), Northampton, MA.
Kim, K. and Allen, B. (2002). Cognitive and task influence on web searching behavior.
Journal of the American Society for Information Science and Technology, 53(2), 109-119.
Moffat, A., Bailey, P., Scholer, F. and Thomas, P. (2014). Assessing the cognitive complexity of information needs. Proceedings of the 2014 Australasian Document Computing Symposium, 97-100.
O’Brien, H.L. and Toms, E.G. (2010). The development and evaluation of a survey to measure user engagement. Journal of the American Society for Information Science and Technology, 61 (1), 50-69.
Peters, R.D., Yastrop, G.T. and Boehm-Davis, D.A. (1988). Predicting information retrieval performance. Proceedings of the Human Factors Society, 301-305.
Sushmita, S., Lalmas, M., Joho, H. and Villa, R. (2010). Factors Affecting Click-Through Behavior in Aggregated Search Interfaces. Proceedings of the 19th ACM
International Conference on Information and Knowledge Management, 519-528.
Velez, M.C., Silver, D. and Tremaine, M. (2005). Understanding visualization through spatial ability differences. IEEE Visualization, 511-518.
White, R.W., Richardson, M., Bilenko, M. and Heath, A.P. (2008). Enhancing Web Search by Promoting Multiple Search Engine Use. Proceedings of the 31st
International ACM SIGIR conference on Research and Development in Information Retrieval, 43-50.
Wu, W.-C., Kelly, D., Edwards, A. and Arguello, J. (2012). Grannies, tanning beds, tattoos and NASCAR: Evaluation of serach tasks with varying levels of cognitive complexity. Proceedings of IIiX 2012.
8
Appendix
Table 16 is Part I of the Post System Questionnaire and is based on the System
Usability Scale (SUS) using the (Five-Point Likert Scale, Strongly Disagree to Strongly Agree).
No. Statement
1 I think that I would like to use this system frequently.
2 I found it easy to determine which results I had already saved. 3 I found the system unnecessarily complex.
4 I thought the system was easy to use.
5 I think that I would need the support of a technical person to be able to use this system.
6 I found the various functions in this system were well integrated. 7 I thought it was difficult to tell which results I had already seen. 8 I thought there was too much inconsistency in this system. 9 I found it difficult to explore the search topics with this system.
10 I would imagine that most people would learn to use this system very quickly. 11 I found the system very cumbersome to use.
12 I felt very confident using the system.
13 I needed to learn a lot of things before I could get going with this system. 14 I thought it was easy to navigate through the results.
Table 17 is Part II of the Post System Questionnaire and represents the Engagement Scale and Search Effectiveness scale using the (Five-Point Likert Scale,
Strongly Disagree to Strongly Agree). The sub-scales are also identified.
No. Statement Sub-scale
1 Searching on this system was worthwhile. Endurability 2 I was so involved in my search experiences that I
lost track of time.
Focused Attention
3 I was really drawn into my searching tasks. Felt Involvement 4 The system provided enough information to help
me solve the search tasks.
Search Effectiveness
5 The system provided me with many different kinds of information.
Search Effectiveness
6 I was absorbed in the searching tasks. Focused Attention 7 I felt involved in the searching tasks. Felt Involvement 8 Using this search system was mentally taxing. Perceived Usability 9 The presentation of search results helped me easily
combine the different types of information.
Search Effectiveness
10 I felt in control of my searching experience. Perceived Usability 11 When I was searching, I lost track of the world
around me.
Focused Attention
12 The presentation of search results allowed me to easily identify relevant information.
Search Effectiveness
13 My search experiences were rewarding. Endurability
14 I felt annoyed while using this search system. Perceived Usability 15 I found this search system confusing to use. Perceived Usability 16 The presentation of search results helped me get an
overview of the type of information available.
Search Effectiveness
17 I could not do some of the things I needed to do with this search system.
Perceived Usability
18 I consider my search experience successful. Endurability 19 My search experiences did not work out as I had
planned.
Endurability
20 The time I spent searching just slipped away. Focused Attention 21 I felt discouraged while using this search system. Perceived Usability 22 The search experience was demanding. Perceived Usability 23 The search experience was fun. Felt Involvement