Detection and Quantification of
Vibrio cholerae
in Water Using the Compartment
Bag Test
Department of Environmental Sciences and Engineering in Gillings School of
Global Public Health
Kristin Weiss
PI: Dr. Mark Sobsey
I. Abstract
Diarrheal disease is the second leading cause of death among children under the age of
five, taking 502,000 young lives worldwide each year. Cholera is an acute diarrheal disease
caused by the bacterium Vibrio cholerae that, if left untreated, can be fatal. Cholera is endemic
to many areas of the world, especially in areas that lack infrastructure to provide clean drinking
water. Effective disease control depends on timely detection of V. cholerae in drinking water.
Currently available detection methods for V. cholerae are rarely applied to surveillance of
drinking water because they require electricity, specialized equipment, and advanced training
that are rarely available in the developing world. An effective broth culture medium amenable to
field testing is needed to quantify V. cholerae in drinking water sources. Therefore, the aim was
to develop a V. cholerae-specific broth culture medium that could be used with an existing field
test method, the Compartment Bag Test (CBT). The quantification of V. cholerae concentration
was compared in a CBT to the quantification of V. cholerae concentration in a Multiple Tube
Test (MTT) for three strains of V. cholerae: O1, El Tor Ogawa (ATCC BAA-2163), O139
(ATCC 9-51395), and Non-O1 (ATCC 35971). The sample matrices used were deionized water
with Tellurite Taurocholate Gelatin Broth (TTGB) medium, EPA’s 3.3.1. General Test Water
with TTGB medium, and autoclaved surface water from Morgan Creek in Chapel Hill, NC, with
TTGB medium. The differences in quantification by these two methods were not statistically
effective as the MTT to quantify concentrations of V. cholerae for all three strains tested. For
future studies, the natural water matrix should be untreated. This matrix would give a better
representation of the efficacy of the CBT out in the field. Through the employment of the
adapted CBT it is the hope that exposure to V. cholerae can be decreased by increasing
surveillance in drinking water sources.
II. Introduction
Diarrheal disease is the second leading cause of death among children under the age of
five, taking 525,000 young lives worldwide each year1. Cholera is an acute diarrheal disease
caused by the bacterium Vibrio cholerae that, if left untreated, can be fatal. In the developed
world, cholera does not pose an imminent threat because it is preventable through proper water
decontamination to purify drinking water. If contracted in the developed world, cholera can be
treated promptly with oral rehydration solution2. However, in low-resource areas and disaster
settings cholera can have devastating effects. There are an estimated 1.3 to 4.0 million cases of
cholera a year and between 21,000-143,000 deaths resulting from choleraeach year2. V. cholerae
in drinking water,whether already present in the water from natural sources, or fecal
contamination, or reintroduced by people via fecal contamination, causes many of the observed
cholera cases.Reintroduction of V. cholerae in communities occurs when people ingest and
digest the bacterium, become infected, shed the bacterium fecally and thereby return it back to
the environment2. The major public health threat that cholera poses is indicative of inadequate
infrastructure, resources, and management practices throughout some parts of the world. Cholera
infrastructure, and other resources and abilities to provide clean drinking water, both a basic
human right and a necessity for survival.
Effective disease prevention and control depends on timely detection of V. cholerae in
drinking water. Present detection methods for V. cholerae are rarely applied to surveillance of
drinking water because they require electricity, specialized equipment and materials, and
advanced training not available in the developing world. This project aims to create a sustainable
field-test to detect and quantify V. cholerae in drinking water sources located in low-resource
and disaster settings. The Compartment Bag Test (CBT) is a simple, low-cost, sustainable, and
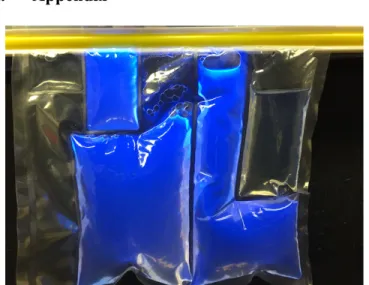
portable field-test used to detect and quantify E. coli in water3. A visual of the CBT can be seen
in Figure 1 in the Appendix. The aim is to adapt the CBT to detect and quantify V. cholerae
bacteria in drinking water by using a V. cholerae-specific broth culture medium containing V.
cholerae-specific chromogenic substrates and indicator chemicals. Currently, detection and
quantification of V. cholerae relies primarily on laboratory evaluation, as there is not a
sustainable field-test to detect and quantify V. cholerae in water4. To date, there is not a broth
culture medium that is sensitive and specific for V. cholerae growth in drinking water that can
also suppress all background organisms and provide results in one culture step rather than
multiple culture steps and further confirmation tests. The result of this research would provide a
one-step, simple, portable, user-friendly test to transform cholera surveillance and early outbreak
or occurrence detection in low-resource and disaster settings.
Through previous experimentation the candidate medium being tested for this approach,
Tellurite Taurocholate Gelatin Broth (TTGB), has proven to grow three strains of V. cholerae:
O1, El Tor Ogawa and O139 are both strains known to cause the classical symptoms of cholera.
The El Tor subtype was responsible for the seventh pandemic that broke out in 1961. The
Non-O1 strains of V. cholerae rarely possess virulence factors, however they can still cause
“self-limiting gastroenteritis, wound infections, and bacteraemia”5. V. cholerae concentrations that
grew in TTGB were compared to those grown as bacteria colonies on the non-selective Luria
Agar (LA), and two selective or differential agar media, Thiosulfate Citrate Bile Salts Sucrose
(TCBS) and Tellurite Taurocholate Gelatin Agar (TTGA), for selective growth of colonies. This
set of experiments illustrated that V. cholerae could be quantified using a selective broth culture
medium and quantal methods instead of counting V. cholerae colonies on differential or selective
agar media. The results were comparable to enumeration by spread plate on non-selective culture
media. This can be visualized in Figure 1 below. There was not a statistical difference in
detection of quantification of all three strains of V. cholerae between TTGB and LA (p>0.05)
(Table 1).
Table 1. Wilcoxon Signed Rank Test comparing LA to TTGB for quantification of 3 strains of V. cholerae.
ATCC BAA-2163 TTGB to LA P-value: 0.25
ATCC 9-51395 TTGB to LA P-value: 0.578
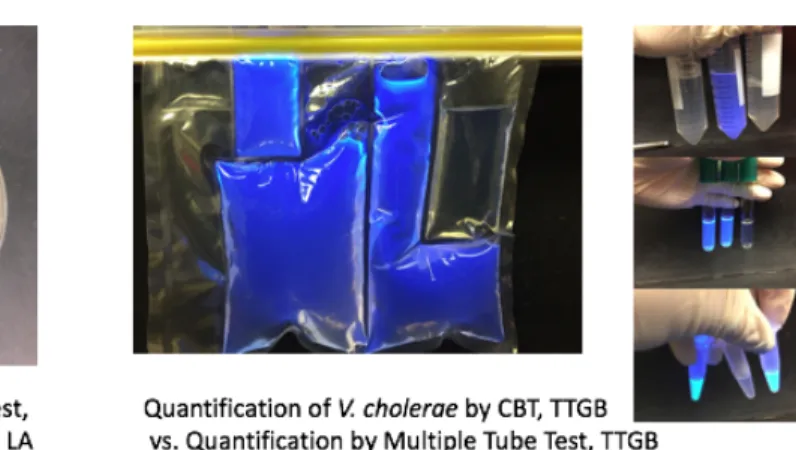
Figure 1. Illustration of the previous experimentation that led to the current study. V. cholerae was able to be effectively quantified using quantal methods in a broth culture medium as compared to the enumeration method of spread plating. This prompted the use of a culture broth medium in the CBT to compare quantification in the CBT to the quantal methods of an MTT.
Objectives
The aim was to compare CBT quantification to Multiple Tube Test (MTT) quantification
in order to determine if the CBT was accurate in estimating the concentration of three different
V. cholerae strainsin water containing TTGB medium for V. cholerae growth. This can be
visualized in Figure 1 above. Concentrations in units of Most Probable Number (MPN) were
compared. The experiment was run in three different waters: deionized water, 3.3.1. General Test
Water6 (GTW), and surface water from Morgan Creek (MC) in Chapel Hill, NC. The deionized
water was utilized to test the ability of the CBT to quantify V. cholerae concentrations to the
same degree as the MTT. The MTT method has been used for decades to analyze drinking water
sources7, usually without interference of turbidity, pH differences, or other background
organisms. The 3.3.1 General Test Water acted as a non-stressed matrix in which to compare the
quantification of the two methods and the MC water was a more realistic matrix, mimicking
GTW, the organic carbon component, tannic acid was used and for the dissolved solids, sodium
chloride was used. V. cholerae is potentially endemic to coastal marine waters in the USA.
However, the presence of V. cholerae in fresh waters in the USA is not expected because
infection rates of cholera in the US and other developed countries are low. Cholera has been
eliminated in mainland USA as a result of effective water and sewage treatment systems,
absence of endemic cholera in the mainland US population, accessibility to healthcare to treat
imported cases of cholera that may appear occasionally from other countries, and access to
bottled water during natural disasters8. Therefore, it was not expected that MC would contain V.
cholerae in Chapel Hill, NC.
II. Materials and Methods Preparing V. cholerae samples
Overnight cultures of V. cholerae ATCC BAA-2163, V. cholerae ATCC 9-51395, and V.
cholerae ATCC 35971 were prepared in 100mL Alkaline Peptone Water and incubated at 37°C
for 18 to 24 hours on a stir plate at 100 rpm. These overnights were used in the deionized (DI)
water matrix. Overnight cultures of V. cholerae ATCC BAA-2163, V. cholerae ATCC 9-51395,
and V. cholerae ATCC 35971 were also prepared in 100mL of Luria Broth (LB) and incubated at
37°C for 18 to 24 hours on a stir plate at 100 rpm. A serial 10-fold dilution series through 10-7
-fold was performed with each V. cholerae bacteria sample in LB using Standard Methods
Phosphate Buffer (PB) as diluent. From 1:10 dilutions in PB 100µL volumes of the 10-5, 10-6and
10-7 dilutions were plated on LA. A duplicate of each dilution was plated. These plates were
incubated at 37°C for 24 hours. The dilution that resulted in a spread plate count of 1-48 colony
1-48 CFU is the ideal concentration range for a CBT to be able to detect and quantify bacteria
accurately9. The V. cholerae samples were stored in LB at 5°C for 24 hours. These overnights
were used in the GTW and MC water matrices.
TTGB in Deionized Water Matrix
A solution of TTGB in DI water was prepared. Serial 10-fold dilutions were performed
for each strain of V. cholerae in Standard Methods PB. In a 3x5 set up, 9mL of the TTGB was
dispensed into all fifteen 10mL autoclaved test tubes. Then, 0.1mL of the lowest dilution was
spiked into five of the test tubes and the tubes were capped. This was then repeated for the next
two higher dilutions. Therefore, the total volume of diluted sample analyzed in this way was
1.5mL. This was repeated so that each tube had a duplicate. The entire process was repeated for
each strain of V. cholerae. A 1mL volume of the desired dilution of V. cholerae overnight culture
was added to 99mL of the TTGB solution, and this was dispensed into a CBT. A duplicate for
each strain was prepared. The CBTs were sealed and then the MTTs and CBTs were incubated at
37°C for 24 hours.
TTGB in General Test Water
A 2x solution of TTGB in GTW was prepared. Serial dilutions were again performed for
each strain of V. cholerae in Standard Methods PB. A 50mL volume of the 2x TTGB was added
to 49mL of GTW water and then 1mL of the desired V. cholerae sample dilution was added to
this. This set-up was repeated four times for each strain. Two of these 100mL samples were
dispensed into two CBTs. The CBTs were sealed and incubated at 37°C for 24 hours. The other
two samples were used in the MTT. Volumes of 0.3mL of each V. cholerae sample were
dispensed into three 10mL sterile test tubes and 30mL of each sample were dispensed into three
50mL sterile conical centrifuge tubes. This MTT procedure was repeated so that each strain had
a replicate. For each V. cholerae strain there were a resulting preparation of two CBTs and two
MTTs per trial. The MTTs were also incubated at 37°C for 24 hours. A negative control was also
dispensed into a CBT and this CBT was also incubated at 37°C for 24 hours.
Checking Results and Obtaining MPN Values
After the incubation time, the MTTs and CBTs for all three strains were examined and
the negative control CBT was checked. A long-wave UV light was used to identify the tubes and
compartments that fluoresced due to the presence and growth of V. cholerae. Fluorescence under
the long-wave UV light was counted as a positive and the absence of fluorescence was counted
as a negative. Data from the test tubes was recorded and concentration was determined as
MPN/100mL based on which tubes were positive and which were negative and the sample
volumes they represented. MPN is a standard unit of measure based on maximum likelihood
estimation of the bacteria concentration from the results of multiple sample volumes scored as
positive and negative for growth of the target bacteria10. The WHO’s Guidelines for
Drinking-Water Quality provides a standard chart to determine the MPN (Figure 3 in Appendix). The CBT
produced by Aquagenx provides a chart that can be used to determine MPN based on the WHO’s
“Guidelines for Drinking Water Quality”. Depending on which compartments are positive and
negative, an MPN is determined (Figure 4 in Appendix).
TTGB in Local Surface Water Matrix
The entire procedure used for GTW was repeated replacing the GTW water with surface
being used, the Morgan Creek water was autoclaved before use in the CBTs and MTTs. This
killed all the background organisms naturally present in Morgan Creek, but it retained the natural
constituents and organic matter, so that their influence on V. cholerae growth could be evaluated.
The pH and turbidity of the GTW and the Morgan Creek surface water were also recorded each
time (Table 1 in Appendix).
Data Analysis
The average MPN of each trial was calculated and a Box and Whisker Plot for each
Vibrio strain in each matrix was produced. A Wilcoxon Signed Rank Test was run in R studio for
each strain comparing the CBT MPN to the MTT MPN, in each matrix. For each strain, the same
test was run between the GTW matrix and the MC water matrix comparing the MTTs to one
another, the CBTs to one another, and the MTT to the CBT between matrices. In the DI water
matrix, a Wilcoxon Signed Rank Test was run in R studio between the CBT and MTT for each
strain.
III. Results
The median concentration for V. cholerae ATCC BAA-2163 in DI water in the CBT was
3.10x10² MPN/100mL and the median concentration in the MTT was 1.50x10² MPN/100mL
(n=5). These values are not statistically different (Table 2, p>0.05). The range of values for this
Table 2. Wilcoxon Signed Rank Test to determine the significance of the differences in quantification between an MTT and CBT MPN Tests for V. cholerae strains in DI water (n=5).
V. cholerae strain P-value
ATCC BAA-2163 1.0000
ATCC 9-51395 0.6250
ATCC 35971 0.3125
The median concentration for V. cholerae ATCC BAA-2163 in GTW in the CBT was
3.26x101 MPN/100mL and in the MTT was 3.80x101 MPN/100mL (n=5). In autoclaved MC
water the median concentration in the CBT was 4.83x101MPN/100mL and in the MTT was
1.22x101MPN/100mL (n=5). The differences in these values are not statistically significant, both
within and between matrices (Table 3, p>0.05). The range of values for this strain in GTW and
MC water can be seen in Figure 2 below.
Table 3. Wilcoxon Signed Rank Test to determine the differences in quantification for V. cholerae ATCC BAA-2163.
Comparison P-value
CBT to MTT in GTW 0.0625
CBT to MTT in MC 0.0625
GTW MTT to MC MTT 1
GTW CBT to MC CBT Could not compute due to tie
GTW MTT to MC CBT 0.3125
Figure 2. Box and Whisker Plot displaying the range of concentrations of V. cholerae strain O1, El Tor Ogawa (ATCC BAA-2163) observed from the CBT and the MTT in DI water, GTW, and MC water. The blue region corresponds to the upper quartile, the yellow region corresponds to the lower quartile, the border between them corresponds to the median, and the whiskers correspond to the minimum and maximum.
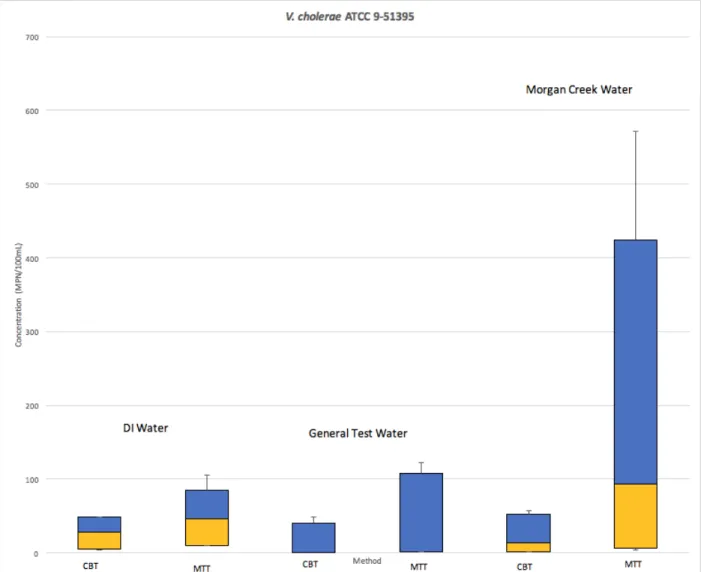
The median concentration for V. cholerae ATCC 9-51395 in DI water in the CBT was
2.80x101 MPN/100mL and the median concentration in the MTT was 4.60x101 MPN/100mL
(n=5). These values are not statistically different (Table 2, p>0.05). The range of values for this
strain in DI water can be seen in Figure 3 below.
The median concentration for V. cholerae ATCC 9-51395 in GTW in the CBT was
water the median concentration in the CBT was 1.36x101 MPN/100mL and in the MTT was
9.30x101 MPN/100mL (n=5). The differences in these values are not statistically significant,
both within and between matrices (Table 4, p>0.05). The range of values for this strain in GTW
and MC water can be seen in Figure 3 below.
Table 4. Wilcoxon Signed Rank Test to determine the differences in quantification for V. cholerae ATCC 9-51395.
Comparison P-value
CBT to MTT in GTW Could not compute due to tie
CBT to MTT in MC 0.0625
GTW MTT to MC MTT 0.0625
GTW CBT to MC CBT 0.0625
GTW MTT to MC CBT 0.6250
Figure 3. Box and Whisker Plot displaying the range of concentrations of V. cholerae strain O139 (ATCC 9-51395) observed from the CBT and the MTT in DI water, GTW, and MC water. The blue region corresponds to the upper quartile, the yellow region corresponds to the lower quartile, the border between them corresponds to the median, and the whiskers correspond to the minimum and maximum. Due to a small sample size, there is not a lower quartile for this strain of V. cholerae in GTW in the CBT or MTT.
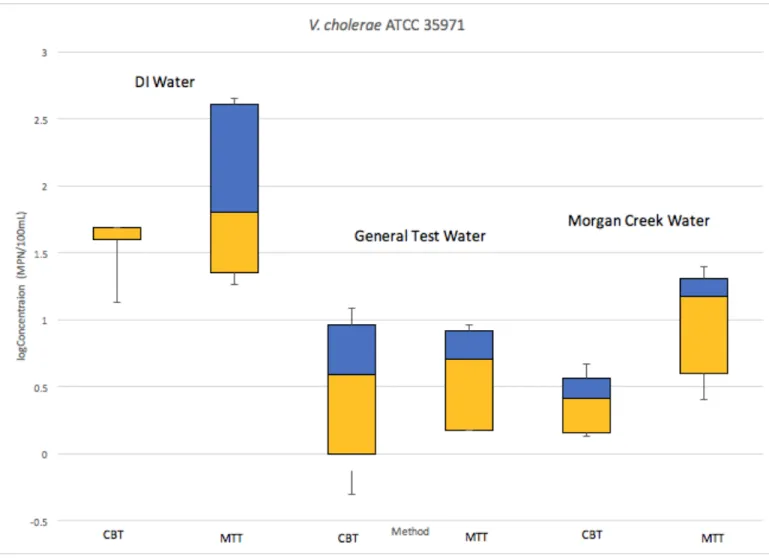
The median concentration for V. cholerae ATCC 35971 in DI water in the CBT was
4.83x101 MPN/100mL and the median concentration in the MTT was 6.83x101 MPN/100mL
(n=6). These values are not statistically different (Table 2, p>0.05). The range of values for this
strain in DI water can be seen in Figure 6 below.
The median concentration for V. cholerae ATCC 35971 in GTW in the CBT was
water the median concentration in the CBT was 2.60x100 MPN/100mL and in the MTT was
1.50x101 MPN/100mL (n=5). The differences in these values are not statistically significant,
both within and between matrices (Table 5, p>0.05). The range of values for this strain in GTW
and MC water can be seen in Figure 4 below.
Table 5. Wilcoxon Signed Rank Test to determine the differences in quantification for V. cholerae ATCC 35971.
Comparison P-value
CBT to MTT in GTW 0.6250
CBT to MTT in MC 0.1250
GTW MTT to MC MTT 0.1875
GTW CBT to MC CBT 0.8125
GTW MTT to MC CBT 0.3125
Figure 4. Box and Whisker Plot displaying the range of the log10 concentrations of V. cholerae strain Non-O1 (ATCC 35971) observed from the CBT and the MTT in DI water, GTW, and MC water. The blue region
corresponds to the upper quartile, the yellow region corresponds to the lower quartile, the lower border of the blue region corresponds to the median, and the whiskers correspond to the minimum and maximum. Due to a small sample size, there is not an upper quartile for this strain of V. cholerae in DI water in the CBT.
IV. Discussion
There was not a significant difference in quantification between the MTT and the CBT in
the DI matrix for all three strains of V. cholerae. The lack of significant differences suggests that
the CBT is able to quantify V. cholerae as well as the traditional method of quantification, MTT.
For a more definitive result, the number of trials should be increased for more power of
statistical analysis. DI water is also not a realistic representation of the waters where V. cholerae
realistic matrices. For a better comparison, the same volumes of water, preferably 100mL, should
be tested in the CBT and the MTT. This is why the MTT method for GTW and MC water used
100mL volumes and differed from the method used for the DI matrix, which was a very small
sample volume of 1.5mL.
There were not any significant differences in quantification between the CBT and the
MTT within GTW and MC water matrices for any of the strains of V. cholerae. This suggests the
CBT’s ability to quantify V. cholerae is comparable to that of the MTT. There were also not any
significant MPN concentration differences in the MTTs between matrices, in the CBTs between
matrices, or between the CBT and MTT MPNs of different matrices for any of the strains of V.
cholerae. The statistical analysis compared each method, MTT and CBT, in each of the more
realistic matrices to one another, and none of the MPN concentration differences were significant
at a 95% confidence interval. This suggests the CBT’s ability to quantify V. cholerae is not
limited to a single matrix, but is valid in natural water sources that have been autoclaved. The
results also suggest that the use of the CBT is not limited to a single strain of V. cholerae, but is
effective for O1, El Tor Ogawa, O139, and Non-O1 strains. However, these results have
limitations because only five trials of this comparison were performed. While there are
promising results, this comparison should be repeated to obtain more trials before any definitive
conclusions are drawn and to increase the power of the statistical analysis.
The MC water matrix, while a natural water source, was autoclaved. The water retained
its natural physical and chemical constituents, including organic matter, but background
organisms and spores were killed. Therefore, the influence of the presence of live and cultural
bacteria was not determined in this study. The candidate broth, TTGB, is not a perfect medium to
bacteria and prevent their possible growth in this medium. Before autoclaving, a double
pasteurization procedure was attempted to kill background microorganisms. The water was
pasteurized at 75°C for 10 minutes twice with 24 hours in between. This procedure still gave rise
to positive bacteria growth of interfering microorganisms in the negative control (data not
shown); therefore, it was decided to autoclave the water to kill all background microorganisms.
Before the CBT can be used to effectively detect V. cholerae in the field, a better broth culture
medium is necessary. However, the results from this study, while limited in trials, do suggest that
the CBT will be able to detect and quantify V. cholerae at a reasonable level, comparable to that
of a traditional method, the MTT. However, more trials comparing CBT and MTT quantification
in GTW and MC water are necessary using an improved culture medium more specific to V.
cholerae.
There are multiple media that are currently being evaluated for the growth of V. cholerae
to the exclusion of non-target microorganisms in our lab. Media described as selective for the
detection of V. cholerae include Cellobiose Polymixin Colistin (CPC) agar, CHROMagar Vibrio
agar, HardyCHROM Virbio agar, HiCHROM Vibrio, Sucrose Teepol Tellurite (STT) agar,
Thiosulfate-chloride-iodide (TCI) agar, Thiosulfate-citrate-bile salts-sucrose (TCBS) agar,
Taurocholate-tellurite-gelatin agar (TTGA), and Vibrio parahaemolyticys (VP) Agar. Of these
media, TCBS and CHROMagar Vibrio were successful in inhibiting the growth of non-target
organisms. They were adapted into broths by centrifugation and both broths inhibited the growth
of non-target organisms from a 1% primary effluent-natural water matrix. In future studies, these
two broths will be evaluated for detection and quantification of V. cholerae in the CBT, in the
V. Conclusion and Future Steps
The CBT was able to quantify three different strains of V. cholerae comparably to an MTT in
three different water matrices. In the DI water matrix, there were not any significant differences
between the CBT and the MTT for all three strains. In the more realistic matrices, GTW and
autoclaved MC water, there were also not any significant differences in quantification between
the CBT and the MTT within or between matrices, as well as no differences between the MTTs
or the CBTs between matrices. These results suggest that the CBT is a promising alternative to
the standard method of an MTT. However, due to limited number of trials, the experiments in the
more realistic matrices should be continued for greater statistical analysis.
The candidate medium used throughout the experiment, while intended to be specific to V.
cholerae, is not. Before the CBT can be used in field studies for V. cholerae, an improved broth
culture medium is required. Once a medium specific and selective for V. cholerae is developed, a
similar study to the one done here should be performed, to determine if this new medium
functions as effectively in a CBT format as in an MTT format. TCBS and CHROMagar Vibrio
media are both currently providing promising results in our lab to be evaluated in the CBT. The
surface water used in the experiment should also be untreated, in order to better represent waters
in the natural environment that might contain V. cholerae, as well as other bacteria.
If the results of future experiments document that an improved candidate broth medium is
effective in detecting and quantifying V. cholerae only with the CBT, there is justification for
field testing, product development, and global deployment. The new and improved medium will
be given to our partners for field testing at Rezodlo in Haiti and to our partners at the
International Center for Diarrheal Disease Research in Bangladesh. The results of this research
laboratory evaluation and the use of more complex culture tests4. Project results from studies
with a successful medium used in the CBT will be disseminated to scientific and practitioner
audiences through workshops and webinars facilitated by the resources and capacities of UNC.
Results will be submitted to disciplinary scientific journals and developed as technical outreach
information, including print and online trade journals of the field such as Journal of Water and
Health, International Journal of Environmental Research, and Public Health and Water Online.
The developed V. cholerae CBT field-test can be deployed for use by relief organizations, global
health programs, and drinking water management programs. This research has the potential to
impact diarrheal disease globally and empower individual communities to protect against the
threat of cholera.
VI. Resources
1. “Diarrheal Disease.” World Health Organization. World Health Organization, 2017 Web.
2. Cholera." World Health Organization. World Health Organization, 2016 Web.
3. "Connect." ASPPH | UNC Professor's Compartment Bag Tests Used for Water Quality
Monitoring in Rural Myanmar. N.p., 5 Jan. 2017. Web. 12 Feb. 2017.
4. Huq, Anwar, Bradd J. Haley, Elisa Taviani, Arlene Chen, Nur A. Hasan, and Rita R. Colwell.
"Detection, Isolation, and Identification of Vibrio cholerae from the Environment." Current protocols in microbiology. U.S. National Library of Medicine, 1 Aug. 2012. Web. 12 Feb. 2017. 5. Microbial Fact Sheets: Vibrio. (2011). In Guidelines for drinking-water quality, fourth edition
(pp. 255-256). Geneva: World Health Organization.
6. Guide Standard and Protocol for Testing Microbiological Water Purifiers. (1987). National Service Center for Environmental Protections.
7. Bertram, J., & Ballance, R. (1996). MICROBIOLOGICAL ANALYSES. In Water Quality Monitoring- A Practical Guide to the Design and Implementation of Freshwater Quality Studies and Monitoring Programmes. UNEP/WHO.
8. Griffitt, K. J., & Grimes, D. J. (april 2013). Abundance and Distribution of Vibrio cholerae, V. parahaemolyticus, and V. vulnificus Following a Major Freshwater Intrusion into the Mississippi Sound. Microbial Ecology, 65(3), 578-583.
doi:https://doi-org.libproxy.lib.unc.edu/10.1007/s00248-013-0203-6
9. Gronewold, A. D., Sobsey, M.D., & McMahan, L. (june 2017). The compartment bag test (CBT) for enumerating fecal indicator bacteria: Basis for design and interpretation of results. The Science of the Total Environment, 587, 102-107. Doi: 10.1016/j.scitotenv. 2017.02.055
10.Cochran, William G. “Estimation of Bacterial Densities by Means of the ‘Most Probable Number’” Biometrics, Vol. 6, No. 2, (Jun., 1950), pp. 105-116
11. Annex 5: Multiple-tube method for thermotolerant (faecal) coliforms. (n.d.). In Guidelines for
VII. Acknowledgements
This work was supported by the P3 Award Grant from the United States Environmental
Protection Agency. I would like to thank Dr. Mark Sobsey, Collin Coleman, and Megan Lott for continued support and guidance on this project. I would also like to thank Dr. Ann Matthysse who supported my work as my biology sponsor throughout this project.
VIII. Appendix
Figure 1. Fluorescing Compartment Bag Test from Aquagenx
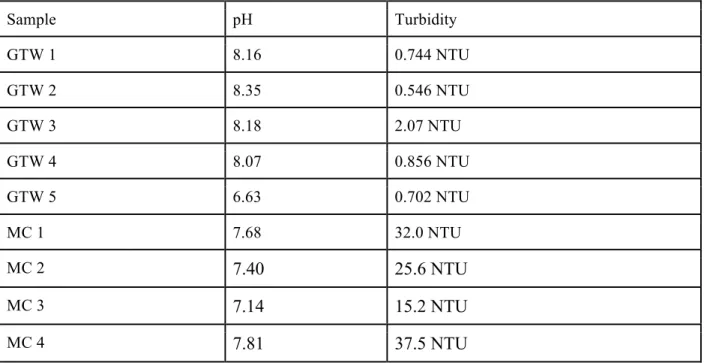
Table 1. pH and turbidity of GTW and MC water matrices.
Sample pH Turbidity
GTW 1 8.16 0.744 NTU
GTW 2 8.35 0.546 NTU
GTW 3 8.18 2.07 NTU
GTW 4 8.07 0.856 NTU
GTW 5 6.63 0.702 NTU
MC 1 7.68 32.0 NTU
MC 2 7.40 25.6 NTU
MC 3 7.14 15.2 NTU