IMPACT OF HURRICANE MATTHEW ON
DIABETES SELF-MANAGEMENT AND OUTCOMES
by
Kevin Travia
Honors Thesis
Department of Nutrition
University of North Carolina
2019
Approved:
TABLE OF CONTENTS
Abstract...2
Introduction...3
Specific Aims & Hypotheses...11
Brief Methods...12
North Carolina Medical Journal Manuscript…………...20
Concluding Thoughts...40
Appendix
…
...47
Abstract
INTRODUCTION: Individuals with diabetes require extensive self-management. Little is known about how a hurricane impacts diabetes self-management or outcomes and how it perpetuates health disparities in Robeson County, NC, a county where there is a high proportion of minority racial groups.
METHODS: Mixed methods were used to assess the impact of hurricanes on diabetes outcomes. Mean hemoglobin A1c (HbA1c) and frequency of diabetic ketoacidosis (DKA) from the Southeastern Regional Medical Center from 6 months before and after Hurricane Matthew (HM) were compared using Student t-tests. Individuals with diabetes
≥ age 18 in Robeson County were recruited for focus groups and administered questionnaires to understand the perceived impact of the hurricane on diabetes self-management. Healthcare providers were recruited for parallel key informant interviews.
RESULTS: 3,057 and 2,941 individuals had HbA1c measures available before and after HM, respectively. A demographic breakdown of 34.3% White, 21.7% Black or African American, and 21.4% American Indian or Alaska Native was observed in the sample representing 6 months after HM. No significant differences were found between mean HbA1c values before and after HM (before HM: mean HbA1c 8.34 ± 1.87%; after HM: mean HbA1c 8.31 ± 1.93 %; p=0.366). The period prevalence (PP) of DKA was higher in the 6 months after HM than before (before HM: 39 cases out of 4,025 visits,
PP=0.010; after HM: 87 cases out of 3,779 visits, PP=0.023; p<0.0001). Significant themes from preliminary qualitative results highlight a lack of access to a balanced diet and diabetes medications that occurs during hurricanes in Robeson County, NC, especially for those of low socioeconomic position (SEP).
Introduction
Diabetes mellitus refers to a group of diseases that impacts the way your body uptakes blood glucose [1]. Type 1 and type 2 diabetes are the two most prevalent types of diabetes with type 2 diabetes accounting for more than 85% of the total diabetes prevalence [2]. The increased incidence of obesity has led to an increased manifestation of type 2 diabetes, particularly in children and young adults [2]. The global prevalence of diabetes is expected to increase to 592 million by 2035 from 382 million that was observed in 2013 [2]. According to a 2017 report by the Centers for Disease Control and Prevention, more than 100 million U.S. adults (>40% of US adults) are now living with diabetes or pre-diabetes [3]. From the National Health and Nutrition Examination Survey
(NHANES), Menke, et. al., found recent prevalence in total diabetes, diagnosed diabetes, undiagnosed diabetes, and prediabetes unadjusted prevalence
measurements of 14.3%, 9.1%, 5.2%, and 38.0%, respectively [4]. As a major cause of both morbidity and mortality, diabetes costs in 2012 alone were estimated to be over $245 billion as a result of increased strain on healthcare resources and reduced productivity [4].
Both Type 1 diabetes (T1D) and Type 2 diabetes (T2D) are serious diseases that require extensive self-management including physical activity, diet, and the appropriate use of insulin and other medications to control blood sugar [3]. If proper treatment of diabetes does not take place, a diabetic emergency could take place called diabetic ketoacidosis [5]. It’s possible that the decreasing proportion of the population with undiagnosed diabetes in recent years may be attributable to better screening techniques and better interventions available to those with diagnosed diabetes [4]. Health disparities with patient access to physicians, health system resources, and community supplies have been identified between different racial groups that directly affects diabetes self-management [6]. For type 2 diabetes, it was found that the prevalence
among American Indian, Black, and Hispanic identities were significantly higher than the prevalence for white-identifying young adults [2].
Access to adequate health insurance, specialized care, medications, and
supplies have been identified as key determinants of glycemic control, and food insecurity has been associated with a higher HbA1C [7]. A key finding of the CDC 2017 report noted earlier found that "the Southern and Appalachian areas” of the United States had the highest rates of diagnosed diabetes and of new diabetes cases [3]. A Southern US county that was recently impacted by Hurricane Matthew, Robeson County, NC, has a population of 134,871, a total diabetes prevalence of 15.7%, and a demographic breakdown of 37.6% native, 26.6% white, and 24.0% black [8]. For comparison, a report by the US Census Bureau showed that the Native American or Alaska Native population makes up about 2% of the total US population [9]. From the 2017 County Health
Rankings, Robeson County, NC, has the highest prevalence of adult smoking (26.8%) and homicide (20.9 homicide deaths per 100,000 people) of any county in North Carolina [3]. In addition, Robeson County, NC, has 43 primary care physicians per 100,000 people [3].
Robeson County, NC, a County in Need
is that Robeson County is struggling with higher unemployment rates and struggling school systems [11]. The article also mentions the need for individuals to take advantage of existing programs and services to help with nutrition and health advice, so that the community as a whole will improve their health outcomes [11].
Hurricane Matthew hits Robeson County, NC
Hurricane Matthew made landfall in Robeson County on October 8th, 2016. Robeson County experienced record rainfall and loss of agriculture, livestock, and electricity following the storm [12]. When a natural disaster like a hurricane hits, access to certain resources, such as major medical centers, may be restricted [13]. According to an article published by Race Forward, the native Lumbee Tribe chief, Harvey Godwin, “Hurricane Matthew affected 50,000 of the 55,000 members impacting access to food, water, and other necessities” [14]. As thousands of people were left wondering where their next shower or meal would come from, emergency shelters were set up around the county for those most impacted by the storm [15]. Two years after Hurricane Matthew hit the Robeson County area, a second storm, Hurricane Florence, impacted the still recovering community [16]. Angered citizens of Lumberton, NC, have blamed a local rail company for many of the damages from Hurricane Florence because a poorly placed rail line underneath Interstate-95 [17]. A study conducted by the North Carolina Department of Transportation and North Carolina Emergency Management found that a floodgate (instead of the rail line) built there would reduce damages from a Hurricane Matthew-like storm by more than 80% [17].
Impacts of Climate Change and Hurricane Impacts: Frequency and Strength
and the temperatures at these deep levels are measured as the Ocean Heat Content. The Ocean Heat Content has experienced drastic increases since 1970, and shown some correlation, on multi-year analysis, between the Atlantic sea surface temperature [19]. In a study conducted by NOAA (National Oceanic and Atmospheric Administration) that analyzed sea surface temperatures and hurricane activity over the past century, they found a positive correlation between these two metrics [19]. Hurricanes have a classification system
measured by the Saffir-Simpson scale (larger the category, the worse and more major the storm) that’s used when a new storm is identified [18]. The most severe hurricanes are classified as Category 5; in the last decade, there have been only three recorded (one of which was Hurricane Matthew) [18]. Since every major hurricane over the last century has been given a classification of strength with the Saffir-Simpson scale, it’s possible to measure whether
hurricanes have been getting worse in frequency and strength [18]. In the study conducted by NOAA, evidence is still unclear as there is speculated missing hurricane frequency data from a lack of measurement tools in the first few decades of the study [19]. Global greenhouse warming is expected to intensify and increase the rainfall of hurricanes within the next century [19].
Rural North Carolina and Access to Resources
The definition of what is considered to be a rural area has been debated in recent years, but the North Carolina Rural Center attempts to define “rurality” by labeling counties as either a urban (750 people or more per square mile),
adults aged 25- 44 with some post-secondary education is 53.7 and 64.9 for rural and urban areas, respectively [22].
Food insecurity, suicide rates, and preventable hospitalizations are all higher in rural communities as well [22]. Staggering differences in access to clinical care exist in rural communities, like the number of primary care physicians per 100,000 people in 2013 was measured to be 55.1 compared to 79.3 in urban areas [22]. The percentage of those uninsured under the age of 65 is measured to be 14.5% of the population when compared to 13.4% in urban areas, and those reporting physical inactivity (percentage of those reporting no physical activity in 2012) was 27.8%and 22.3% for rural and urban communities, respectively. Many of these places have fewer places to exercise including gyms or parks [23]. These disparities are resulting in health inequities and worse outcomes for those living in rural areas [21]. About 40% of North Carolinians live in one of the 80 rural counties in North Carolina with a
population density of 250 people per square mile or less, defined by the North Carolina Department of Commerce [23]. There have been 5 rural hospital closures since 2010, according to the UNC Shep’s Center, and when a hospital closes, thousands of jobs are also leaving the surrounding community, further perpetuating disparities [23].
Understanding Impacts of Hurricane Matthew on Robeson County, NC
southeastern parts of the state [24]. According to the National Weather Service, Hurricane Matthew was the most powerful category 1 hurricane of 2016 with winds up to 150 mph [25]. The Lumber (Lumbee) River in downtown Lumberton crested at 24.39 feet on October 9th, the highest in history, causing highways to close down and thousands of people to be displaced from their homes [25]. Water from the Lumber River flooded the Lumberton water treatment plant that shut down the city’s municipal water supply for weeks to come [25]. As a result of Hurricane Matthew, the U.S. Department of Housing and Urban Development has approved a total of $404 million to be used for rebuilding seriously damaged housing, businesses and critical infrastructure in North Carolina [26].
Barriers to Care for Individuals with Diabetes During a Natural Disaster
Children and adults with diabetes are tasked with a daily care regimen that includes blood glucose monitoring, insulin administration, meal planning, and regular screening for diabetes-related complications [3]. A monumental study called the Diabetes Control and Complications Trial of 1993 showed how glycemic control through intense insulin therapy for preventing microvascular and macrovascular complications had significant benefits to prevention of diabetes-related health outcomes [27]. Landmark clinical studies demonstrate the need to control risk factors like hyperglycemia, hyperlipidemia, and
hypertension to prevent or delay the onset of complications related to diabetes [28]. Many barriers to diabetes care have been identified including
socioeconomic position, health insurance and out of pocket costs, physical access to services in rural versus urban settings, transportation, availability of health care personnel, and receipt of preventative care [28]. Lack of access to resources are highlighted as an overarching barrier to care for many individuals with diabetes and natural disasters only worsen this phenomenon [13].
supplies, resulting in inappropriate insulin and analog levels being used [13]. They found that despite resources available on the ADA website regarding what to do in an emergency situation (like living through a hurricane), those in
emergency shelters rarely had access to the internet to reach those documents [13]. Similarly, a study examined the effects from the Kobe Earthquake in Japan, and found that individuals with diabetes often changed their diabetes medication as a result of the natural disaster [29]. The follow-up study 3 to 4 months after the Kobe Earthquake revealed peaking HbA1c levels, likely from lifestyle, diet, and access to medication changes [29]. Research has shown that individuals with diabetes experience significant adverse health effects when faced with natural disasters, including foot ulcers, amputations, and worsened control of HbA1c [30]. These studies that examined the impact of a natural disaster on the health and outcomes of individuals with diabetes found that there was increased glycemic stress as a result of the natural disaster [13, 31].
Role of Emergency Shelters in Self-Management for Individuals with Diabetes
When Hurricane Matthew hit North Carolina, health care providers from hospitals, clinics, and pharmacies joined together to provide a triage, consultation, and medications to patients living in emergency shelters [15]. North Carolina requested and received 20 public health nurses from Tennessee alone all within a 3 hour period of time [24]. Like Hurricane Katrina, the support provided by health care providers in emergency shelters helped offset the amount of 911 emergency calls and local emergency department visits [15]. Limited health literacy of patients in emergency shelters around Robeson County, NC, during the landfall of Hurricane Matthew is noted as a barrier to optimal healthcare [15].
provide no cost medications for patients needing them [15]. When Hurricane Matthew hit North Carolina, Governor Pat McCrory issued a state of emergency, which led to many changes in healthcare policy like expanding pharmacists’ ability to ensure patients receive the care they need by overriding the “refill too soon” prohibition [15].
Although many barriers to care for individuals with diabetes have been identified in many landmark studies, the impact Hurricane Matthew or Hurricane Florence made on self-management practices and outcomes for individuals with diabetes in Robeson County, North Carolina is not fully understood (Assembly, 2016). To address this gap, I collected qualitative data from individuals with diabetes who lived through this storm and Hurricane Florence, and use EHR data collected from the Southeastern Regional Medical Center to see if diabetes
Specific Aims & Hypotheses
Aim 1: To characterize how Hurricane Matthew and Hurricane Florence affected perceived access to reliable food, medications, and supplies as described by individuals with diabetes in Robeson County, NC.
1a: Access to supplies, medication, and reliable food sources for individuals with diabetes will have decreased from before to after Hurricane Matthew.
1b: Individuals with diabetes will have better prepared for Hurricane Florence after experiencing Hurricane Matthew.
Aim 2: To quantify the impact Hurricane Matthew had on diabetes outcomes in Robeson County, NC using a one year time span centered around Hurricane Matthew and cut into two time periods (6 months each) to be compared as two cross sectional panels.
BRIEF METHODS
Setting
Robeson County, NC, has a population of 134,871, a total diabetes prevalence of 15.7%, and a demographic breakdown of 37.6% Native American, 26.6% White, and 24% Black [8]. From the 2017 County Health Rankings, Robeson County, NC, has the highest prevalence of adult smoking (26.8%) and homicide (20.9 homicide deaths per 100,000 people) of any county in North Carolina [3]. According to the North Carolina Rural Center on Health Rankings and Living Wage, Robeson County ranks last out of all counties in North Carolina in terms of health outcomes and falls in the lowest quartile of all counties in terms of weighted average household income [20].
Mixed methods, composed of focus groups, key informant interviews, and electronic health record (EHR) data analysis, were used to understand the impact of Hurricane Matthew diabetes self-management and outcomes shown in
Figure 1. Overview of approach to understand the impact Hurricane Matthew had on individuals with diabetes. Three main approaches (2 qualitative and 1 quantitative) were explored in mixed methods paradigm.
Focus Groups
Focus Group Procedure
Individuals signed up to participate in one of three different focus groups. The groups were conducted separately in different parts of Lumberton, NC, and included individuals with diabetes over the age of 18 from Robeson County that experienced Hurricane Matthew and/or Hurricane Florence. Two religious-based organizations (First Baptist Church off West 2nd Street and the First Baptist Church off Walnut Street) were locations of the focus groups in Lumberton, NC. A third focus group was scheduled at the Southeastern Regional Medical Center, but due to low participation (one individual), their response was not included in focus group data and treated more like a key informant interview.
Hurricane Florence? And, what resources would be helpful in the future for individuals with diabetes during a hurricane in Robeson County, NC?
Questions and discussions centered around perceived impacts of Hurricane Matthew on those with diabetes. To understand how Hurricane Matthew may have impacted the way individuals with diabetes prepared for future hurricanes (i.e. Hurricane Florence), questions relating to preparation for the more recent, Hurricane Florence, was asked. As an attempt to limit recall bias, Hurricane Florence was discussed first (more recent) as to pull as much information from individual’s recent memory as possible, before discussing Hurricane Matthew. In addition, individuals participating were given time between discussing each hurricane to remember back to the correct period of time and decipher their hurricane experiences.
Dr. Cherry Beasley was present for the first focus group and provided diabetes education and advice for participants that had questions about diabetes-specific preparation for a hurricane or other natural disasters. Focus group participants were then compensated with a $25.00 gift card for their time. Focus groups lasted about an hour and a half, and study personnel had no further
communication or follow up with focus group participants.
Recruitment
diabetes, did not live in Robeson County during Hurricane Matthew, were not over the age of 18 at the start of the study, were unable to read and write in the English language, and were involuntarily detained or incarcerated during the study were excluded from participation in the focus groups. If community members with diabetes were interested in participating in the study, they
contacted Kevin Travia via the contact information provided on the flyer passed out at recruitment locations. The selection process was equitable among all relevant demographic groups as the flyers were passed out at public spaces accessible to as many people as possible in the target population.
Consent
The study brochure (flyer) and consent form were verbally reviewed with all focus group participants, and all questions about the study were answered before informed consent was agreed to. Participants also agreed to be audio recorded during the focus groups. Study staff ensured all participants signed the paper consent document before continuing with the study.
Emergency Preparedness Questionnaire
access to healthcare and diabetes medications and supplies, were assessed in relation to Hurricane Matthew and Hurricane Florence.
Analysis
Standard transcription methods were used to transcribe each focus group from their audio files into word documents. Documents were then analyzed using standard qualitative analysis. Focus group transcriptions were broken down into individual statements and main themes were labeled. Each quote falling into main themes were then further labeled into subthemes and compiled into a qualitative table. This table included the theme, subtheme, location of the focus group (North or South Lumberton focus group), and the quote from each
statement. A second study staff member repeated this process for accuracy purposes of theme extraction, and results were compared.
Key Informant Interviews
Key Informant Interview Procedure
interview participants took place, unless they were involved in another aspect of the study.
Recruitment
There were 5 individuals in the community that were selected for participation in the key informant interviews based on the role they played in caring for
individuals with diabetes in the community before, during or after either
Hurricane Matthew or Hurricane Florence. Various healthcare providers from the Southeastern Health System made suggestions around which individuals would be apt to want to interview with the study and provide their experiences during the storms. Dr. Cherry Beasley from the Nursing Department at UNC- Pembroke provided invaluable advice when recruiting individuals for their participation. Individuals were asked to participate if they lived in Robeson County during Hurricane Matthew and were an active healthcare provider for individuals with diabetes or were in a leadership role in the community (i.e. city council members and community center leaders). Only those over the age of 18 at the start of the study were contacted for participation in the key informant interview. No
incentive was provided to those participating in the key informant interviews, and it was made clear at the start of each key informant interview about the
voluntary nature of participating in any or all questions.
Consent
The study brochure (flyer) and consent form were verbally reviewed with all key informant interview participants, and all questions about the study were
answered before informed consent was agreed to. Study staff ensured all participants signed the paper consent document before continuing with the study.
Standard transcription methods of key informant interview audio recordings to a word document took place. Documents were then analyzed using standard qualitative analysis. Themes were found throughout all informant comments and quotes were identified. Key informant interview transcriptions were broken down into individual statements and labeled with one of the main themes. Each theme was then further labeled into subthemes and compiled into a qualitative table. This table included the theme, subtheme, and role that the individual had in the management of those with diabetes. Quotes from the interviews, pertinent to each main theme, were included in the results table and organized based on theme.
Electronic Health Records
Individuals with Type 1 or Type 2 diabetes were included in the data dump from Southeastern Regional Medical Center looking at HbA1C and frequency of DKA-related hospital visits, among other demographic data, from before to after Hurricane Matthew. A one-year time span around Hurricane Matthew, 6 months before through 6 months after, was split into two cross sectional panels (6
months before the storm up until Hurricane Matthew and Hurricane Matthew through 6 months after the storm). To analyze changes in clinical outcomes for those with diabetes, both mean HbA1c and frequency of DKA were compared between these two cross sectional panels. Student t-tests analyzed whether statistically significant changes in prevalent cases of DKA related ER visits and mean HbA1C changes occurred from before to after Hurricane Matthew.
Inclusion Criteria
Only residents of Robeson County that were over the age of 18 were included in the data collection and further statistical analysis. Any person who was pregnant during the time period under review was not included in this study. It was
criteria to include those with diabetes: ICD-10: E08.xx, E09.xx, E10.xx, E11.xx, E13.xx, P70.2, O24.0, O24.1, O24.3, and O24.8. Since many individuals were included with an HbA1c less than 3.5 and the guidelines for what is considered diabetes, according to the American Diabetes Association, is a HbA1c level above 6.5, all participants with an HbA1c less than 6.5 were excluded from this calculation [32].
North Carolina Medical Journal Manuscript
IMPACT OF HURRICANE MATTHEW ON
DIABETES SELF-MANAGEMENT AND
OUTCOMES
Kevin R. Travia, BSPH candidate
undergraduate student, Department of Nutrition, University of North Carolina at Chapel Hill, Chapel Hill, North Carolina
Anna R. Kahkoska, PhD
medical student, Department of Nutrition, University of North Carolina School of Medicine, Chapel Hill, North Carolina
Katherine J. Souris, MPH
clinical research assistant, Department of Nutrition, University of North Carolina at Chapel Hill, Chapel Hill, North Carolina
Cherry Beasley, PhD
distinguished professor of nursing, Department of Nursing, University of North Carolina at Pembroke, Pembroke, North Carolina
Elizabeth J. Mayer-Davis, PhD
distinguished professor of Nutrition and Medicine, chair, Department of Nutrition, University of North Carolina at Chapel Hill, Chapel Hill, North Carolina
Abstract
BACKGROUND
Individuals with diabetes require extensive self-management. Little is known about how Hurricane Matthew (HM) impacted diabetes self-management and outcomes in Robeson County, North Carolina.
METHODS
Mixed methods were used to assess the impact of HM on diabetes outcomes. Individuals with diabetes in Roberson County were recruited for focus groups and administered questionnaires to understand the perceived impact on
diabetes self-management and access to resources. Healthcare providers were recruited for parallel key informant interviews. Mean hemoglobin A1c (HbA1c) and frequency of Diabetic Ketoacidosis (DKA) from the Southeastern Regional Medical Center from 6 months before and after HM were compared using Student t-tests.
RESULTS
Qualitative results highlight a limited access to a balanced diet and medications. No significant differences were found between mean HbA1c values before and after HM (before HM: mean HbA1c 8.34 ± 1.87%; after HM: mean HbA1c 8.31 ± 1.93 %; p=0.366). A demographic breakdown of 34.25% White, 21.70% Black or African American, and 21.38% American Indian or Alaska Native was observed. The period prevalence (PP) of DKA was higher in the 6 months after HM than before (before HM: 39 cases out of 4,025 visits, PP=0.010; after HM: 87 cases out of 3,779 visits, PP=0.023; p<0.0001).
LIMITATIONS
Limitations include non-random sampling and limited sample sizes. Also, cross sectional panel approach didn’t follow the same individuals over time.
Despite significant efforts to curb rising incidence of diabetes cases in the United States, the Centers for Disease Control and Prevention (CDC) has estimated that in 2015 1.5 million new cases of diabetes were diagnosed in US adults over the age of 18 alone [1]. The CDC further reported more than 100 million U.S. adults (>40% of US adults) are now living with diabetes (>30 million) or pre-diabetes (>84 million), a condition if untreated often leads to type 2
diabetes within 5 years. Geographically, the highest incidence of newly
diagnosed diabetes cases can be found in the Southern and Appalachian areas of the United States, particularly in rural communities [1]. Access to nutritious food, health insurance, specialized care, and diabetes medications and supplies have been identified as key determinants of glycemic control for individuals with diabetes [2]. One study examining the impact of Hurricane Katrina on those with diabetes found that access to major medical centers, food, water, and
medications were limited leading to significant effects on diabetes
self-management and outcomes [3]. From the Kobe Earthquake researchers found that those with diabetes had to change their diabetes medication during the disaster [4].
Following Hurricane Matthew, thousands of people were forced to evacuate from their homes as flooding waters decimated many towns all up the Eastern Seaboard of the United States [5]. The storm made significant impact in Robeson County, NC, on October 8th, 2016, where more than 26 people lost their lives and an estimated $4.8 billion worth of damages were sustained [5]. More than 800,000 homes lost power, 635 roads were closed, and 88,000 homes were either damaged or destroyed as a result of the storm [5]. Robeson County, NC, has a population of 134,871, a total diabetes prevalence of 15.7%, and a demographic breakdown of 37.6% Native American, 26.6% White, and 24% Black [6]. According to the North Carolina Rural Center on Health Rankings and Living Wage, Robeson County ranks last out of all counties in North
Although many barriers to care for individuals with diabetes have been identified in many landmark studies, the impact Hurricane Matthew and Hurricane
Florence have made on diabetes self-management practices and outcomes in Robeson County, North Carolina is not fully understood [8]. To address this gap, this study was designed to understand this impact on individuals with diabetes and relevant outcomes.
Methods
Mixed methods, composed of focus groups, key informant interviews, and electronic health record (EHR) data analysis, were used to understand the impact of Hurricane Matthew diabetes self-management and outcomes shown in
Figure 1.
Focus Groups
Focus Group Procedure
Recruitment took place from several locations (Southeastern Regional Medical Center, Southeastern Health Diabetes Clinic, Robeson County Church and Community Center, First Baptist Church off Walnut Street, and First Baptist Church off West 2nd Street) all around Lumberton, NC. Recruitment flyers for
participants were left in all lobby areas, and local representatives at faith-based organizations and community centers were asked to mention the study during their services with a recruitment script. Individuals that did not have diabetes, did not live in Robeson County during Hurricane Matthew, were not over the age of 18 at the start of the study, were unable to read and write in the English
Participants that arrived at the focus group locations (First Baptist Church on Walnut Street or First Baptist Church on W 2nd Street) signed the consent form and completed the Emergency Preparedness Questionnaire (EPQ), a
questionnaire aimed at understanding the individual level preparedness for Hurricane Matthew, including an assessment of barriers to care. This was measured with a Likert scale and values were given a numerical value. The questionnaire also was designed to see if experiencing Hurricane Matthew (2016) influenced preparation for Hurricane Florence (2018), as well as collect relevant demographic information. Focus groups were then audio recorded and a semi-structured focus group guide was utilized for each focus group session to understand the impacts of both Hurricane Matthew and Hurricane Florence on perceived access to food, medications, and supplies.
Analysis
Standard transcription methods were used to transcribe each focus group from their audio files into word documents. Documents were then analyzed using standard qualitative analysis. Focus group transcriptions were broken down into individual statements and major themes were. Each quote falling into main themes were then further labeled into subthemes and compiled into a qualitative table. A second study staff member repeated this process for accuracy
purposes, and results were compared.
Key Informant Interviews
Key Informant Interview Procedure
Key informant interviews took place with the goal of understanding the healthcare provider and community leader perspective around perceived impacts on those with diabetes during Hurricane Matthew and Florence.
Questions asked about specific experiences with health-related barriers for individuals with diabetes during both Hurricane Matthew and Hurricane Florence.
Individuals were asked to participate if they lived in Robeson County during Hurricane Matthew and were an active healthcare provider for individuals with diabetes or were in a leadership role in the community. Members of the
Southeastern Health system made recommendations about whom to contact for participation in an interview. Only those over the age of 18 at the start of the study were contacted for participation in the key informant interviews.
Analysis
Interview sessions were reviewed for common themes. Themes were extracted using standard qualitative analysis techniques, and subthemes were then
identified from theme-labeled quotes before compilation into a qualitative table.
Electronic Health Records
A one-year time span around Hurricane Matthew, 6 months before through 6 months after, was split into two cross sectional panels (6 months before the storm up until Hurricane Matthew and Hurricane Matthew through 6 months after the storm). Only residents of Robeson County that were over the age of 18, who were not pregnant when measured, were included in the data collection and further statistical analysis. The guidelines for what is considered diabetes, according to the American Diabetes Association, is an HbA1c level above 6.5, so all participants with an HbA1c less than 6.5 were excluded from the
comparisons [9].
To analyze changes in clinical outcomes for those with diabetes, both mean HbA1c and frequency of diabetic ketoacidosis (DKA) were compared between the two cross sectional panels. Student t-tests analyzed whether statistically significant changes in prevalent cases of DKA related ER visits and mean HbA1C changes occurred from before to after Hurricane Matthew.
Results
Focus Groups
The first focus group took place at the First Baptist Church off of West 2nd Street in Lumberton, NC. The second focus group was intended to take place at the Southeastern Regional Medical Center. This focus group had 5 participants scheduled to participate in the focus group, but only one individual was able to attend this group due to transportation-related barriers. Their responses were treated as a key informant interview. The third focus group took place at the First Baptist Church off Walnut Street.
There were observable differences in self-reported racial demographics
between the first (North Lumberton) and third (South Lumberton) focus groups. The first group had primarily Black or African American identifying individuals and the third group had primarily white identifying individuals. Further data analysis shed light on differences in emergency kit preparedness for Hurricane Matthew and Hurricane Florence. No significant differences were found between Hurricane Matthew and Hurricane Florence for barriers to resources.
those in the lower lying areas and near the Lumber River, often those in lower socioeconomic position (SEP), fared the worst from the impacts of the
hurricane. The qualitative data represented in Table 1 and Table 2 highlights a lack of access to diabetes-friendly food, medications, and supplies for
individuals with diabetes during both Hurricane Matthew and Hurricane Florence.
Key Informant Interviews
There were 3 registered nurses (across the Southeastern Health system), one professor from UNC- Pembroke, and one community leader that were
interviewed. One of the registered nurses stated that they themselves has diabetes and that gave them an even deeper appreciation for barriers to resources needed for those with diabetes during both Hurricane Matthew and Hurricane Florence.
Health Records Data
From EHR analysis from the Southeastern Regional Medical Center,
demographic characteristics from the two cross sectional panels are shown in
Table 3.
The two cross sectional panel analysis shown in Table 4 depicts changes in mean HbA1c from before hurricane Matthew to after, and it shows the change in frequency of diabetic ketoacidosis (DKA). Only those with an HbA1c
measurement above 6.5 (per the American Diabetes Association guidelines for what is defined as someone having diabetes) were included in the comparison [9]. Confounding variables were considered; however, age, race, and sex distributions from before to after Hurricane Matthew were very similar, and thus were ignored from calculations.
Stress and the role PTSD in the impacts on Hurricane Florence Preparation
Many different key informants brought up the idea that the hormonal response within the body of an individual that experiences a traumatic experience may develop long-term physiological problems. Furthermore, it’s been hypothesized that the reason for panicking prior to Hurricane Florence was in part because of the experiences with Hurricane Matthew. Another study looking into the effects of stressors on low socioeconomic position individuals that experienced
Hurricane Katrina found that increased hurricane-related stressors and loss led to worse health outcomes [11]. Further studies would have to be conducted in North Carolina before any conclusions could be drawn with Hurricane Matthew in Robeson County, but something worth considering for future studies. If this is the case that Hurricane Matthew-related stressors led to worse health
outcomes, more services, especially mental health services, should be provided to those individuals that were exposed to Hurricane Matthew.
Differences in Impacts between Hurricane Matthew and Hurricane Florence
Many registered nurses noted that although the damaging results from Matthew were often worse than Hurricane Florence, the amount of resources and
supplies available to take care of those individuals was much larger than for Hurricane Florence.In part, informants argue that as a result of the experiences from Hurricane Matthew, people were better able to prepare for Hurricane Florence and plan ahead of time with resources like water and medications. In addition, community members came together with the National Guard to better protect the water treatment center in downtown Lumberton, NC, from flooding, like what happened with Hurricane Matthew.
Is the American Red Cross Helpful or Antagonistic?
the organization as “largely ineffective.” It was further described that many rules and regulations around the shelters that they set up seem to be the cause of this frustration. As an example, one key informant detailed the struggle that many parents in emergency shelters had with the supply of diapers during the storm. Community members heard about these hardships and planned to bring large shipments of diapers to these shelters to those in need, only to be faced with rejection from American Red Cross employees because of company policy. Another informant detailed a similar situation, but with food, saying that those with diabetes had to get a special pass to have a sugary drink at their bed. It was described that this led to tensions between the American Red Cross workers and community members. The tension also caused the creation of smuggling routes to bring supplies in Red Cross emergency shelters for those that needed the supplies, a paradoxical picture to imagine.
Accessibility
Participants in focus groups had difficulty accessing the hospital due to
transportation related barriers. It was described that individuals wanted to take part in the study and describe their experiences, but they could not physically get a ride to the hospital. Questions started to be raised about how an individual with diabetes would get to the hospital during a hurricane when they couldn’t get to the hospital when there was not a hurricane present.
Future Interventions to limit health outcomes
Among multiple providers and leaders in the community, it has been noted that diabetes education, catered specifically for those with diabetes and what to pack in preparation for the storm, would be incredibly helpful. The possibility of
suggestion has been noted to make a list that can be easily and widely
distributed to individuals with diabetes that has a list of all necessary supplies in an emergency supply kit that is catered to their needs. This gets at the idea of precision medicine and the importance of catering interventions and education to the individual patient.
Limitations
Individuals with diabetes during the focus group often had difficulty
distinguishing the difference between experiences with Hurricane Matthew and Hurricane Florence leading to possible recall bias. Although time was given between discussions of the hurricanes for participants to orient themselves around when each storm hit the area and experiences they had with each, some participants exclaimed this frustration of differentiation. Furthermore, focus groups lacked racial diversity (compared with racial diversity seen in EHR analysis and other literature sources) and one focus group even had only members of the same immediate family.
The key informant interview data collect relies on the opinions and experiences of a select and limited number of leaders identified as representing the
Despite focus groups and key informants reaching saturation, defined as no additional data are being found on a specific topic so that characteristics of a certain variable can be described, generalization to all groups in the population would not be appropriate, as some groups were not well represented at focus groups or reached with key informant interviews [12].
The cross-sectional panels approach to understanding clinical characteristics of those with diabetes after Hurricane Matthew has limitations because the same individuals were not followed over time. Secondly, HbA1c measurements could have been taken right after Hurricane Matthew (within a few weeks after) and fall into the after cross-section, but not represent the impact of the storm since most of the 3 month average is being impacted by the glycemic stress before the hurricane.
Conclusions
Robeson County is a poor county with many individuals facing barriers when accessing proper healthcare without a hurricane present, let alone when a Category 5 hurricane forces thousands to evacuate. The perceived access to diabetes-specific food, medications, and supplies were limited for individuals with diabetes during both Hurricane Matthew and Hurricane Florence. Emergency shelters currently do not appear to provide adequate
providers in emergency shelters to know which medication and how much of it to give.
From focus group discussions and key informant experiences, Hurricane
Matthew made long-term impacts on those with diabetes and influenced the way they prepared for Hurricane Florence. There were not statistically significant results from the barriers to care assessment that were observed in the Emergency Preparedness Questionnaire.
From EHR data analysis from the Southeastern Regional Medical Center, mean HbA1c did not significantly change from the 6 month prior to Hurricane Matthew cross-sectional panel when compared with the 6 month after Hurricane Matthew cross-sectional panel. However, the frequency of DKA did significantly increase from before Hurricane Matthew to after when comparing their respective cross sectional panels. Because HbA1c is a three month average, it makes sense that Hurricane Matthew may not have significantly changed an individuals HbA1c value depending on when measurements were taken. On the other hand, DKA is a diabetic emergency that can occur more rapidly with poorly managed blood glucose levels. Policy change has been identified as a useful way to increase access to the tools and resources that individuals with diabetes need to adequately manage their diabetes. Policy change should focus on increasing access to food, medications, and supplies for those with diabetes in emergency shelters.
Acknowledgements
This project was supported by the Honors Undergraduate Research Fund administered by Honors Carolina.
References
1. Prevention, C.f.D.C.a., National Diabetes Statistical Report. 2017.
2. Berkowitz, S.A., et al., Food Insecurity, Food “Deserts,” and Glycemic Control in Patients With Diabetes: A Longitudinal Analysis. Diabetes Care, 2018.
3. Cefalu, W.T., et al., The Hurricane Katrina aftermath and its impact on diabetes care: observations from "ground zero": lessons in disaster
preparedness of people with diabetes. Diabetes Care, 2006. 29(1): p. 158-60. 4. Inui, A., et al., Effect of the Kobe earthquake on stress and glycemic control in
patients with diabetes mellitus. Arch Intern Med, 1998. 158(3): p. 274-8. 5. Assembly, N.G., North Carolina Resilient Redevelopment Planning 2016. 6. Services, N.C.H.a.H., NC Vital Statistics and Reports. North Carolina State
Center for Health Statistics, 2017. 2.
7. Center, N.R., Health Rankings & Living Wage. 2016.
8. Zgibor, J.C., External Barriers to Diabetes Care: Addressing Personal and Health Systems Issues. American Diabetes Association, 2001.
9. Matthew C. Riddle, G.B., Lawrence Blonde, Andrew J. M. Boulton, David D’Alessio, Eddie L. Greene, Korey K. Hood, Frank B. Hu, Steven E. Kahn, Sanjay Kaul, Derek LeRoith, Robert G. Moses, Stephen Rich, Julio Rosenstock, Judith Wylie-Rossett, American Diabetes Association: Standards of Medical Care. The Journal of Clinical and Applied Research and Education, 2019. 42: p. 204.
10. Health, N.I.o., Calculate Your Body Mass Index. Health Information for the Public. Healthy Weight Tools(BMI Calculator).
11. Jean Rhodes, C.C., Christina Paxson, Cecillia Elena Rouse, Mary Waters, Elizabeth Fussel, The Impact of Hurricane Katrina on the Mental and Physical Health of Low-Income Parents in New Orleans. 2012.
Tables for NCMJ Submission
Table 1. Theme extractions from 2 focus groups of individuals with diabetes; one group from South Lumberton (n=20) and one group from North Lumberton (n=5).
Theme Sub-theme Text
Food Power “My power went out for about 7 days, so we ended up cooking everything we had in the freezer, but some of the churches had hot meals…”
“We couldn’t cook a lot of things without power. They weren’t in the shelters during Florence” Diabetes
Management
“Accessing a balanced diet was hard. We didn’t have access to food. Our stores were shut down.” “And with diabetes, the kind of food you have to eat- it’s hard to get it”
“Everybody had to change [their diet]. You ate all your reserves, ate out of a can, and when you went to the store, everything was gone or very expensive.”
Emergency Shelters
“The Red Cross- they don’t care about us. The food doesn’t benefit us.”
Community “There were [many] going through this and they worked together… to get food and we all went together.”
Flooding “But each time we had to evacuate, we had to go and stay with one of our children and they were fast food eaters.”
Medications Emergency Shelters
“CVS came down [to the shelter] to fill the prescriptions. One [time] in eight days.”
“As far as it goes for my doctor, I can just reach out. Like I can just use my phone to email my pharmacist to get it sent in, but if I’m at the shelter without my phone, somebody needs to be able to go and get it…”
Community “I guess you could get your medicine before, like if you see it on the radio, TV, or news, you can go and get everything you need.”
“If the pharmacy or drug store was closed, you couldn’t get [your medications]. Many of them were robbed to get the medicines.”
Flooding “Those shelters need to be able to have the medications for you. In case the storm hit [and] you didn’t pack your insulin, they need to be able to have that insulin for you.”
“I was out of my medication and [The closest supplier] was 170 miles away.” Diabetes
Supplies and Community Resources
Power “If you didn’t have a cell phone, when the power went out, there was no way to get in contact with the doctor.”
Diabetes Management
“There were a lot of changes you have to go through [when evacuating]. And we couldn’t carry it all with us because carrying all that I have to medically… the old oxygen thing with us was a big inconvenience.”
I think it was harder for everyone. It was something new to us. When Florence came along, at least we had some idea of what to do. But when Matthew came, we were in the dark about everything.” “[Diabetes education] would’ve helped during this time.”
“…it didn’t take but three days, but I was out of my test strips [then].” Emergency
Shelters “Yeah just having someone to check your blood pressure and blood sugar [at the emergency shelters] is needed. Like if you get sick, who does that?” Community “During Hurricane Matthew, they seemed more readily available for us to fill out the FEMA
application. My situation is a little different… I’m still out of my home.” “Gas prices went sky high. Prices everywhere.”
“Yeah, you can see the difference [in FEMA funding] because if you drive down to the Tanglewood area (North Lumberton), you can see all the sides being torn out and being repaired, but down this way (South Lumberton), nothing.”
people away from the other parts of town saying, ‘sorry, your area wasn’t affected.’”
Flooding “No transportation to [the doctor’s office]. Roads were closed and you couldn’t get to it… they weren’t open anyways.”
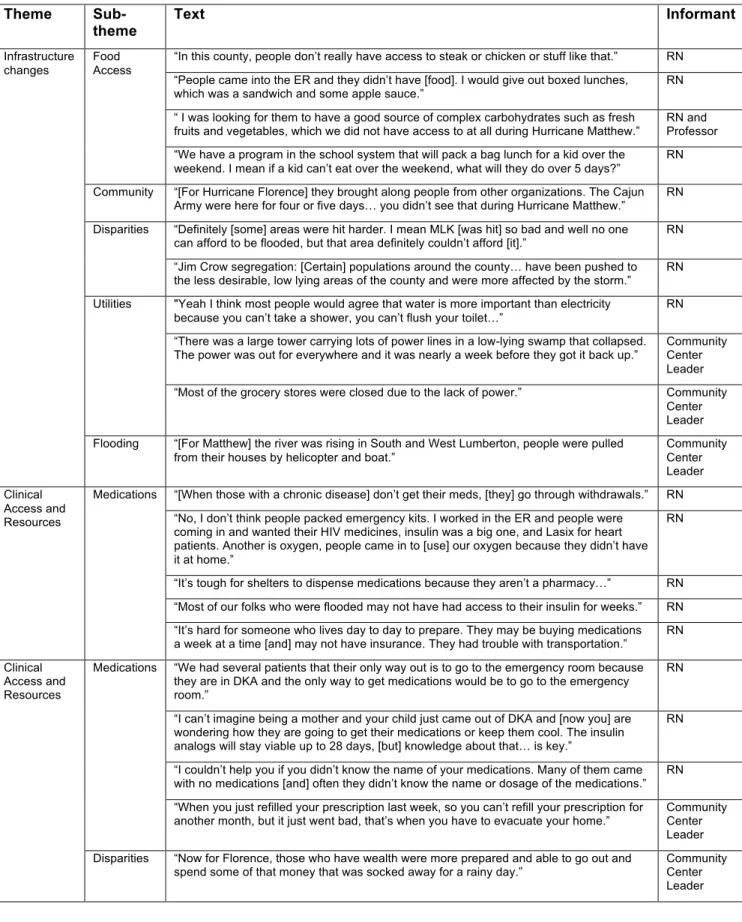
Table 2. Theme extractions from 5 key informant interviews of leaders in the community; Individuals are representing their experiences caring for individuals with diabetes during either Hurricane Matthew or Hurricane Florence (n=5).
Theme Sub-theme
Text Informant
Infrastructure changes
Food Access
“In this county, people don’t really have access to steak or chicken or stuff like that.” RN “People came into the ER and they didn’t have [food]. I would give out boxed lunches,
which was a sandwich and some apple sauce.”
RN “ I was looking for them to have a good source of complex carbohydrates such as fresh
fruits and vegetables, which we did not have access to at all during Hurricane Matthew.” RN and Professor “We have a program in the school system that will pack a bag lunch for a kid over the
weekend. I mean if a kid can’t eat over the weekend, what will they do over 5 days?”
RN Community “[For Hurricane Florence] they brought along people from other organizations. The Cajun
Army were here for four or five days… you didn’t see that during Hurricane Matthew.”
RN Disparities “Definitely [some] areas were hit harder. I mean MLK [was hit] so bad and well no one
can afford to be flooded, but that area definitely couldn’t afford [it].” RN “Jim Crow segregation: [Certain] populations around the county… have been pushed to the less desirable, low lying areas of the county and were more affected by the storm.”
RN Utilities "Yeah I think most people would agree that water is more important than electricity
because you can’t take a shower, you can’t flush your toilet…”
RN “There was a large tower carrying lots of power lines in a low-lying swamp that collapsed.
The power was out for everywhere and it was nearly a week before they got it back up.” Community Center Leader “Most of the grocery stores were closed due to the lack of power.” Community
Center Leader Flooding “[For Matthew] the river was rising in South and West Lumberton, people were pulled
from their houses by helicopter and boat.”
Community Center Leader Clinical Access and Resources
Medications “[When those with a chronic disease] don’t get their meds, [they] go through withdrawals.” RN “No, I don’t think people packed emergency kits. I worked in the ER and people were
coming in and wanted their HIV medicines, insulin was a big one, and Lasix for heart patients. Another is oxygen, people came in to [use] our oxygen because they didn’t have it at home.”
RN
“It’s tough for shelters to dispense medications because they aren’t a pharmacy…” RN “Most of our folks who were flooded may not have had access to their insulin for weeks.” RN “It’s hard for someone who lives day to day to prepare. They may be buying medications a week at a time [and] may not have insurance. They had trouble with transportation.” RN Clinical
Access and Resources
Medications “We had several patients that their only way out is to go to the emergency room because they are in DKA and the only way to get medications would be to go to the emergency room.”
RN
“I can’t imagine being a mother and your child just came out of DKA and [now you] are wondering how they are going to get their medications or keep them cool. The insulin analogs will stay viable up to 28 days, [but] knowledge about that… is key.”
RN
“I couldn’t help you if you didn’t know the name of your medications. Many of them came with no medications [and] often they didn’t know the name or dosage of the medications.”
RN “When you just refilled your prescription last week, so you can’t refill your prescription for
another month, but it just went bad, that’s when you have to evacuate your home.” Community Center Leader Disparities “Now for Florence, those who have wealth were more prepared and able to go out and
spend some of that money that was socked away for a rainy day.”
Table 3. Demographic clinical data from Southeastern Regional Medical Center EHR data.
6 months BEFORE Hurricane Matthew (n=3,057)
6 months AFTER Hurricane Matthew (n=2,940)
Mean Age (years)
64 64
Sex
Male 1,342 (43.9%) 1,288 (42.0%)
Female 1,715 (56.1%) 1,651 (57.8%)
Race
White 1,060 (34.7%) 971 (34.3%)
Black or African American 703 (23.0%) 716 (21.7%) American Indian or Alaska Native 579 (18.9%) 608 (21.4%)
Asian 116 (3.8%) 110 (3.2%)
Native Hawaiian or Other Pacific Islander
1 (<1%) 1 (<1%)
Hispanic 3 (<1%) 4 (<1%)
Other 595 (19.5%) 530 (19.1%)
“Folks who had 400% below federal poverty guideline were the ones that got it so bad [with Matthew]. The folks tended to be uninsured, so they don’t necessarily have access to medications all the time, not just during a natural disaster.”
RN
“Medical care was hindered for the entire population, [but] more critical for those with symptoms related to kidney and renal diseases because healthcare was non-existent during Hurricane Matthew. The hospital wasn’t open. For Florence, most clinics were closed.” RN and Professor Clinical Access and Resources Food
Access “Patients were on a specific dietary regimen and doing well, and then boom, they would eat whatever they could eat and then complain about their high [blood sugar] numbers.” Food access RN
RN
Emergency Shelters
Medications “[Shelters provided] food, water, and things like that, but medications and supplies… no.” RN Community “Matthew, we staffed shelters. Florence was not as bad, structurally, for many of the
clinics.”
RN “Shelters were set up [in precaution], and staff thought they would only need them for
very few days. We did not think Hurricane Matthew [would] actually impact our area much.”
RN and Professor “The purpose of the shelters isn’t to provide medical services. The way they’re putting
[them] up, according to the law, they’re doing a good job. I think the law is inadequate.”
RN and Professor “I strongly disagree [that emergency shelters provided adequate resources]. I think [the
emergency shelters] did a terrible job. In my opinion they did not provide adequate resources.”
RN and Professor Flooding “Matthew affected more people and put more people out of their homes and into
shelters.”
RN Food
Access
“[Shelters] tend to have one simple menu that does not address the needs of the diabetic. I think we need to stop and have a different type of program for those populations.”
Table 4. HbA1c and frequency of DKA from Electronic Health Record (EHR) data from the Southeastern Regional Medical Center pulled from before and after Hurricane Matthew.
Time Period Mean HbA1c (SD)* Frequency of DKA (%)
Within 6 months before the storm (n=3,057)
8.34 (1.87) 39 cases out of 4,025 admissions (1.0%)
Within 6 months after the storm (n= 2,940)
8.31 (1.93) 87 cases out of 3,779 admissions (2.3%)
Independent T-test (p-value)
0.54 < 0.0001
* If an individual had more than HbA1c measure, the data point that was further away, based on date, from the storm landfall in North Carolina (October 8th, 2016) was chosen.
** Significant p value calculated
Figure notes: Figure 1 is attached to submission. Please include following figure description:
Concluding Thoughts
Individuals with diabetes in Robeson County, NC, experienced a lack of access to vital resources, including food, water, medications, and supplies, during Hurricane Matthew and Hurricane Florence. The irony of the situation how focus groups were scheduled weeks in advance to discuss the impacts of Hurricane Matthew in the fall of 2018 and they had to be rescheduled because Hurricane Florence hit the same area during those days emphasizes the desperate need for a change in infrastructure, policy, and access to these vital resources for this population. From focus groups, access to these diabetes resources are reduced directly by infrastructure (road and clinical closures) as well as utility changes (power and water shortages). Key informant interviews shed light on some disparities that are perpetuated by the presence of a hurricane. Individuals describe the fact that those who have been historically pushed to the lower (topographically), less desirable parts of town and are impacted by more floods. Secondly, key informants identify the problem that many individuals with
diabetes that struggle with access to diabetes food, medications, and supplies without a hurricane present go through an even more challenging process attempting to obtain these resources during a natural disaster. Electronic Health Record analysis from the Southeastern Regional Medical Center shows that long-term blood glucose measurements (over a 3 month average) did not
significantly change as a result of Hurricane Matthew. The frequency of diabetes emergencies, on the other hand, did significantly increase after the storm,
shedding light on the idea that Hurricane Matthew impacted individual’s abilities to effectively manage their diabetes in the short term (day to day). More
research should investigate how these clinical outcomes changed from before to after Hurricane Florence. In addition, work on the societal level should be
For the second focus group that was held, only one individual was able to attend and participate in the group discussion. Despite significant efforts made to bring interested individuals with diabetes to the hospital where the focus group was being held (using Uber or Lyft as resources to get them there), no success was found. Uber and Lyft drivers in the area could not be located and it was around 5 PM on a Thursday. It is interesting to think about how these individuals would get to the hospital if they had an emergency when they weren’t able to get there for the focus group. Furthermore, during a natural disaster like Hurricane
Matthew, the problems with travel-related barriers are compounded for these individuals by the flooding waters that made travel near impossible.
It is important to note that some of the focus group responses differed based on the experiences of those living North of the Lumber River compared to those South of the Lumber River. Most notably, focus group participants from the North Lumberton group discussed more impacts to their area in terms of flooding and lack of access to resources from Hurricane Florence compared with Hurricane Matthew. This was the opposite for participants from the South Lumberton group. In order to address these differences in impacts, further studies should hold focus groups that solely discuss one hurricane at a time closer to the time of the storm.
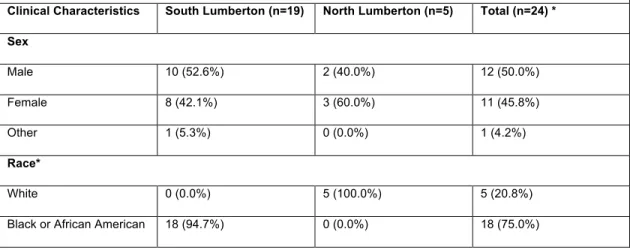
Table 5. Focus Group demographic data self-reported from the Emergency Preparedness Questionnaire (EPQ) stratified with location of focus group.
Clinical Characteristics South Lumberton (n=19) North Lumberton (n=5) Total (n=24) * Sex
Male 10 (52.6%) 2 (40.0%) 12 (50.0%)
Female 8 (42.1%) 3 (60.0%) 11 (45.8%)
Other 1 (5.3%) 0 (0.0%) 1 (4.2%)
Race*
White 0 (0.0%) 5 (100.0%) 5 (20.8%)
American Indian or Alaska Native
2 (10.5%) 0 (0.0%) 2 (8.3%)
* Individuals could identify with more than one race.
This will also help with the problem of recall bias in distinguishing what events happened with which hurricane for focus group participants in this study. To further assist with recall bias, focus group data should be collected within a reasonable amount of time after the storm has passed and recent enough (more recent than 2 years after) that memories are as clear as possible. Next, more focus groups held around different parts of town will allow for more demographic groups to be included in the qualitative data, adding to the generalizability of the study. Clinical data self-reported by focus group participants from the
Emergency Preparedness Questionnaire is shown in the table below.
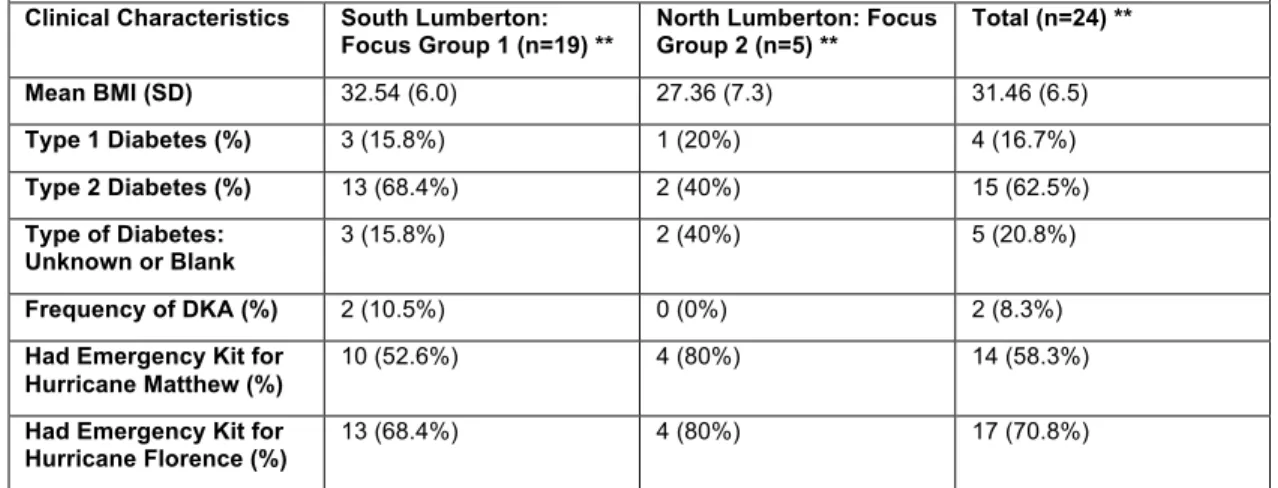
Table 6. Focus Group clinical data self-reported from the EPQ stratified with location of focus group. *
Clinical Characteristics South Lumberton: Focus Group 1 (n=19) **
North Lumberton: Focus Group 2 (n=5) **
Total (n=24) ** Mean BMI (SD) 32.54 (6.0) 27.36 (7.3) 31.46 (6.5)
Type 1 Diabetes (%) 3 (15.8%) 1 (20%) 4 (16.7%)
Type 2 Diabetes (%) 13 (68.4%) 2 (40%) 15 (62.5%)
Type of Diabetes: Unknown or Blank
3 (15.8%) 2 (40%) 5 (20.8%)
Frequency of DKA (%) 2 (10.5%) 0 (0%) 2 (8.3%)
Had Emergency Kit for Hurricane Matthew (%)
10 (52.6%) 4 (80%) 14 (58.3%)
Had Emergency Kit for Hurricane Florence (%)
13 (68.4%) 4 (80%) 17 (70.8%) * Location of Lumberton is relative to the Lumber River that cuts the city of Lumberton in two parts ** n varies slightly due to occasional missing data
resources or impacts of the hurricanes were observed from this data, but further measurements and studies exploring how Hurricane Matthew may have
impacted preparedness for Hurricane Florence should be explored.
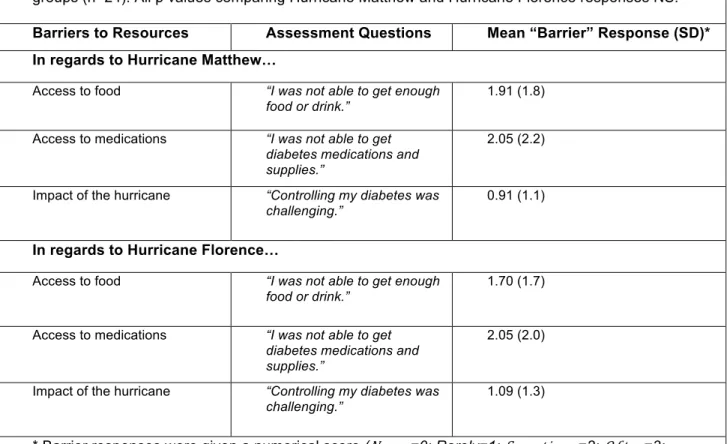
Table 7. Barriers to care from the Emergency Preparedness Questionnaire (EPQ) for both focus groups (n=24). All p values comparing Hurricane Matthew and Hurricane Florence responses NS.
Barriers to Resources Assessment Questions Mean “Barrier” Response (SD)* In regards to Hurricane Matthew…
Access to food “I was not able to get enough food or drink.”
1.91 (1.8)
Access to medications “I was not able to get diabetes medications and supplies.”
2.05 (2.2)
Impact of the hurricane “Controlling my diabetes was challenging.”
0.91 (1.1)
In regards to Hurricane Florence…
Access to food “I was not able to get enough food or drink.”
1.70 (1.7)
Access to medications “I was not able to get diabetes medications and supplies.”
2.05 (2.0)
Impact of the hurricane “Controlling my diabetes was challenging.”
1.09 (1.3)
* Barrier responses were given a numerical score (𝑁𝑒𝑣𝑒𝑟=0; Rarely=1; 𝑆𝑜𝑚𝑒𝑡𝑖𝑚𝑒𝑠=2; 𝑂𝑓𝑡𝑒𝑛=3; 𝑈𝑠𝑢𝑎𝑙𝑙𝑦=4; 𝐴𝑙𝑤𝑎𝑦𝑠=5).
Many focus group participants brought up disparities in access to FEMA funding from those that lived in south of or near the Lumber River compared with those that lived farther north of the river in higher elevations. In order to further
Key informants that were targeted for an interview in this study were individuals identified by a select group of healthcare providers. More community members, school workers, public servants, hospital employees, physicians, and religious leaders should be asked about their experiences with hurricanes in Robeson County, NC, and their experiences on how those with diabetes were impacted by the storms. This would provide a better understanding regarding the impacts of a hurricane on all members of the population, not just those that were
connected to the Southeastern Health system or the local community center.
Electronic health data analysis around Hurricane Matthew would be improved if data could be correctly filtered with ICD-10 codes, such that only those with diabetes are included in the study parameters. In addition, a further study
utilizing a longitudinal format regarding tracking the same individuals before and after Hurricane Matthew would provide results with fewer limitations around sample size and unknown participant changes from the first cross sectional panel to the second observed in this study.
Robeson County, NC, is a rural county that struggles with access to resources without a hurricane present; when a category 5 hurricane wipes out roads and businesses, those that can’t access resources normally won’t have any chance at getting the food, water, medications, and supplies they need. This community also has many individuals with uncontrolled diabetes. From a 2006 study, the US and England have mean HbA1c values of 7.5% and 7.6%, respectively [33]. Comparing those values to the mean HbA1c values measured in this study before and after Hurricane Matthew to be 8.34 and 8.31, respectively. This shows a lack of glycemic control in Robeson County, and compounds the problems that are seen when an individual with diabetes tries to manage their diabetes when a major disaster hits.
be. Many individuals described instances where outside donations like baby diapers were brought for use by those living in emergency shelters only to be turned away by American Red Cross employees. It was explained that this is as a result of company policy. It would be interesting for future studies to examine more about this by hearing from the American Red Cross, and specifically ask questions about why this policy is in place. Other resources like FEMA also drew interesting comments regarding disparities in who has access to funds. It was described that some would go and seek financial support from FEMA with major home damages from the storm, and due to the geographic location of their home, they were denied funding. It was further explained that certain areas of Lumberton were defined as being the areas that were most impacted by the storm, and others were not. Focus group participants exclaimed that a hurricane does not follow strict lines drawn on a map, and thus, they wanted more
equitable FEMA support. Future studies should investigate more about FEMA and what qualifies someone to receive this funding during a natural disaster in Robeson County versus one who would not.
Further studies should investigate the impacts of having diabetes-friendly food, medications and supplies in emergency shelters for those with diabetes. This would involve providing these resources to the emergency shelters, if they allow them, and see if there are significant improvements in perceived access to resources and diabetes outcomes for this population. Other interventions like having more diabetes educators and healthcare providers available to those that evacuate to an emergency shelter should be tested for efficacy of preventing worsening diabetes outcomes. These educators could provide helpful tips to those that are waiting in the emergency shelters. A more comprehensive understanding around knowledge of what to pack in an emergency kit should also be explored. This type of study should see if individuals with diabetes in Robeson County, NC, know what kinds or the amounts of supplies and
that can be mass distributed for individuals with diabetes living in Robeson County that is targeted towards their population (literacy level, relevant resources, and ways to seek help).
The incredible support and community in Lumberton, NC, made this research project possible. It became apparent early on that despite this area going through a rough turn of events (one of the hardest hit counties by Hurricane Matthew only to get flooded by Hurricane Florence two years later), those that live in Lumberton, NC, those in Robeson County, especially those with diabetes, continually trust and lean on those around them to get through the highs and the lows of a natural disaster. This was evident in the incredible support from