International Journal of Research in Engineering & Applied Sciences
http://www.euroasiapub.org 1
COMPUTATIONAL FLOW ANALYSIS OF CARBURETOR VENTURI
EFFECTING ON OBSTACLES
G.Sivarayudu *
Dr. B.Jayachandraiah **
ABSTRACT
A computational fluid dynamics (CFD) is used to develop a three dimensional, fully turbulent
model of the compressible flow across a complex-geometry venturi, such as those typically found
in small engine carburetors. An attempt is made in this paper to carry- out three dimensional
CFD analysis of effecting on carburetor venturi with obstacles and fuel tube to draw various
types’ contours of the static pressure, velocity, total pressure and turbulent kinetic energy. First
is to model the carburetor venture using CFD tool and meshed by volume mesh with 84, 605
Tetrahedron elements. Then the CFD analysis is carried–out and presented results, is observed
result drawn for various types of static pressure, velocity, total pressure and turbulent kinetic
energy is effecting the fuel tube and venturi without obstacles and effecting on modified
obstacles, It is observed that the obstacles located at converging nozzle of the venturi do not
cause significant pressure losses, while those obstacles wakes on the flow. Significantly, once the
mass flow rate is corrected using an overall discharge coefficient, the knowledge of the actual
Cross-sectional area at the venturi throat is enough to calculate the static pressure and
Stagnation Pressure(total pressure) at the tip of the fuel tube. The evaluated results are validated
with mathematical model, its good agreement.
Keywords: CFD, carburetor, venturi
International Journal of Research in Engineering & Applied Sciences
http://www.euroasiapub.org 2
INTRODUCTION
Carburetor: The carburetor is a device that mixes fuel into the incoming air. The airflow into the carburetor is controlled by a butterfly valve, and the fuel is added to the mixture through venturi. In a carburetor equipped engine. The air comes in to the space for air filter. Air passes through the air filter and then into the carburetor where the fuel is blended with it. Through the intake manifold, it passes. And then it is drawn into the cylinders
Large volumes of small engines (two wheelers) are being sold in India every year. Its emissions comprise a significant percentage of total pollutants in India. As demonstrated by the automotive industry, significant reductions in emissions are technologically possible, particularly with the use of electronic fuel injection. However, due primarily to cost constraints, small engine manufacturers rely on small, inexpensive Carburetors to generate the fuel mixture for their engines. Thus, a better understanding of carburetor performance and modeling could lead to better fuel mixture control and lower emission
From small engines
Fig 1: Details of carburetor parts inside the venturi
A real carburetor venturi has details in its geometry that create disturbances in the flow and may cause pressure losses that cause deviations from an ideal isentropic flow. These carburetor parts are the choke plate, throttle plate, fuel tube, side passages to secondary systems, and, sometimes, an additional concentric fuel tube in the venturi throat. Some details of typical carburetors used in small engines are shown in above figure1.
LITERATURE REVIEW
International Journal of Research in Engineering & Applied Sciences
http://www.euroasiapub.org 3
of the flow in complex venturis. Several studies have addressed the modeling of fuel flow in carburetors: Experimental studies performed by Furuyama and Ohgane [1] and Moss [2] showed that the pulsating nature of the air flow affects the amount of fuel delivered by the carburetor. Furuyama found that the effect of pulsating air flow on fuel flow may be classified as: i) when the throttle plate opening is large and air flow is low, the fuel flow is higher at pulsating flow than at steady flow, and ii) when the throttle plate opening is large and air flow is high, the fuel flow is lower at pulsating flow than at steady flow. Moss’ experiments [1] agreed with the conclusions for the first case. Both researchers proposed that the fuel flow under dynamic air flow may be calculated by using the steady state prediction, and then corrected with a pulsation-correction factor. Two special considerations must be taken when predicting the fuel flow from the carburetor circuits: the characterization of the two-phase flow inside the emulsion tube and the characterization of the small metering orifices.
The only known work that has used CFD for the characterization of the flow across the carburetor was done by Wu, Feng and Liu [3]. But in their work, the carburetor was represented as a two-dimensional channel where the fuel tube was a large obstacle in the flow field. The only results shown in this work are the static pressure drop along the axis of the carburetor.
Thus, it can be inferred from these works that the flow through a carburetor can be successfully modeled using pressure variation as boundary conditions and the standardized k-epsilon turbulence model is competent enough to model the turbulence behavior in the flow.
OBJECTIVE OF THE PAPER
To carry out three dimensional CFD analysis of carburetor venturi to understand the effect of the various obstacles present in the flow domain like the fuel-tube, throttle plate and to optimize the design of carburetor by carrying out geometrical changes based on results obtained from CFD analysis of existing model.
• To perform CFD analysis by considering the following models. a) Ideal carburetor venturi
b) Existing carburetor venturi C) Modified carburetor venturi
MODELING
International Journal of Research in Engineering & Applied Sciences
http://www.euroasiapub.org 4
3.1 Basic steps of modeling: Stage 1: preprocessing
Geometry definition: the physical boundaries of the objects are defined in a 3-dimensional space.
Meshing: the volume bound by the body or the fluid domain is discretised into finite elements that are uniform or Non-uniform as the problem demands.
Model definition: the type of fluid modeling is defined in terms of the flow equations adopted or the energy Transfer models etc.
Boundary conditions: the boundary or end conditions of the flow are defined in the software module
The inlet boundary condition was defined with the isentropic stagnation pressure and temperature, and the outlet boundary condition was defined with the outlet static pressure. An ideal gas model was used in order to take into account the compressibility of the airflow.
3.2 Method
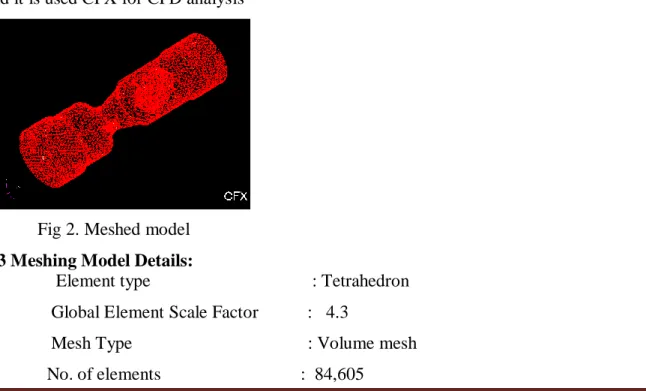
A three-dimensional model of a carburetor venturi was generated in CFD tool, The model build option crate line and create surface, by using extrude surface and then we create that venture geometry, this model saved In IGS for met and then it is export to using ICM software for meshing and element type Tetrahedron the mesh is created. This file is saved in *mesh for met and it is used CFX for CFD analysis
Fig 2. Meshed model 3.3 Meshing Model Details:
Element type : Tetrahedron Global Element Scale Factor : 4.3
International Journal of Research in Engineering & Applied Sciences
http://www.euroasiapub.org 5
3.4 Mathematical Modelling
Air is used as fluid media, which is assumed to be steady and incompressible. High Reynolds number k-ε turbulence model was used in the CFD model. This turbulence model is widely used in industrial applications. The equations of mass and momentum were solved using SIMPLE algorithm to get velocity and pressure in the fluid domain. The assumption of an isotropic turbulence field used in this turbulence model was valid for the current application. The near-wall cell thickness was calculated to satisfy the logarithmic law of the wall boundary. Other fluid properties were taken as constants. Filter media of intake system and air sensor were modeled as porous media using coefficients.
For porous media, it is assumed that, within the volume containing the distributed resistance there exists a local balance everywhere between pressure and resistance forces such that
= Where ξ
I (i = 1, 2, 3) represents the (mutually orthogonal) orthotropic directions.
K
i is the permeability
u
i is the superficial velocity in direction ξi
The permeability K
i is assumed to be a quasi linear function of the superficial velocity magnitude
of the form
Where α
i and βi are user-defined coefficients
Superficial velocity at any cross section through the porous medium is defined as the volume flow rate divided by the total cross sectional area (i.e. area occupied by both fluid and solid). In this analysis, α
i and βi are assumed to be same.
ANALASIS
INTRODUCTION
International Journal of Research in Engineering & Applied Sciences
http://www.euroasiapub.org 6
4.2The ANSYS CFX: solver uses the most modern solution technology with a coupled algebraic multi-grid solver and extremely efficient parallelization to help ensure that solutions are ready for analysis quickly and reliably. Solution analysis with the ANSYS CFX post-processor then gives users the power to extract any desired quantitative data from the solution; it also provides a comprehensive set of flow visualization options. Animations of flow simulations are easily generated, and 3-D images can be directly created using the freely-distributable 3-D viewer from ANSYS CFX.
CFX-5 consists of five software modules which are linked by the flow of information required to perform a CFD analysis.
In this pressure losses created by these elements reduce the mass flow rate that could be driven through the venturi for a given pressure difference between the inlet of the venturi and the intake manifold. The inlet obstacles, fuel tube, and throttle plate were modeled with in order to gain a better Understanding of the flow in complex venturis.
The RNG K-E turbulence model is used, with standard wall functions for near-wall treatment. The discretisation scheme used was second order in space. The convergence criteria were set to a maximum residual equal to 1x10⁻⁶ for the energy equation and to 1x10⁻⁴ for the other equations.
4.2 Governing Equations
Commercial CFD solver CFX was used for this study. It is a finite volume approach based solver which is widely used in the industries. Governing equations solved by the software for this study in tensor Cartesian form are following:
Continuity:
Momentum:
Where ρ is density, u
j is j the Cartesian velocity, p is static pressure, τis viscous stress tensor.
International Journal of Research in Engineering & Applied Sciences
http://www.euroasiapub.org 7
turbulence length scale, so the calculated turbulent diffusion is that which occurs only at the specified scale, whereas in reality all scales of motion will contribute to the turbulent diffusion. The RNG-approach, which is a mathematical technique that can be used to derive aturbulence model similar to the k-epsilon, results in a modified form of the epsilon equation which attempts to account for the different scales of motion through changes to the production term.
4.3 Transport Equations
There are a number of ways to write the transport equations for k and, a simple interpretation where bouyancy is neglected is
Where
And
With the turbulent viscosity being calculated in the same manner as with the standard k-epsilon model.
4.4 Boundary conditions
The carburetor venturi had an inlet diameter of 25 mm, a throat diameter of 12 mm and exit diameter of 20 mm. This venturi had inlet obstacles, a fuel tube. The inlet boundary conditions in CFX were set to the laboratory conditions (T0=293 K and P0=1 atm) and the outlet boundary condition to the outlet pressure in the low-pressure plenum in the flow bench _Pout=94.5 KPa, Four The CFD is used for assessing the details of the flow, the values of the discharge coefficients, and localized values of the flow variables; specifically, the static pressure at the tip of the fuel tube. The following sections present a systematic study of the effect of different carburetor parts. First, carburetor venturi is modeled without obstacles. Second, the inlet obstacles were added, and then the fuel tube was added to the geometry. Finally, how to effect of obstacles is study.
RESULTS AND DISCUSSION
International Journal of Research in Engineering & Applied Sciences
http://www.euroasiapub.org 8
By observing various types of the static pressure, velocity, total pressure and turbulent kinetic energy, for effecting on venturi with obstacles, effect on fuel tube, modified obstacles and effect on modified obstacles model, Figures are shown below
5.1 Venturi without obstacles:
The following figures shows the Static Pressure, Velocity, Turbulent Kinetic Energy, Total pressure and Velocity vector for a compressible air flow across the venturi without obstacles i.e. fuel tube and throttle plate.In fig 5.1 the Static Pressure is almost uniform in the radial direction except at the throat where it changes next to the wall. After venturi the pressure variation is almost constant (no pressure fluctuation). In fig 5.2 the velocity increases at the converging nozzle and then separates from the wall at the diffuser in the region of adverse pressure gradient. The velocity is almost constant behind the venturi.
5.1 Static Pressure 5.2 Velocity Pressure
5.3 Total Pressure 5.4 Turbulence Kinetic Energy
In fig 5.3 the total pressure (stagnation pressure) shows that it is uniform throughout the flow except at the wall of the throat. Generally the reduction in stagnation pressure creates wake region (turbulence region). In fig5.4 the turbulence kinetic energy field shows that the intensity of turbulence created. The highest turbulence region created at near wall throat.
International Journal of Research in Engineering & Applied Sciences
http://www.euroasiapub.org 9
The following figure shows the Static Pressure, Velocity, Turbulent Kinetic Energy, Total pressure and Velocity vector for a compressible air flow across the venturi with fuel tube of 3mm diameter with projection of 3mm at throat section i.e. 1/4th of throat diameter.
In fig 5.5 the presence of fuel tube strongly affects flow field and static pressure drop in the venturi. It reduces the cross sectional area and also comparatively lower pressure drop at throat in the radial direction. In addition, a sharp leading edge of the fuel tube creates a separation region, which results in a lower pressure at the tip of the fuel tube. Downstream of fuel tube, it is almost uniform in radial and axial directions
5.5 Static Pressure 5.6 Velocity Pressure
5.7 Total Pressure 5.8Turbulence Kinetic Energy
In fig (5.6&5.7) the presence of fuel tube effectively reduces the velocity and creates the wake region (fluctuating velocity field) behind the venturi. This wake zone may be responsible for fuel puddling after the carburettor; once the fuel droplet is captured in this region; there is no momentum to drive it to the manifold.
In fig 5.8 the stagnation pressure shows that there is a considerable reduction behind the venturi with the presence of fuel tube and ultimately creates turbulence region. The kinetic energy field shows that the wake is created in the downstream of fuel tube. The intensity of turbulence is high at the downstream and is moderate at the near wall throat.
5.3 Modified Design of obstacles
International Journal of Research in Engineering & Applied Sciences
http://www.euroasiapub.org 10 5.9 Modified Model
The carburetor model modified with throttle plate position of 75 degrees as shown. The volume mesh of the model has been generated with tetrahedron element of 1.5mm of size.
5.4 Effect of modified obstacles:
The models were analyzed for the same boundary conditions. The analyses of results for 75 degrees show that reduced stagnation pressure loss at downstream. The kinetic energy field shows that it is almost constant throughout the flow. The velocity vectors clearly shows that reduced flow recirculation at downstream
5.10 Gauge Total Pressure 5.11 Turbulent Kinetic Energy
5.12 Velocity Vector
International Journal of Research in Engineering & Applied Sciences
http://www.euroasiapub.org 11 5.4 Calculation of localized discharge coefficient:
In addition to getting the information about the overall discharge coefficient to correct the mass flow rate across the carburetor venturi given a pressure drop, it is possible to calculate a local discharge coefficient that may be used to get the static pressure at a particular location in the carburetor venturi. It is of great interest to use the information from the CFD simulations to set the appropriate boundary condition at the tip of the fuel tube in a fuel flow network. This result indicates that the assumption of isentropic flow is valid for the converging side of the carburetor venturi.
TABLE-1: shown the static pressure, mass flow rate, coefficient discharge improvement
CONCLUSION
CFD analysis is done using commercial CFD solver CFX software to analyze the flow behavior of the existing carburetor body used in small engines. The result of conventional throttle body positions indicates that flow recirculation at downstream which causes pressure fluctuations and increased stagnation pressure loss which is undesirable. More over the velocity vectors for various throttle body positions shows that the recirculation in the flow just before throttle body. Further increased discharge coefficient has been observed for the modified model.
S.N o
Description Static Pressure at throat in bar Pt
Stagnation Pressure at inlet venturi in bar P0
Mass flow rate in kg/sec
M
Coefficient of Discharge Cd
1 Plain venture 0.75563 0.999292 0.002914 0.473
2 Fuel tube without throttle
0.98055 0.99969 0.001189 0.324
3 Two Body throttle- 60 deg
0.98668 0.999892 0.001873 0.394
4 Two Body throttle- 75 deg
International Journal of Research in Engineering & Applied Sciences
http://www.euroasiapub.org 12 The analyses of results for 75 degrees show that reduced stagnation pressure loss at downstream. The kinetic energy field shows that it is almost constant throughout the flow. The velocity vectors clearly show that reduced flow recirculation at downstream shown in modified model. The results of these simulations indicate that CFD simulations can be used to understand the nature of the flow field in ventures with various positions and to find quantitative information that can be used as boundary conditions for additional systems coupled to the venturi.
Future work should focus on the analysis of the static pressure at different inlet obstacles, as well as next to the throttle plate, in order to improve on the design of flow systems incorporating complex venturis.
REFERENCES:
1. M. Furuyama and H. Ohgane. A comparison of pulsating and steady flows in terms of carburetor characteristics.
JSAE Review, pages 18–23, 1987.
2. P. J. Moss. Pulsation enrichment in carburetors. Automotive Engineer, pages 53–56, 1980.
3. B. Wu, Y. Feng, and J. Liu. Numerical simulation of gas-liquid two-phase flow in motorcycle carburetor. In Proceedings of the International Symposium on Multiphase Flow, pages 271–275, 1997.
4. Diego Arias, University of Wisconsin, compared the experimental results from the test-bench of a carburettor with the CFD results to establish the closeness of the CFD results with real-world results in terms of mass flow rate and coefficient of discharge.
5. M. Sivakumar, V. Balasubramanian from UCAL Fuel Systems Ltd and
6. V. Ganesan - Indian Institute of Technology Madras have utilized pressure based boundary conditions in their paper on CFD analysis of carburettors. This lends credibility to the use of pressure based boundary conditions in this project.