Sharif University of Technology
Scientia IranicaTransactions B: Mechanical Engineering http://scientiairanica.sharif.edu
Evaluation of microstructural eects on mechanical
properties of CT80 grade coiled tubing steel
H. Ghiasi
Technology Development Institute, The Academic Center for Education, Culture, and Research, Sadeghi St., Azadi Ave., Tehran, Iran.
Received 5 October 2016; received in revised form 28 May 2017; accepted 18 September 2017
KEYWORDS CT80 grade coiled tubing steel; Microstructure; Heat treatment; Mechanical properties; Fatigue life.
Abstract. The microstructure formation and mechanical properties of coiled tube CT80 grade steel were investigated with dierent heat treatments. Optical Microscopy (OM) and Scanning Electron Microscopy (SEM) were used to evaluate the microstructure. Acicular ferrite, polygonal and quasi-polygonal ferrite, granular bainite, martensite, pearlite, and small Martensite-Austenite (MA) islands with banding structure were examined in original and heat treated samples. In order to assess the eect of grain size and microstructure, mechanical properties were evaluated by hardness, charpy impact, tensile, and fatigue life tests. The best mechanical properties by tensile and fatigue tests were obtained in the normalized specimen with the grain size of ASTM 13.
© 2018 Sharif University of Technology. All rights reserved.
1. Introduction
The number of Coiled Tubes (CT) used in oil eld industries has increased in recent decades [1]. Appli-cations such as work strings, drill, siphon, and velocity strings as well as sucker rod systems are performed by coiled tubing [2]. Coiled tubes are integrated tubes with 6 km length, which are produced by forming of the steel sheet, welding with high-frequency electrical resistance welding, normalizing heat treatment, and nally wrapping on a spool. Coiled tubes endure plastic deformation due to unwrapping from the reel and straightening followed bending by the gooseneck device. Therefore, the life of these tubes is evaluated by ultra-low cycle fatigue. The amount of plastic strain imposed by the reel and devices of a well is in the order of 2 to 3%. The increase in the diameter of some tubes, which is in the order of 15%, is followed by this plastic
*. Tel: +98 21 66075198; Fax: +98 21 66075200 E-mail address: [email protected] (H. Ghiasi) doi: 10.24200/sci.2018.20677
deformation in the presence of internal pressure (about 60% of materials yield to stress) [3]. Some models have been conducted by researchers to estimate the fatigue life of the coiled tubes as exact as possible; therefore, it has a great impact on economical features of oil eld industries [4-6]. Some apparatuses have also been introduced by researchers in order to obtain empirical data on fatigue life of coiled tubes [5,7,8]. Zhou and his co-workers revealed the eect of microstructure on yield and tensile strength, and calculated the ratio of yield strength over tensile strength in order to predict fatigue life [9]. Many studies were performed by researchers to evaluate microstructure and the relation between microstructure and mechanical properties of X70 and X80 steels [10-15]. The complexity of the microstructure in these steels has been revealed in the mentioned investigations. It is noted in API 5ST [16] that the grain size for steel coiled tubing should be ASTM 8 or ner; nonetheless, the produced coiled tubes have the grain size ASTM 12 or 13, which is far smaller than ASTM 8. In this article, the eect of grain size and microstructure on mechanical properties in general, and on fatigue life in particular is examined.
2. Experimental procedure
The CT80 grade of coiled tubing was assessed in this study. The chemical composition of this coiled tube was gained by spark emission spectroscopy; the result (wt%) was: 0.135 C, 0.351 Si, 0.744 Mn, 0.0171 P, 0.0024 S, 0.636 Cr, 0.167 Ni, 0.126 Mo, 0.0116 Nb, and 0.0175 Ti. The original samples possessed the grain size of ASTM 13. Consequently, in order to attain specimens with the grain size of ASTM 10 and 8, annealing heat treatment process was conducted on original samples. Specimens were held for 45 min at the temperatures of 940 and 860C, and were cooled
to the room temperature in the furnace in order to obtain ASTM 8 and 10 grain sizes, respectively. In order to attain ASTM 13 grain size, samples were normalized at 800C for 10 min in the furnace and
cooled by the still air. Microstructure was studied by a Zeiss optical microscope (model Neophot 32). Etchant solution, nital 2%, was used to reveal the microstructure. Grain size analysis was conducted by Clemex software, and was compatible with ASTM E112 standard. The samples for microstructure evaluation were taken from transverse section of the pipe.
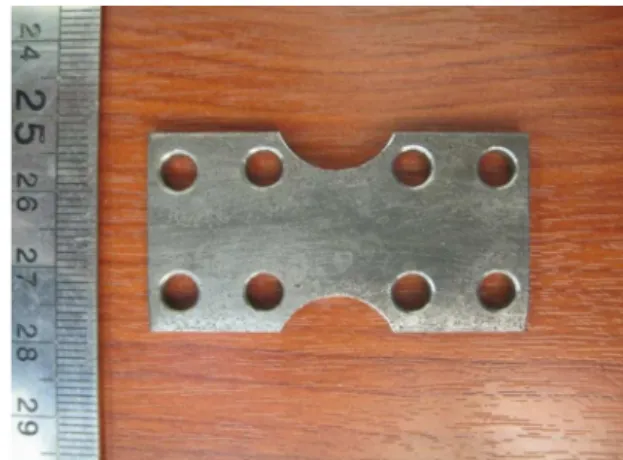
Tensile, hardness, impact, and plane bending fatigue tests were the 4 mechanical tests used in this study. Tensile test specimens were made in accordance with API 5ST. The dimensions of specimens for the mentioned test were 12:632:8550 mm. The Schenck 250 KN test machine was utilized in order to perform tensile test. The hardness test was conducted by the Wolpert testing machine in vickers method at 30 kgf compatible with ASTM E384. The impact test was done in line with ASTM E23. The samples for the impact test were longitudinal and the notch was located on the width of the tube. The charpy impact test was carried out on the sub-size specimens with dimensions of 2:551055 mm by a Zwick Roell testing apparatus. The fatigue specimens are shown in Figure 1, and the test was plane bending fatigue test. The dimensions of these samples were 48 2:78 25:45 mm. In order
Figure 1. Fatigue test specimens.
to simulate the actual condition for specimens, the yield radius was calculated by Eq. (1). The bending radius was taken much smaller than the yield radius (Eq. (2)) so that the whole sample was in plastic region. The radius was translated to amplitude of the angle, which should be applied to samples. Consequently, the amplitude of the angle was considered 10. The
rotational speed of the fatigue test was 1400 rpm. All of these 4 mechanical tests were designed in order to evaluate the eect of microstructure and grain size on the performance of steel coiled tubes.
Ry= Ec
y; (1)
r = R8y: (2)
In the above equations, E is the Young modulus, y
is the yield stress for CT80 based on API 5ST, c is the biggest distance between neutral axis and surface of specimen, Ry is yield radius, and r is the radius
applied to test samples. 3. Results and discussion
In order to examine the mechanical aspects of this steel in a better fashion, microstructural evaluation is discussed rstly. As it was mentioned above, 4 samples are evaluated in the following.
3.1. Microstructural evaluation 3.1.1. Original steel coiled tube specimens
The microstructure of original steel coiled tubing is shown in Figure 2. As it seems in Figure 2, there is a complex microstructure in this specimen. Comparison of this microstructure with other studios shows that acicular ferrite is the main phase in these microstructures [9,10,15]. More precise examination of the microstructure by SEM shows that there is some
Figure 2. The microstructure of the original steel coiled tube.
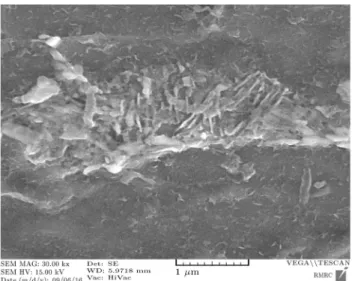
Figure 3. The SEM image of the original steel coiled tube.
Figure 4. Banding structure in the microstructure of original steel coiled tube.
bainite phase in the banding microstructure (Figures 3 and 4). It is demonstrated by former investigations that small quantity of martensite-austenite islands can be formed in both acicular ferrite and granular bainite boundaries [11]. The banding microstructure (Figure 4) is due to an inappropriate continuous cast-ing process, which results in segregation of carbon and manganese element in the alloys [14]. In the following, pearlite phase is formed in the banding microstructure, because both carbon and manganese elements facilitate pearlite formation. It is also pos-sible that bainite and martensite phases may exist in accordance with the carbon and manganese contents. In this specimen, the bainite phases are formed on the banding microstructure. Consequently, after the rolling process, these bainite phases are aligned in the direction of rolling. To sum up, the matrix for this steel is the combination of quasi-polygonal and acicular ferrite, and banding structure of bainite with the small amount martensite islands. The grain size
Figure 5. The microstructure of the specimen annealed at 940C.
for this specimen is about ASTM 13 (mean diameter is 4 m).
3.1.2. Specimens annealed at 940C
The microstructure of the annealed specimens is shown in Figure 5. In this microstructure, the grain size of ferrite phases is about ASTM 8 (mean diameter is 22.5 m). This is mainly because of high temperature and slow cooling rate of the annealing process, which enhances the chance of grain growth. In this specimen, as in the original specimen, the banding microstructure is seen, but in a larger scale. In this specimen, there is no evidence for the existence of phases such as acicular and quasi-polygonal ferrite, bainite, and martensite-austenite islands. Only polygonal ferrite and pearlite phases appear in this specimen.
3.1.3. Specimens annealed at 860C
The microstructure of this specimens is shown in Figure 6. Comparison between Figures 5 and 6 admits smaller grain size for the one annealed at 860C. The
grain size for this specimen is about ASTM 10 (mean diameter is 11.2 m). The lower annealing temperature
Figure 6. The microstructure of the specimen annealed at 860C.
Figure 7. Banding microstructure in the specimens annealed at (a) 860C and (b) 940C.
shows not only the ner microstructure, but also a closer and smaller banding microstructure. This dierence in the banding microstructure is shown in Figure 7. Finally, this sample possesses the pearlite and polygonal ferrite microstructures without any bainite, acicular, and quasi-polygonal ferrite.
3.1.4. Specimens normalized at 800C
The microstructure of normalized specimen is shown in Figure 8. The microstructure of this sample includes the polygonal and quasi-polygonal ferrite and small quantity of acicular ferrite. Moreover, the banding microstructure can be seen in Figure 8, which is similar to other samples. In contrast with annealed samples, the banding microstructure is formed by martensite instead of pearlite phase. In order to evaluate the banding microstructure, the sample was studied by SEM (Figure 9). By assessment of Figure 9, it may be established that this structure is made of martensite. There are two main reasons for this. First, the cooling rate in normalizing process could be high enough to form martensite phase. Second, the
Figure 8. The microstructure of normalized specimen.
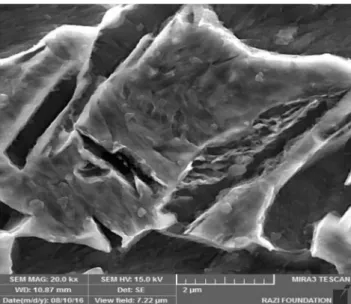
Figure 9. SEM image of the normalized specimen.
former investigation showed that in high segregation of Mn element, the continuous cooling transformation diagram would change and there would be the chance for the formation of martensite and bainite instead of perlite phase [14]. As a consequence, the microstruc-ture of normalized specimen is the combination of polygonal and quasi-polygonal ferrite as the matrix with banding microstructure of martensite. The grain size for normalized sample is around ASTM 13. 3.2. Mechanical evaluation
3.2.1. Hardness test
The hardness of specimens is presented in Table 1. As it is specied, hardness of the specimens increases by decrease in the grain size of samples. The hardness of original steel coiled tube and normalized specimens is the same and around 211 VHN. This is due to the same grain size and similar phases in these samples. It could be concluded that the grain size has a great impact on hardness properties. All of these hardness amounts are compatible with API 5ST requirements (lower than 22 Rockwell C).
3.2.2. Charpy impact test
The test results are listed in Table 1. As it can be understood from the data, the amounts of absorbed energy in all samples are much lower than the per-mitted amount by API 5ST standard. Investigations have revealed that by decreasing the size of speci-mens to very small sizes, the amount of absorbed
Table 1. Hardness and charpy impact test results.
Samples ASTM 13
(used CT)
ASTM 8 (annealed)
ASTM 10 (annealed)
ASTM 13 (normalized)
Hardness (VHN) 212 127 134 212
energy decreases [17]. Therefore, in this research, only fracture energy data is used for comparison of samples. As it is obvious, the toughness increases by decreasing the grain size of steels with similar phases. Nonetheless, if the microstructure of steels possesses various phases by dierent heat treatments or thermo-mechanical processes, then, in the toughness analysis, in addition to grain size, existing phases should also be taken into account. As it was mentioned above, specimens annealed at 860 and 940C have the same
microstructure and dierent grain sizes. Consequently, the impact strength of the smaller grain size (28 J) is higher than that of the biggest grain size (25 J).
Quasi-polygonal and acicular ferrite as well as some granular bainite with few martensite islands are the phases in original steel coiled tube microstructure. As it was claimed by other researchers [18], the exis-tence of acicular ferrite could improve the toughness of steels. Furthermore, if the matrix of acicular ferrite is combined with the bainite microstructure and marten-site islands (4-5% volume), the toughness could become even better. Therefore, the original steel coiled tube has the highest impact energy (30 J), even though it has experienced some plastic strains.
The normalized specimen has the lowest impact energy (17 J). In order to elucidate this reduction in impact energy, the microstructure of this sample must be investigated. As it was declared above, in this sample, the banding structure made by martensite was obtained. It has been stated by researchers that the amount of impact energy decreases by forming of banding structure with granular bainite and marten-site [14]. There are 2 parameters aecting the results of impact test. First, small grain size (ASTM 13) improves the toughness; however, the banding microstructure of martensite is against this improvement. Second, the smallness of the size the specimens enhances the eect of banding microstructure in impact charpy test. 3.2.3. Tensile test
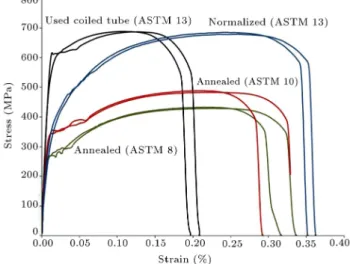
The tensile test data for all samples is superimposed and shown in Figure 10. The tensile test data is summarized in Table 2. As it can be seen in Figure 10, for both annealing and normalizing of specimens, the elongation of samples increases in comparison with the original steel coiled tubing. This is due to the plastic deformation of original steel coiled tubing during its
ap-Figure 10. Tensile test graphs.
plication. This plastic deformation or work hardening, which originates from the bending process, increases the yield strength of the material. As it is obvious, the tensile strength of the material does not change by work hardening of a sample. Consequently, ratio of yield strength to tensile strength increases. It has been claimed in other researches that by increasing the so called ratio, the toughness and fatigue life of the samples decrease [9].
By comparison of tensile diagrams for annealed specimens (ASTM 8 and 10), it can be concluded that ner grains will increase both the yield and tensile strength. In general, increase in yield strength is more than increase in tensile strength by reduction in grain size. However, in this study, the yield and tensile strength of the samples increase by the same amount. As a result, the ratio of yield strength to tensile strength decreases for specimens with grain size of ASTM 10 in comparison with those with grain size of ASTM 8.
The normalized specimen has the best mechanical properties throughout the tensile test in this research. Higher elongation, higher tensile strength, and lower ratio of yield to tensile strength in comparison with other samples are the reasons that normalized specimen possesses the best mechanical properties. The rst reason for this improvement in properties is smaller grain size than annealed samples. Nonetheless, small grain size could not be the only reason for the
in-Table 2. Tensile test results.
Samples y (MPa) uts (MPa) Elongation (%) y=uts
ASTM 13 (used CT) 600, 617 687, 688 16.8, 17.8 0.87 ASTM 8 (annealed) 266, 269 429, 432 26.4, 27.0 0.62 ASTM 10 (annealed) 345, 356 483, 489 22.4, 27.0 0.72 ASTM 13 (normalized) 398, 400 679, 685 26.8, 28.0 0.59
crease in the yield and tensile strength by the same amount. The second reason is the formation of dierent phases. In contrast with annealed samples that have ferrite-pearlite microstructure, the normalized sample possesses quasi-polygonal ferrite and martensite (dual phase steel). Martensite, as a strengthening phase, will increase tensile strength and work hardening exponent. By these increases, the ratio of yield to tensile strength will decrease.
Comparison between original steel coiled tub specimen and normalized specimen reveals that work hardening, which happens in the original samples, is the factor that results in higher yield stress. Nonethe-less, the tensile strength for both of them is the same, as both of these samples have the same microstructure to some extent; one is the combination of polygonal and semi-polygonal ferrite and martensite, and the other is the mixture of acicular ferrite and bainite with martensite islands. It must be noted that the microstructure of the original sample with the acicular ferrite matrix could have the best mechanical proper-ties; nevertheless, the cold work conducted on the tube during its application reduced the tensile properties. 3.2.4. Fatigue test
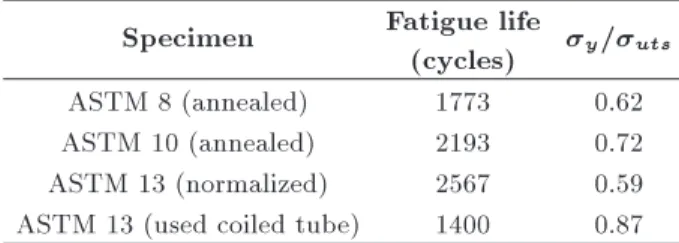
The fatigue test results are summarized in Table 3. As it is shown, the fatigue life of specimens increases by reduction in the grain size. It has been stated in former studies that the fatigue life and impact strength of the samples increase by decrease in the ratio of yield to tensile strength [9,11,15]. Consequently, it may be concluded that better fatigue life will be obtained by the annealed specimens with the grain size of ASTM 8. However, fatigue test results reveal that the specimen with the grain size of ASTM 10 has higher fatigue life in spite of the higher ratio of yield to tensile strength. It may be concluded that the mentioned ratio could predict the life of specimens, but not always accurately. As a result, in order to investigate the fatigue life of the samples, an appropriate fatigue test must be conducted.
The lowest fatigue life is obtained by the original specimen. This is mainly because the tube tolerates fatigue cycle during its application. Consequently, some portion of the fatigue life of the tube is consumed prior to the fatigue test. This specimen also has the highest yield to tensile strength; thus, the prediction
Table 3. Fatigue test results. Specimen Fatigue life
(cycles) y=uts
ASTM 8 (annealed) 1773 0.62
ASTM 10 (annealed) 2193 0.72 ASTM 13 (normalized) 2567 0.59 ASTM 13 (used coiled tube) 1400 0.87
for this specimen is in accordance with the fatigue test results.
The highest fatigue life is attained by the normal-ized specimen. The main reason for this achievement is the very ne grain size. Moreover, the normalizing heat treatment reduces the work hardening of the original specimen. These specimens have the lowest ratio of yield to tensile strength; hence, these specimens are in good agreement with the prediction for fatigue life.
Results of the fatigue test show the eect of grain size on the fatigue life of specimens. Generally, the life of specimens increases by decrease in grain size. The reduction in grain size simultaneously improves the toughness and strength of the material. Consequently, the fatigue life will be increased.
Another important point in fatigue test is the eect of microstructure on fatigue life. By decreasing the grain size from ASTM 8 to ASTM 10, the fatigue life increases by 24%. In the following, by reduction in the grain size from ASTM 10 to ASTM 13, the fatigue life increases by 17%. It could be concluded that the rate of increase in fatigue life reduces by decrease in the grain size. Nonetheless, it must be considered that this reduction in the rate of increase in fatigue life is related to microstructure and the distribution of phases. As it was mentioned in the assessment of microstructure of the normalized specimen, the banding microstructure by martensite causes reduction in the toughness. As a result, in the normalized specimen, there are two con-tradicting factors that aect fatigue life. The rst one is the ne grain size and martensite as a strengthening phase, which has a positive eect on the life. The sec-ond one is the banding microstructure by martensite, which has negative eect on the life (it is a suitable place for crack propagation). The combination of these factors reveals that the rate of increase in fatigue life by reducing the grain size decreases (17 < 24%). 4. Conclusions
1. The fatigue life of steel coiled tubes enhanced signicantly by decrease in grain size;
2. Acicular ferrite, bainite, and small amount of martensite islands resulted in the improvement of low cycle fatigue life;
3. Uncontrolled amount of bainite and martensite islands, and precluding the formation of band-ing structure, especially the one with martensite and granular bainite, were important factors that caused reduction in toughness and fatigue life. Acknowledgments
This study was nancially supported by Technology Development Institute of Jahad Sharif. Also, the
author would like to acknowledge Mr. Keivan Ferasat for his helps and assistances.
References
1. Gaddy, D.E. \Coiled-tubing drilling technologies tar-get niche markets", Oil Gas J., 98(2), pp. 29-34 (2000).
2. API Recommended Practice 5C8, Recommended Prac-tice for Care, Maintenance and Inspection of Coiled Tubular Product, American Petroleum Institute, 9th Draft (Rev. 1), pp. 1-4, January (2010).
3. Tipton, S.M., Multiaxial Plasticity and Fatigue Life Prediction in Coiled Tubing, 3, ASTM STP 1292, pp. 283-304 (1995).
4. Newman, K.R., Newburn, D.A., and Schlumberger, D. \Coiled-tubing-life modeling", The Paper SPE 22820, 66th Annual Technical Conference and Exhibition of the Society of Petroleum Engineers, Dallas, TX, Soci-ety of Petroleum Engineers Inc., pp. 13-19 (1991).
5. Newman, K.R., Sathuvali, U.B., and Wolhart, S. \Elongation of coiled tubing during its life", The Paper SPE 38408, 2nd North American Coiled Tubing Roundtable, Montgomery, TX, Society of Petroleum Engineers Inc., pp. 238-245 (1997).
6. Behenna, F.R., Myrick, D.D., Stanley, R.K., Tipton, S.M., and Hammond, W.A. \Field validation of a coiled tubing fatigue model", The Paper SPE 81726, the SPE/ICoTA Coiled Tubing Conference, Houston, TX, Society of Petroleum Engineers Inc., pp. 1-6 (2003).
7. Newman, K.R., Brown, P.A., and Dowell, S. \Devel-opment of a standard coiled-tubing fatigue test", The Paper SPE 26539, 68th Annual Technical Conference and Exhibition of the Society of Petroleum Engineers, Houston, TX, Society of Petroleum Engineers Inc., pp. 303-309 (1993).
8. Li, X., Fan, J., Fan, L., Lei, J., and Sun, Y. \Ex-perimental study on the growth of diameter for coiled tubing under dierent internal pressure", Journal of Software Engineering, 7, pp. 106-113 (2013).
9. Zhou, L., Jiang, B., Li, M., Yuan, F., Zhang, C., and Liu, Y. \Microstructure control of non-quenched and tempered CT80 grade coiled tubing steel", Acta Metall. Sin. (Engl. Lett.), 27, pp. 464-468 (2014).
10. Zhou, M., Du, L., and Liu, X. \Microstructure and mechanical properties of X80 pipeline steels in dierent
cooling schedules", Acta Metall. Sin. (Engl. Lett.), 23, pp. 171-175 (2010).
11. Shin, S.Y., Woo, K.J., Hwang, B., Kim, S., and Lee, S. \Fracture-toughness analysis in transition-temperature region of three American petroleum in-stitute X70 and X80 pipeline steels", Metall. Mater. Trans. A, 40, pp. 867-876 (2009).
12. Mendoza, R., Alanis, M., Perez, R., Alvarez, O., Gon-zalez, C., and Juarez-Islas, J.A. \On the processing of Fe-C-Mn-Nb steels to produce plates for pipelines with sour gas resistance", Mater Sci & Eng A, 337, pp. 115-120 (2002).
13. Wang, C., Wu, X., Liu, J., and Xu, N. \Transmission electron microscopy of martensite/austenite islands in pipeline steels X70", Mater Sci & Eng A, 438-440, pp. 267-271 (2006).
14. Feng, R., Li, S., Zhu, X., and Ao, Q. \Microstructure characterization and formation mechanism of abnor-mal segregation band of hot rolled ferrite/pearlite steel", J. Alloys Compd., 646, pp. 787-793 (2015).
15. Wang, W., Yan, W., Zhu, L., Hu, P., Shan, Y., and Yang, K. \Relation among rolling parameters, mi-crostructure and mechanical properties in an acicular ferrite pipeline steel", Mater. Des., 30, pp. 3436-3443 (2009).
16. American Petroleum Institute, API Specication 5ST, Specication for Coiled Tubing, American Petroleum Institute, 1st Ed., pp. 13 (2010).
17. Benzerga, A.A., Tvergaard, V., and Needleman, A. \Size eects in the charpy V-notch test", Int. J. Fract., 116, pp. 275-296 (2002).
18. Edmonds, D.V. and Cochrane, R.C. \Structure-property relationships in bainitic steels", Metall. Mater. Trans. A, 21, pp. 1527-1540 (1990).
Biography
Hasan Ghiasi received his BSc degree from Sharif University of Technology in 1998 and his MSc degree from Tehran University in 1999. Since 1997, he has been working in Jihad Technology Development Research Institute of Sharif University. He is currently working as a member of the faculty, Research Assistant Professor, and Director of the Metallurgical Engineer-ing Research Group.